Introduction to Technical Reference Manuals for Energy Efficiency

- Slides: 64
Introduction to Technical Reference Manuals for Energy Efficiency Programs Presented by: Steven Schiller, P. E. Schiller Consulting, Inc. steve@schiller. com Month date, year
Topics Context/Background on EE EM&V Introduction to TRMs Why use TRMs TRM examples How To Set Up and Use TRMs EM&V and TRM Resources Intent is for informal presentation and discussion TRM Presentation - Schiller
Sources Several of the slides and/or presentation points in this presentation were kindly provided by other people. These particularly include: Erin Carroll, VEIC, ecarroll@veic. org Tom Eckman, Northwest Power Planning Council, teckman@nwcouncil. org Sami Khawaja, Cadmus, Sami. Khawaja@cadmusgroup. com Elizabeth Titus, TRM Manager, NEEP, EM&V Forum, etitus@neep. org TRM Presentation - Schiller
Context and Background on EE EM&V TRM Presentation - Schiller
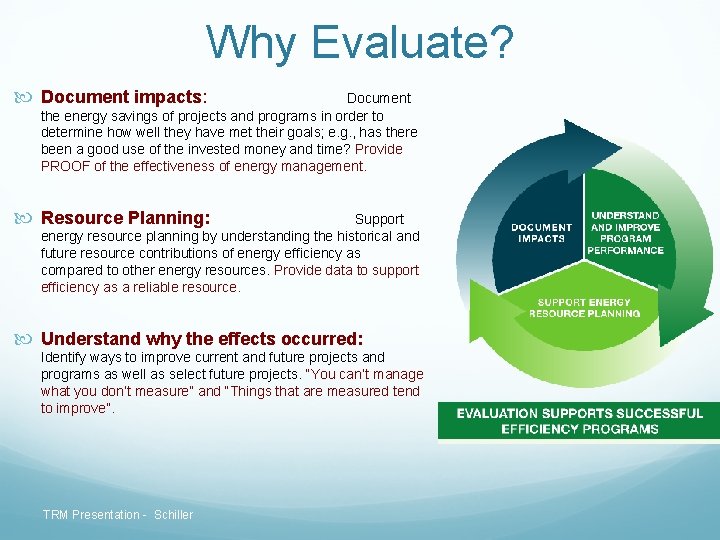
Why Evaluate? Document impacts: Document the energy savings of projects and programs in order to determine how well they have met their goals; e. g. , has there been a good use of the invested money and time? Provide PROOF of the effectiveness of energy management. Resource Planning: Support energy resource planning by understanding the historical and future resource contributions of energy efficiency as compared to other energy resources. Provide data to support efficiency as a reliable resource. Understand why the effects occurred: Identify ways to improve current and future projects and programs as well as select future projects. “You can’t manage what you don’t measure” and “Things that are measured tend to improve”. TRM Presentation - Schiller
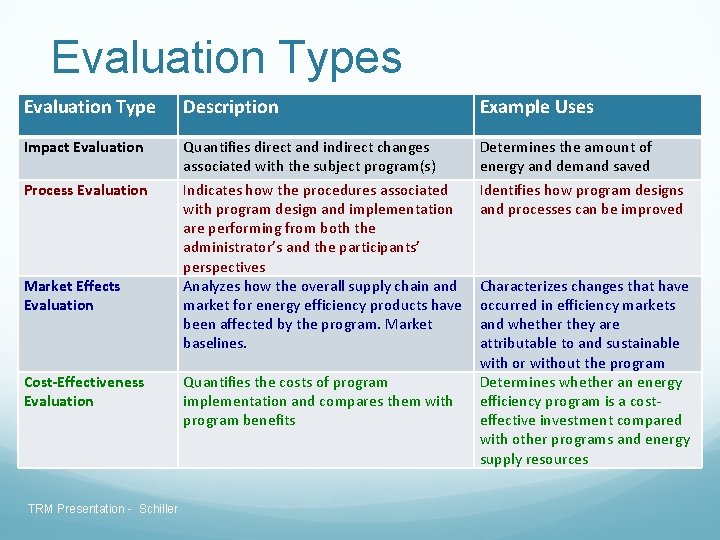
Evaluation Types Evaluation Type Description Example Uses Impact Evaluation Quantifies direct and indirect changes associated with the subject program(s) Indicates how the procedures associated with program design and implementation are performing from both the administrator’s and the participants’ perspectives Analyzes how the overall supply chain and market for energy efficiency products have been affected by the program. Market baselines. Determines the amount of energy and demand saved Identifies how program designs and processes can be improved Process Evaluation Market Effects Evaluation Cost-Effectiveness Evaluation TRM Presentation - Schiller Quantifies the costs of program implementation and compares them with program benefits Characterizes changes that have occurred in efficiency markets and whether they are attributable to and sustainable with or without the program Determines whether an energy efficiency program is a costeffective investment compared with other programs and energy supply resources
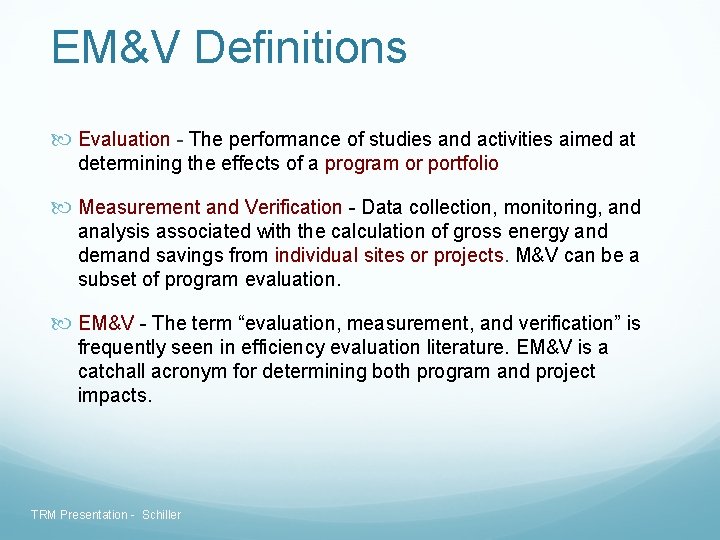
EM&V Definitions Evaluation - The performance of studies and activities aimed at determining the effects of a program or portfolio Measurement and Verification - Data collection, monitoring, and analysis associated with the calculation of gross energy and demand savings from individual sites or projects. M&V can be a subset of program evaluation. EM&V - The term “evaluation, measurement, and verification” is frequently seen in efficiency evaluation literature. EM&V is a catchall acronym for determining both program and project impacts. TRM Presentation - Schiller
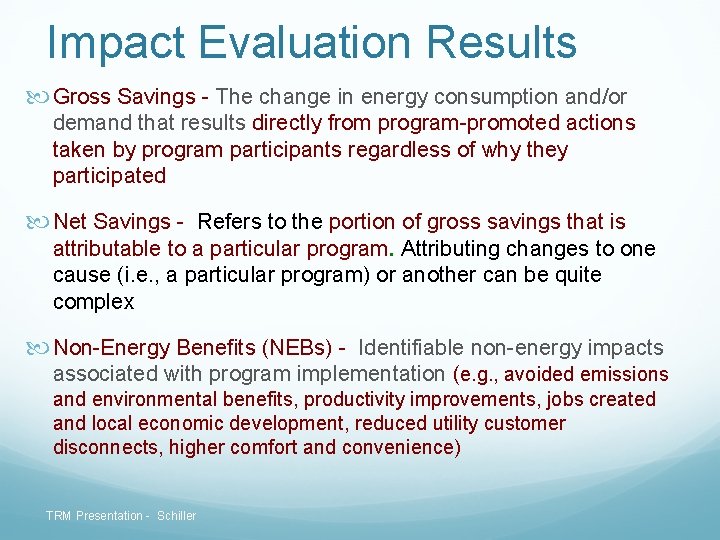
Impact Evaluation Results Gross Savings - The change in energy consumption and/or demand that results directly from program-promoted actions taken by program participants regardless of why they participated Net Savings - Refers to the portion of gross savings that is attributable to a particular program. Attributing changes to one cause (i. e. , a particular program) or another can be quite complex Non-Energy Benefits (NEBs) - Identifiable non-energy impacts associated with program implementation (e. g. , avoided emissions and environmental benefits, productivity improvements, jobs created and local economic development, reduced utility customer disconnects, higher comfort and convenience) TRM Presentation - Schiller
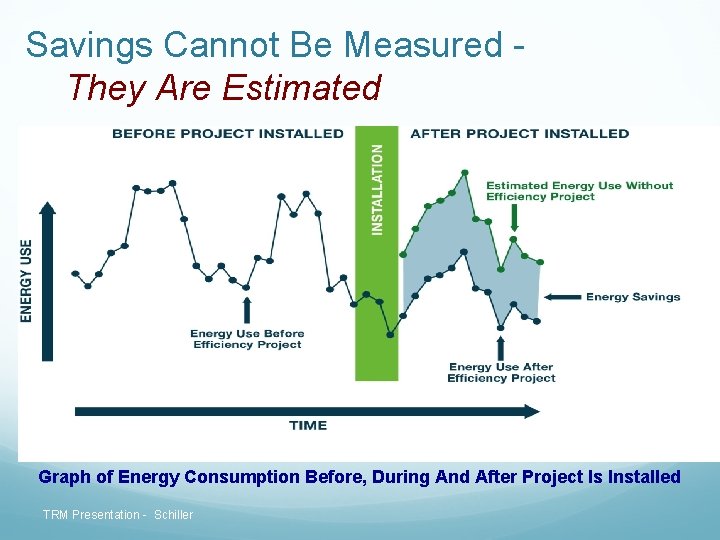
Savings Cannot Be Measured - They Are Estimated Graph of Energy Consumption Before, During And After Project Is Installed TRM Presentation - Schiller
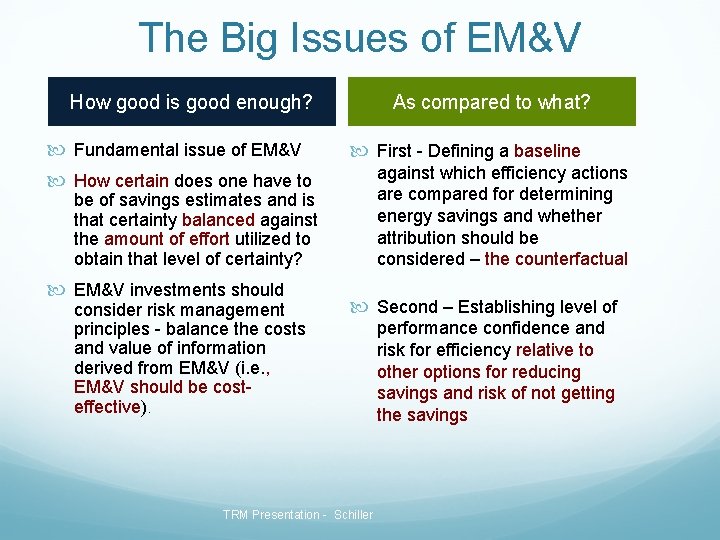
The Big Issues of EM&V How good is good enough? Fundamental issue of EM&V As compared to what? First - Defining a baseline against which efficiency actions are compared for determining energy savings and whether attribution should be considered – the counterfactual How certain does one have to be of savings estimates and is that certainty balanced against the amount of effort utilized to obtain that level of certainty? EM&V investments should consider risk management principles - balance the costs and value of information derived from EM&V (i. e. , EM&V should be costeffective). Second – Establishing level of TRM Presentation - Schiller performance confidence and risk for efficiency relative to other options for reducing savings and risk of not getting the savings
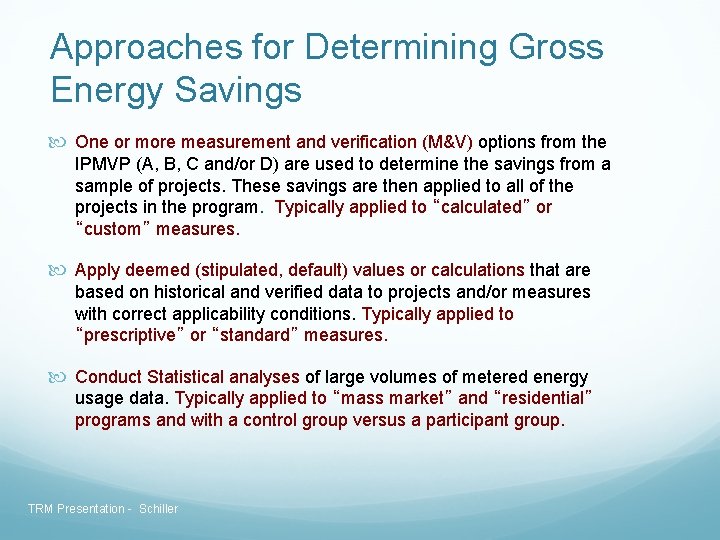
Approaches for Determining Gross Energy Savings One or more measurement and verification (M&V) options from the IPMVP (A, B, C and/or D) are used to determine the savings from a sample of projects. These savings are then applied to all of the projects in the program. Typically applied to “calculated” or “custom” measures. Apply deemed (stipulated, default) values or calculations that are based on historical and verified data to projects and/or measures with correct applicability conditions. Typically applied to “prescriptive” or “standard” measures. Conduct Statistical analyses of large volumes of metered energy usage data. Typically applied to “mass market” and “residential” programs and with a control group versus a participant group. TRM Presentation - Schiller
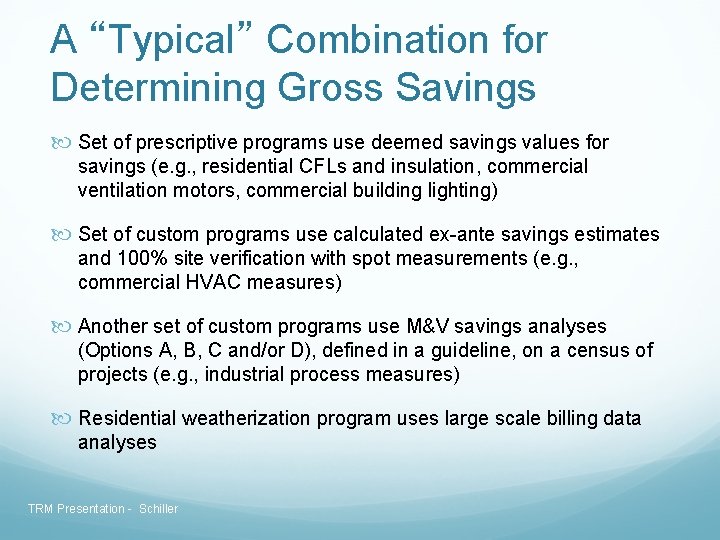
A “Typical” Combination for Determining Gross Savings Set of prescriptive programs use deemed savings values for savings (e. g. , residential CFLs and insulation, commercial ventilation motors, commercial building lighting) Set of custom programs use calculated ex-ante savings estimates and 100% site verification with spot measurements (e. g. , commercial HVAC measures) Another set of custom programs use M&V savings analyses (Options A, B, C and/or D), defined in a guideline, on a census of projects (e. g. , industrial process measures) Residential weatherization program uses large scale billing data analyses TRM Presentation - Schiller
Introduction to TRMs TRM Presentation - Schiller
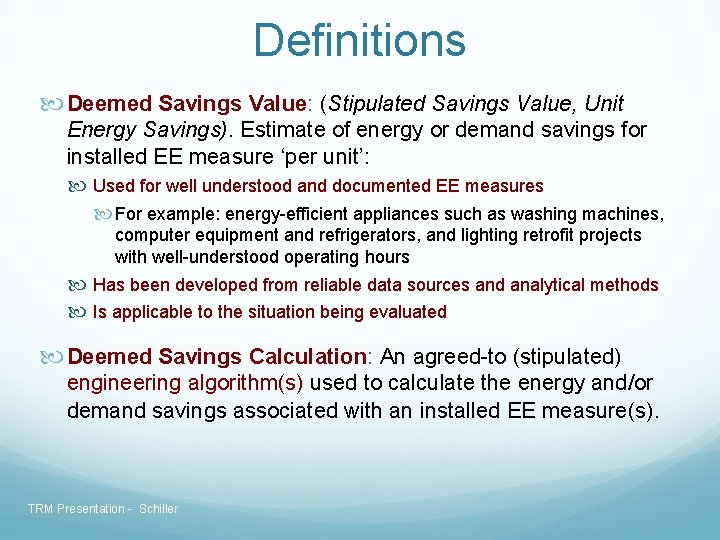
Definitions Deemed Savings Value: (Stipulated Savings Value, Unit Energy Savings). Estimate of energy or demand savings for installed EE measure ‘per unit’: Used for well understood and documented EE measures For example: energy-efficient appliances such as washing machines, computer equipment and refrigerators, and lighting retrofit projects with well-understood operating hours Has been developed from reliable data sources and analytical methods Is applicable to the situation being evaluated Deemed Savings Calculation: An agreed-to (stipulated) engineering algorithm(s) used to calculate the energy and/or demand savings associated with an installed EE measure(s). TRM Presentation - Schiller
Deemed Savings They are used a lot! But, Must Be Used With Caution Have to be applied where appropriate – only! The use of deemed values in a savings calculation is an agreement to accept a stipulated value, irrespective of what actually “happens”. When using deemed values, it is important to realize that technologies alone do not save energy - it is how they are used that saves energy TRM Presentation - Schiller
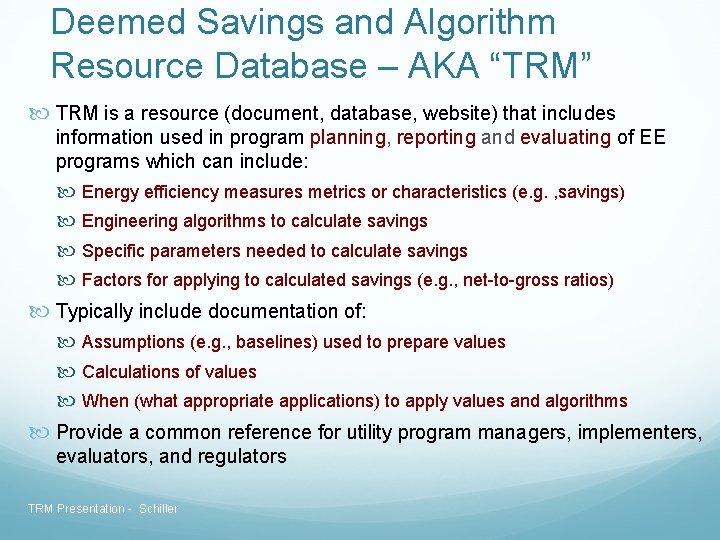
Deemed Savings and Algorithm Resource Database – AKA “TRM” TRM is a resource (document, database, website) that includes information used in program planning, reporting and evaluating of EE programs which can include: Energy efficiency measures metrics or characteristics (e. g. , savings) Engineering algorithms to calculate savings Specific parameters needed to calculate savings Factors for applying to calculated savings (e. g. , net-to-gross ratios) Typically include documentation of: Assumptions (e. g. , baselines) used to prepare values Calculations of values When (what appropriate applications) to apply values and algorithms Provide a common reference for utility program managers, implementers, evaluators, and regulators TRM Presentation - Schiller
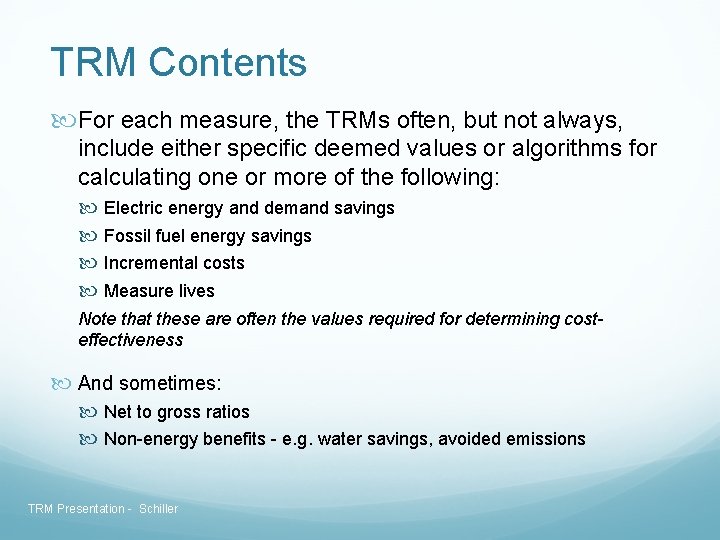
TRM Contents For each measure, the TRMs often, but not always, include either specific deemed values or algorithms for calculating one or more of the following: Electric energy and demand savings Fossil fuel energy savings Incremental costs Measure lives Note that these are often the values required for determining costeffectiveness And sometimes: Net to gross ratios Non-energy benefits - e. g. water savings, avoided emissions TRM Presentation - Schiller
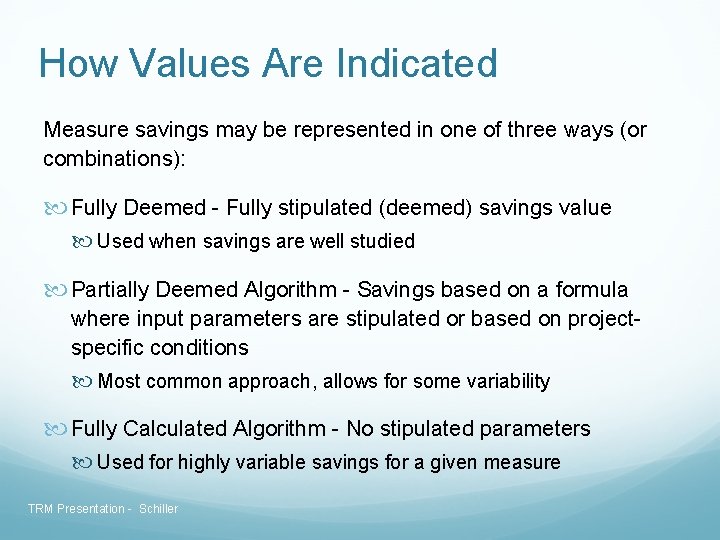
How Values Are Indicated Measure savings may be represented in one of three ways (or combinations): Fully Deemed - Fully stipulated (deemed) savings value Used when savings are well studied Partially Deemed Algorithm - Savings based on a formula where input parameters are stipulated or based on projectspecific conditions Most common approach, allows for some variability Fully Calculated Algorithm - No stipulated parameters Used for highly variable savings for a given measure TRM Presentation - Schiller
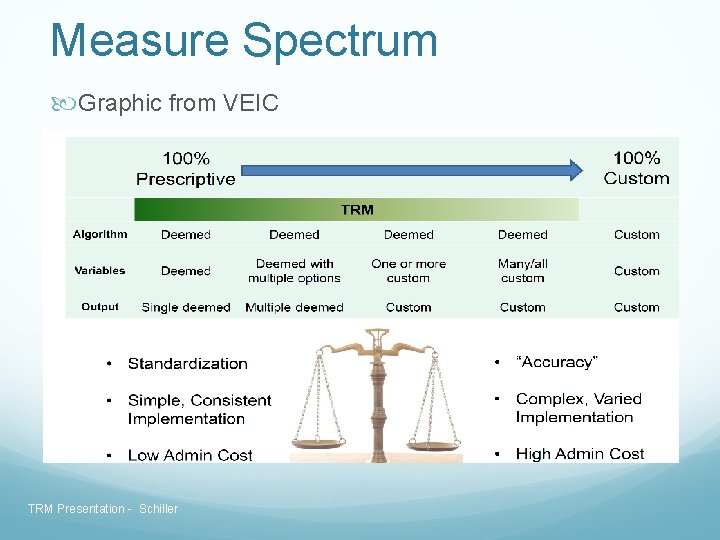
Measure Spectrum Graphic from VEIC TRM Presentation - Schiller
Applicability Conditions Graphic from VEIC TRM Presentation - Schiller
TRM Formats Can be in different formats Online database Downloadable database (most common): Electronic Database – often Excel worksheets, provides lookup values for tracking system PDF – text format with common sections for each measure protocol; most common format for recent TRMs Word – text format, similar to PDFs TRM Presentation - Schiller
TRM Coverage and Administration: Geographic or Jurisdictional Options Regional/Statewide Used to specify the basis for determining savings values claimed by any program administrator (e. g. , utility) in a region or state. Often developed through a multiple stakeholder process Administered by regional non-profit, state commission or agency, advisory committee, program administrator Program Administrator (e. g. , utility) Used to specify the savings values claimed by a single utility. Often developed by that utility. Administered by utility TRM Presentation - Schiller
Why Use TRMs TRM Presentation - Schiller
TRM Advantages Saves time and money while providing relative accuracy – calculate once for state, versus over and over again for each utility and each program (and project? ), and perhaps doing that every year Allows evaluators to better allocate resources Pre-vetted, pre-approved values – reduce regulatory risk and provide certainty for regulator, utility, implementer and (maybe) customer Maintains state-wide consistency across utilities Planning and evaluation values will be calculated using the same methodology while allowing for utility specific inputs Evaluation findings (e. g. , billing analysis, metering, survey data) inform TRM updates allowing utilities to pool evaluation resources TRM Presentation - Schiller
TRM and Deemed Savings Cautions Can they be dangerous? Yes! Only as good as the data, analysis, and QC that goes into them (garbage in…. . ) Requires experienced oversight to ensure proper use Accurate on average (should be - can be even better than case by case M&V) Accurate for each project and customer (probably not…. . ) Use care not to put the cart before the horse Need good baseline data (baseline data, performance data, saturations, load shapes) Need to build off evaluation and other field/lab results (empirical vs. theoretical) Carefully select data from other jurisdiction’s TRMs (see next slide) Watch out for: Applying values where they are applicable! Systematic biases Interactive and stacking effects (multiple measures in same facility) Need transparency and detailed documentation with a detailed guide on how to use the data and algorithms TRM Presentation - Schiller
TRM Comparison Cadmus conducted a scoping study for regional TRMs for U. S. DOE and LBNL; the study included an assessment of savings values for 20 measures covering different fuels, sectors, end-uses in multiple TRMs See this website for the report and other resources: http: //www 1. eere. energy. gov/seeaction/evaluation. html Findings: Savings estimates vary by order of magnitude across sources Main drivers of variances are: Differing baseline assumptions (e. g. , hours of use, weather, prevailing codes) Source of savings calculations (building simulation versus engineering algorithm) Parameters included in algorithm (e. g. , use of HVAC interaction factor for lighting) TRM Presentation - Schiller
Bottom Line TRMs Create greater savings certainty and consistency for savings values, and perhaps more accuracy Are widely assumed to reduce a state’s EM&V costs Focus EM&V resources Statewide or regional TRMs are becoming essentially a standard practice But As with any tool need to be used for the right use and with caution Require (a) agreement among stakeholders, (b) some startup research and costs, and (c) time to get going TRM Presentation - Schiller
TRM Examples TRM Presentation - Schiller
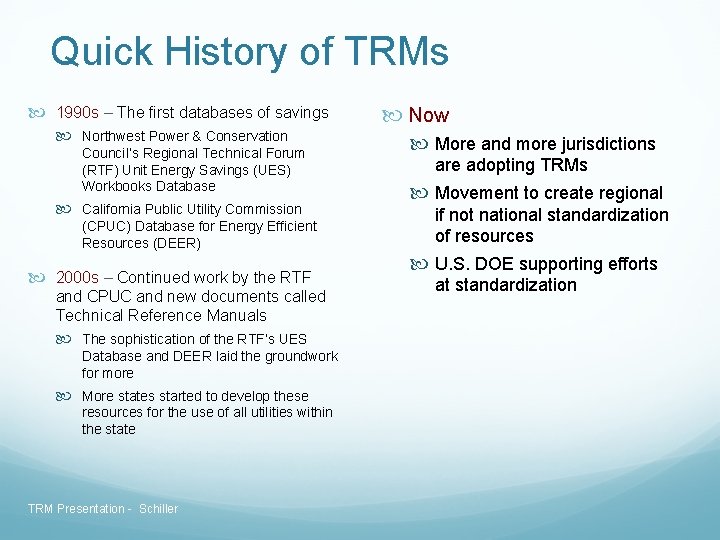
Quick History of TRMs 1990 s – The first databases of savings Northwest Power & Conservation Council’s Regional Technical Forum (RTF) Unit Energy Savings (UES) Workbooks Database California Public Utility Commission (CPUC) Database for Energy Efficient Resources (DEER) 2000 s – Continued work by the RTF and CPUC and new documents called Technical Reference Manuals The sophistication of the RTF’s UES Database and DEER laid the groundwork for more More states started to develop these resources for the use of all utilities within the state TRM Presentation - Schiller Now More and more jurisdictions are adopting TRMs Movement to create regional if not national standardization of resources U. S. DOE supporting efforts at standardization
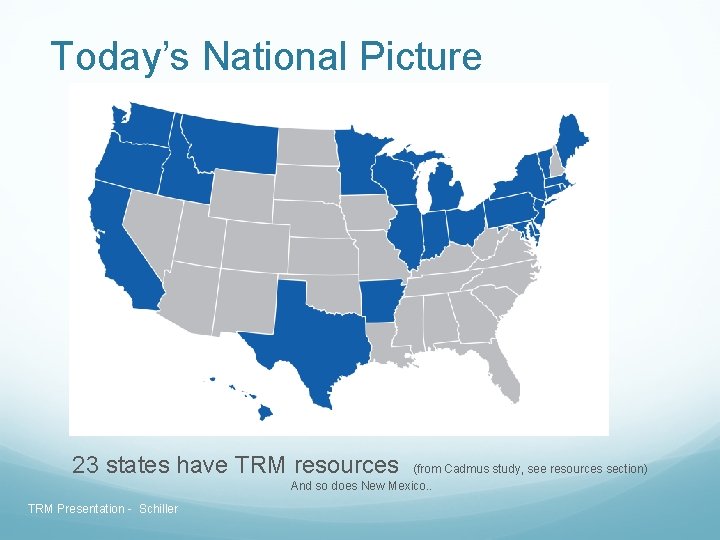
Today’s National Picture 23 states have TRM resources (from Cadmus study, see resources section) And so does New Mexico. . TRM Presentation - Schiller
Introduction to Two Regional TRMs Mid-Atlantic TRM – slides from Elizabeth Titus of NEEP Northwest Regional Technical Forum – slides from Tom Eckman of the RTF TRM Presentation - Schiller
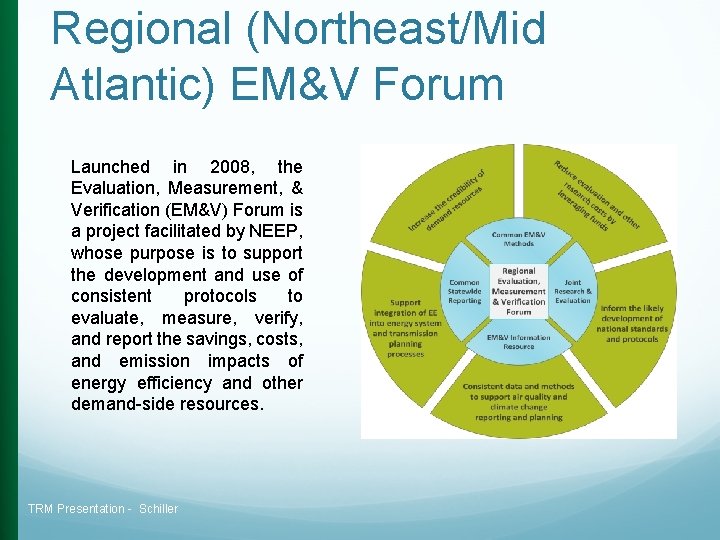
Regional (Northeast/Mid Atlantic) EM&V Forum Launched in 2008, the Evaluation, Measurement, & Verification (EM&V) Forum is a project facilitated by NEEP, whose purpose is to support the development and use of consistent protocols to evaluate, measure, verify, and report the savings, costs, and emission impacts of energy efficiency and other demand-side resources. TRM Presentation - Schiller
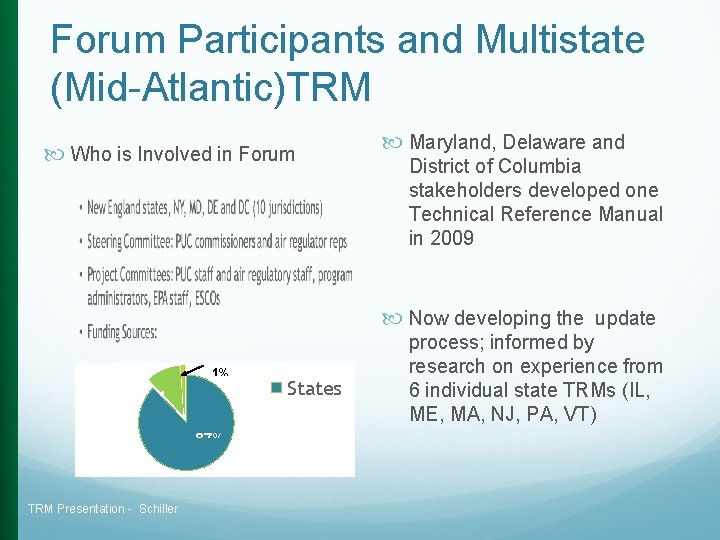
Forum Participants and Multistate (Mid-Atlantic)TRM Who is Involved in Forum Maryland, Delaware and District of Columbia stakeholders developed one Technical Reference Manual in 2009 Now developing the update 1% 1 87% TRM Presentation - Schiller States process; informed by research on experience from 6 individual state TRMs (IL, ME, MA, NJ, PA, VT)
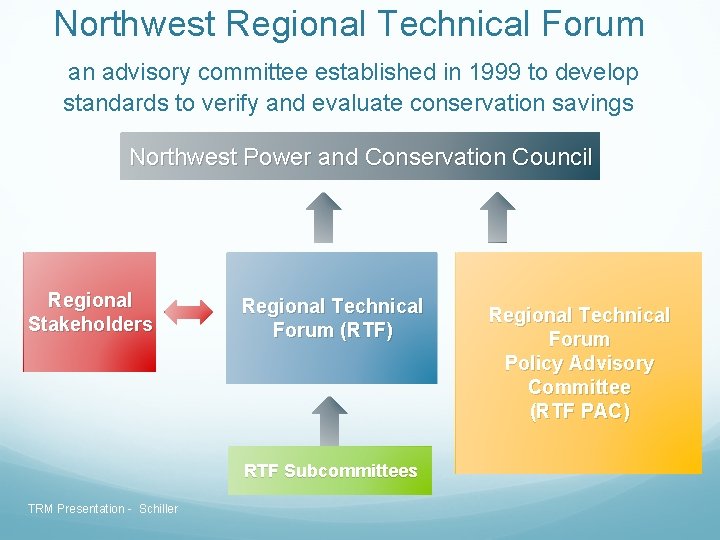
Northwest Regional Technical Forum an advisory committee established in 1999 to develop standards to verify and evaluate conservation savings Northwest Power and Conservation Council Regional Stakeholders Regional Technical Forum (RTF) RTF Subcommittees TRM Presentation - Schiller Regional Technical Forum Policy Advisory Committee (RTF PAC)
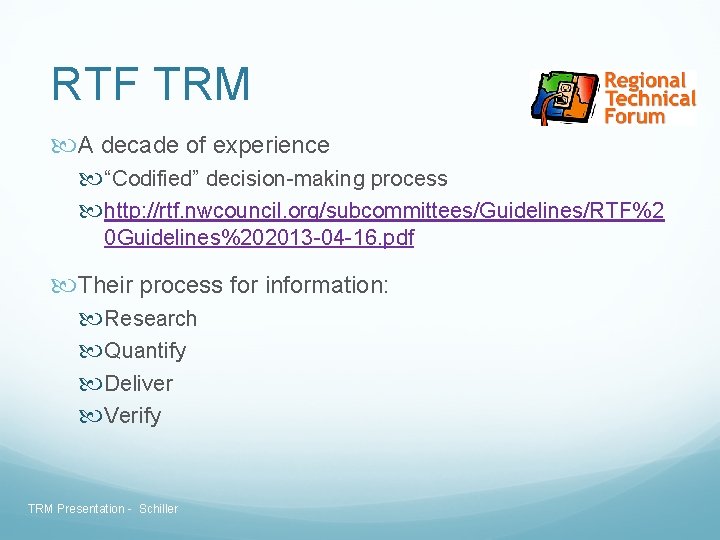
RTF TRM A decade of experience “Codified” decision-making process http: //rtf. nwcouncil. org/subcommittees/Guidelines/RTF%2 0 Guidelines%202013 -04 -16. pdf Their process for information: Research Quantify Deliver Verify TRM Presentation - Schiller
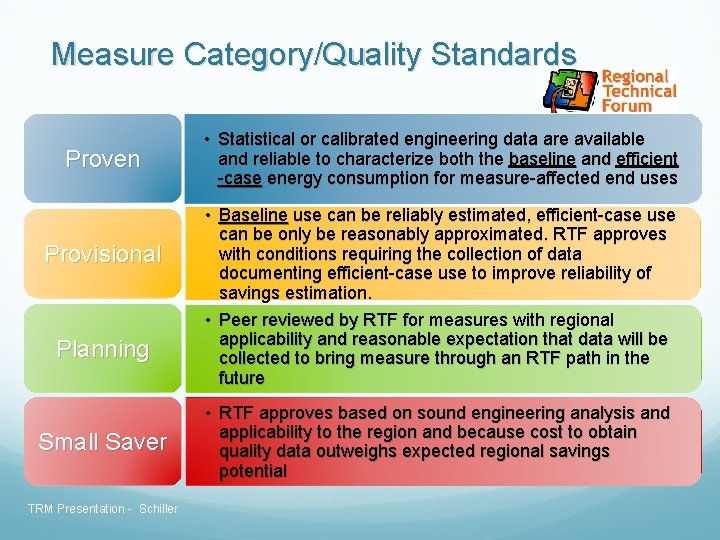
Measure Category/Quality Standards Proven Provisional Planning Small Saver TRM Presentation - Schiller • Statistical or calibrated engineering data are available and reliable to characterize both the baseline and efficient -case energy consumption for measure-affected end uses • Baseline use can be reliably estimated, efficient-case use can be only be reasonably approximated. RTF approves with conditions requiring the collection of data documenting efficient-case use to improve reliability of savings estimation. • Peer reviewed by RTF for measures with regional applicability and reasonable expectation that data will be collected to bring measure through an RTF path in the future • RTF approves based on sound engineering analysis and applicability to the region and because cost to obtain quality data outweighs expected regional savings potential
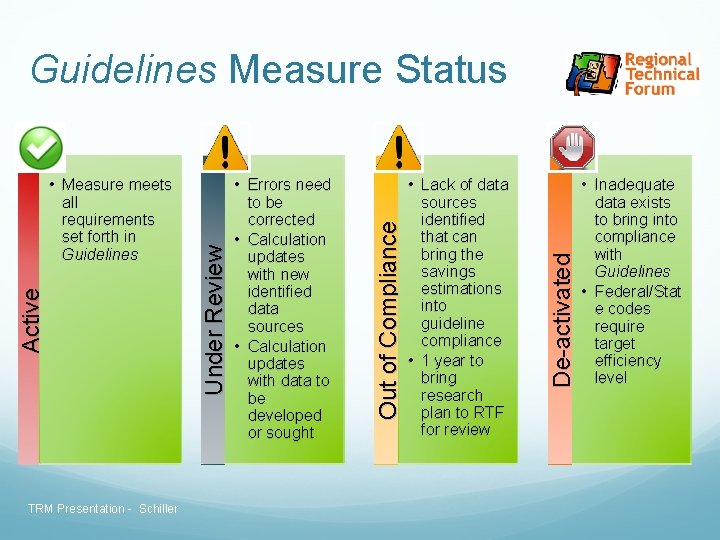
TRM Presentation - Schiller • Lack of data sources identified that can bring the savings estimations into guideline compliance • 1 year to bring research plan to RTF for review De-activated • Errors need to be corrected • Calculation updates with new identified data sources • Calculation updates with data to be developed or sought Out of Compliance Active • Measure meets all requirements set forth in Guidelines Under Review Guidelines Measure Status • Inadequate data exists to bring into compliance with Guidelines • Federal/Stat e codes require target efficiency level
RTF - Getting to Unitized Savings (UES) Statistical or meta-statistical data Quality judged by relative error of mean savings estimate Avoid when savings significantly interact with other measures due to large sample needs Calibrated engineering models Adjusted to individual cases or to the average characteristics and consumption of groups Ex. SEEM heating loads calibrated to billing data from representative sample of SF homes Savings expected to be regionally applicable Significant interactions need to be dealt with TRM Presentation - Schiller
They Have No Secrets! RTF decisions, work papers and supporting data are all accessible via the web: http: //rtf. nwcouncil. org/ TRM Presentation - Schiller Work
A Few State Examples Energy Trust of Oregon Primarily fully deemed values in the database developed in conjunction with analysis completed by Regional Technical Forum; some calculators Used for programs, and made specific to Oregon IOU territory Updated as needed with EM&V results Michigan Energy Measures Database Used by program planners and claimed savings Fully deemed values for most measures Allows for consistency of assumptions across state Updated annually Pennsylvania TRM Primarily partially deemed algorithms with inputs based on look-up tables or customer-specific application data Used for program planners and claimed savings Updated annually TRM Presentation - Schiller
Lets run through some examples…. . TRM Presentation - Schiller
How To Set Up and Use TRMs and Lessons Learned TRM Presentation - Schiller
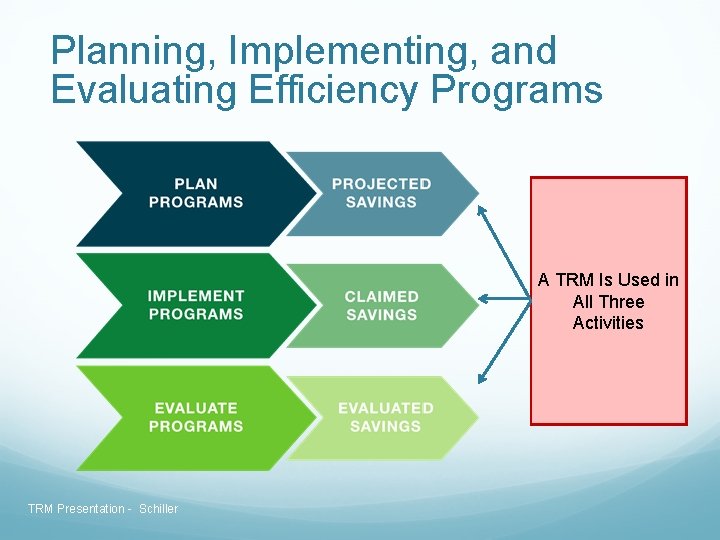
Planning, Implementing, and Evaluating Efficiency Programs A TRM Is Used in All Three Activities TRM Presentation - Schiller
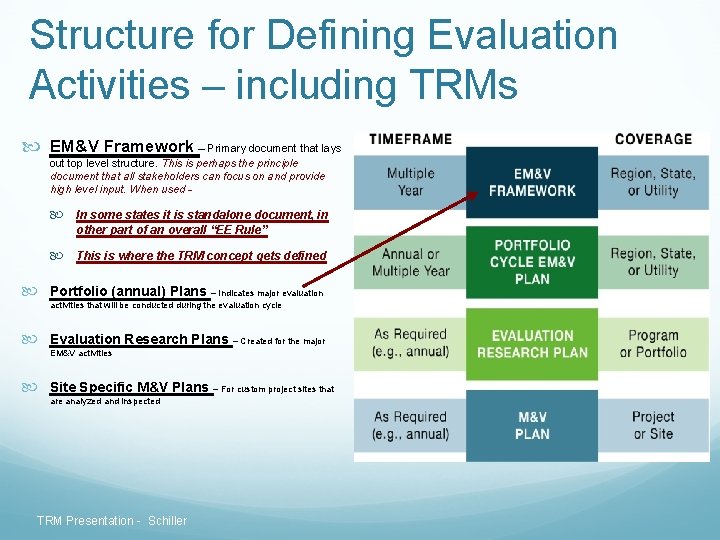
Structure for Defining Evaluation Activities – including TRMs EM&V Framework – Primary document that lays out top level structure. This is perhaps the principle document that all stakeholders can focus on and provide high level input. When used - In some states it is standalone document, in other part of an overall “EE Rule” This is where the TRM concept gets defined Portfolio (annual) Plans – Indicates major evaluation activities that will be conducted during the evaluation cycle Evaluation Research Plans – Created for the major EM&V activities Site Specific M&V Plans – For custom project sites that are analyzed and inspected TRM Presentation - Schiller
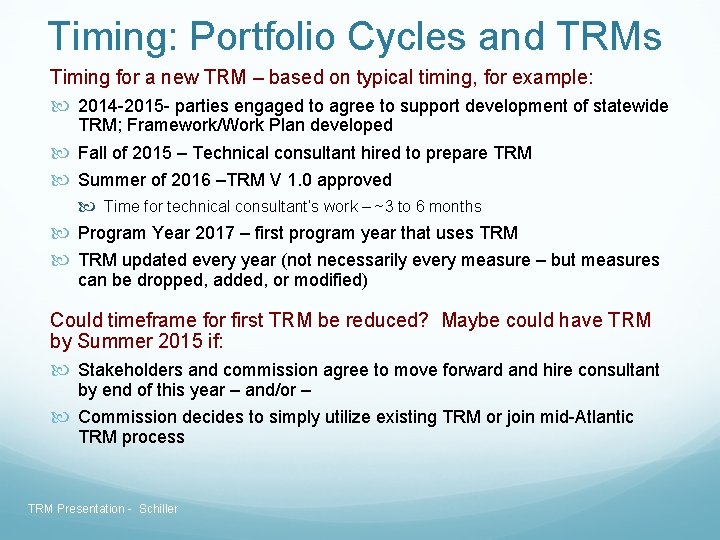
Timing: Portfolio Cycles and TRMs Timing for a new TRM – based on typical timing, for example: 2014 -2015 - parties engaged to agree to support development of statewide TRM; Framework/Work Plan developed Fall of 2015 – Technical consultant hired to prepare TRM Summer of 2016 –TRM V 1. 0 approved Time for technical consultant’s work – ~3 to 6 months Program Year 2017 – first program year that uses TRM updated every year (not necessarily every measure – but measures can be dropped, added, or modified) Could timeframe for first TRM be reduced? Maybe could have TRM by Summer 2015 if: Stakeholders and commission agree to move forward and hire consultant by end of this year – and/or – Commission decides to simply utilize existing TRM or join mid-Atlantic TRM process TRM Presentation - Schiller
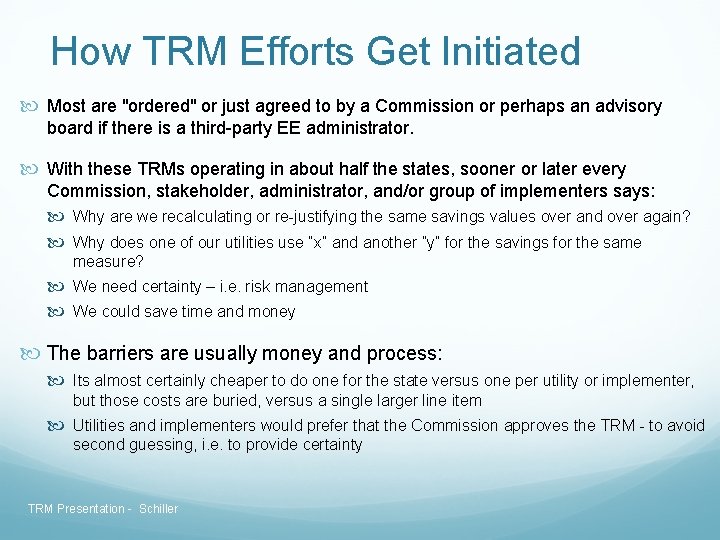
How TRM Efforts Get Initiated Most are "ordered" or just agreed to by a Commission or perhaps an advisory board if there is a third-party EE administrator. With these TRMs operating in about half the states, sooner or later every Commission, stakeholder, administrator, and/or group of implementers says: Why are we recalculating or re-justifying the same savings values over and over again? Why does one of our utilities use “x” and another ”y” for the savings for the same measure? We need certainty – i. e. risk management We could save time and money The barriers are usually money and process: Its almost certainly cheaper to do one for the state versus one per utility or implementer, but those costs are buried, versus a single larger line item Utilities and implementers would prefer that the Commission approves the TRM - to avoid second guessing, i. e. to provide certainty TRM Presentation - Schiller
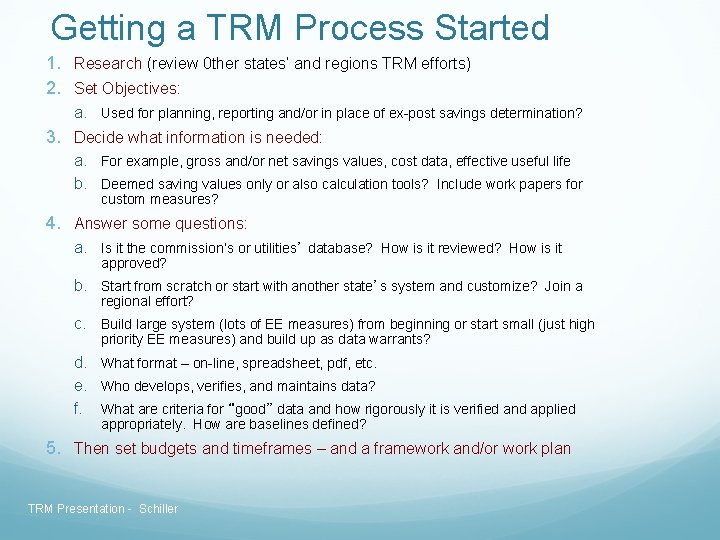
Getting a TRM Process Started 1. Research (review 0 ther states’ and regions TRM efforts) 2. Set Objectives: a. Used for planning, reporting and/or in place of ex-post savings determination? 3. Decide what information is needed: a. For example, gross and/or net savings values, cost data, effective useful life b. Deemed saving values only or also calculation tools? Include work papers for custom measures? 4. Answer some questions: a. Is it the commission’s or utilities’ database? How is it reviewed? How is it approved? b. Start from scratch or start with another state’s system and customize? Join a regional effort? c. Build large system (lots of EE measures) from beginning or start small (just high priority EE measures) and build up as data warrants? d. What format – on-line, spreadsheet, pdf, etc. e. Who develops, verifies, and maintains data? f. What are criteria for “good” data and how rigorously it is verified and applied appropriately. How are baselines defined? 5. Then set budgets and timeframes – and a framework and/or work plan TRM Presentation - Schiller
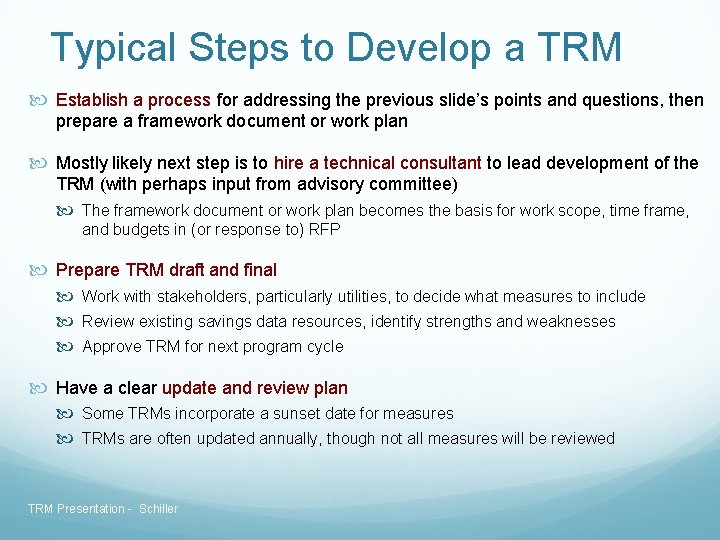
Typical Steps to Develop a TRM Establish a process for addressing the previous slide’s points and questions, then prepare a framework document or work plan Mostly likely next step is to hire a technical consultant to lead development of the TRM (with perhaps input from advisory committee) The framework document or work plan becomes the basis for work scope, time frame, and budgets in (or response to) RFP Prepare TRM draft and final Work with stakeholders, particularly utilities, to decide what measures to include Review existing savings data resources, identify strengths and weaknesses Approve TRM for next program cycle Have a clear update and review plan Some TRMs incorporate a sunset date for measures TRMs are often updated annually, though not all measures will be reviewed TRM Presentation - Schiller
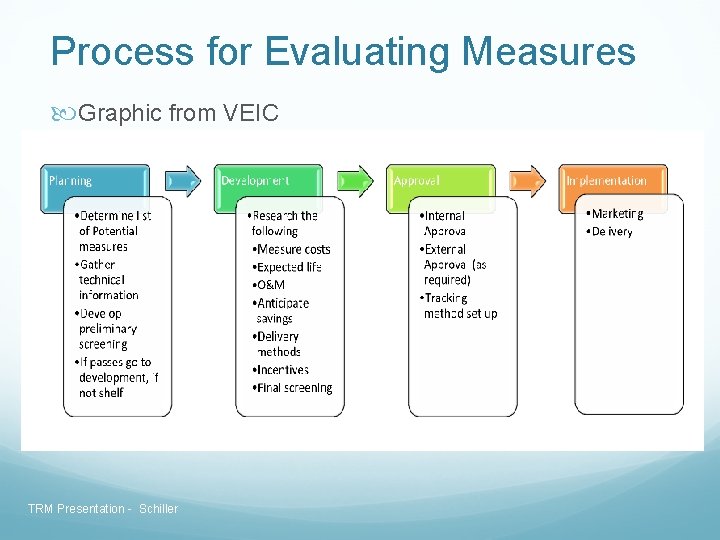
Process for Evaluating Measures Graphic from VEIC TRM Presentation - Schiller
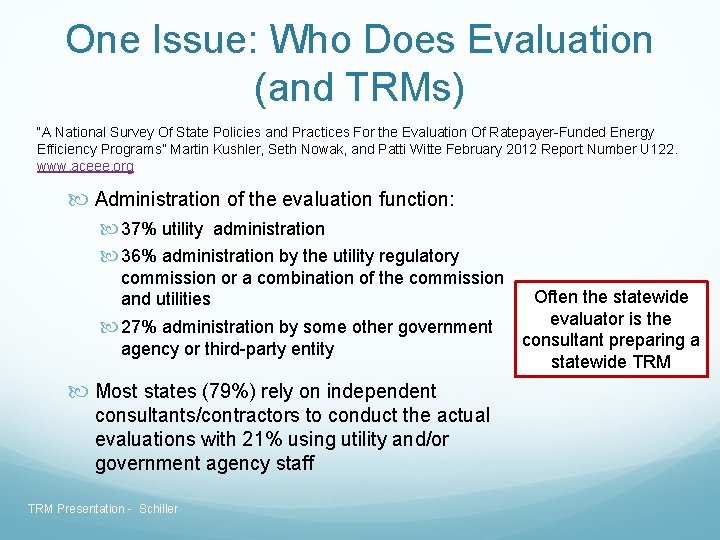
One Issue: Who Does Evaluation (and TRMs) “A National Survey Of State Policies and Practices For the Evaluation Of Ratepayer-Funded Energy Efficiency Programs” Martin Kushler, Seth Nowak, and Patti Witte February 2012 Report Number U 122. www. aceee. org Administration of the evaluation function: 37% utility administration 36% administration by the utility regulatory commission or a combination of the commission and utilities 27% administration by some other government agency or third-party entity Most states (79%) rely on independent consultants/contractors to conduct the actual evaluations with 21% using utility and/or government agency staff TRM Presentation - Schiller Often the statewide evaluator is the consultant preparing a statewide TRM
Updating Process Review and summarize other jurisdiction’s TRM update processes for comparison and guidance Recommend an overarching strategy to update the TRM in a timely and appropriate manner, to best meet the needs of the organizations using it Interview stakeholders to identify needs and schedules relevant to the update process, commonalities that are mutually supportive of a single process and schedule, as well as any unique needs or situations that necessitate extra attention. Identify measures to be added or updated in the next round of TRM measure development TRM Presentation - Schiller
Lessons Learned - Process Establish definitions for metrics (gross, net, incremental savings, lifetime, etc. ) and measures Clearly define roles and responsibilities of different participants Define process for input and approval of TRM and updates Strive for transparency, wide input and limited legal/regulatory hoops required to make changes Decide whether values are to be “expected values” or “conservative values” (remember EE savings are estimates) Provide some guidance on selection criteria for what measures go in the TRM Process guidance should make it clear what assumptions are used and for which purposes – baselines! Decide how values are used – “looking back” or “going forward” TRM Presentation - Schiller
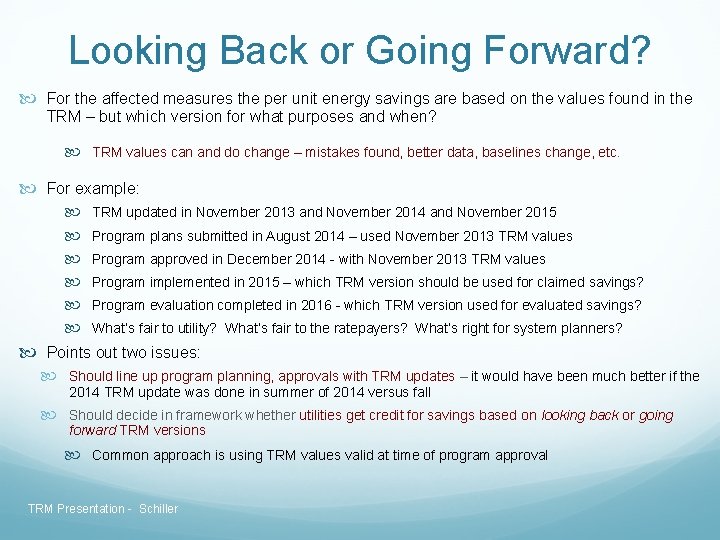
Looking Back or Going Forward? For the affected measures the per unit energy savings are based on the values found in the TRM – but which version for what purposes and when? TRM values can and do change – mistakes found, better data, baselines change, etc. For example: TRM updated in November 2013 and November 2014 and November 2015 Program plans submitted in August 2014 – used November 2013 TRM values Program approved in December 2014 - with November 2013 TRM values Program implemented in 2015 – which TRM version should be used for claimed savings? Program evaluation completed in 2016 - which TRM version used for evaluated savings? What’s fair to utility? What’s fair to the ratepayers? What’s right for system planners? Points out two issues: Should line up program planning, approvals with TRM updates – it would have been much better if the 2014 TRM update was done in summer of 2014 versus fall Should decide in framework whether utilities get credit for savings based on looking back or going forward TRM versions Common approach is using TRM values valid at time of program approval TRM Presentation - Schiller
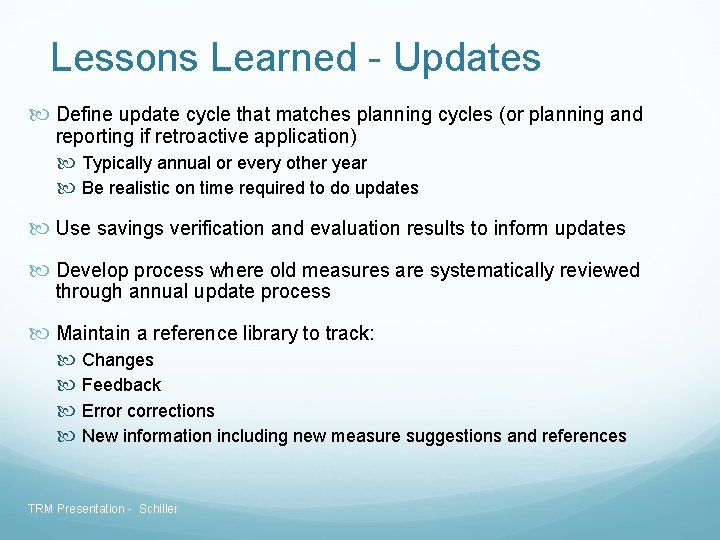
Lessons Learned - Updates Define update cycle that matches planning cycles (or planning and reporting if retroactive application) Typically annual or every other year Be realistic on time required to do updates Use savings verification and evaluation results to inform updates Develop process where old measures are systematically reviewed through annual update process Maintain a reference library to track: Changes Feedback Error corrections New information including new measure suggestions and references TRM Presentation - Schiller
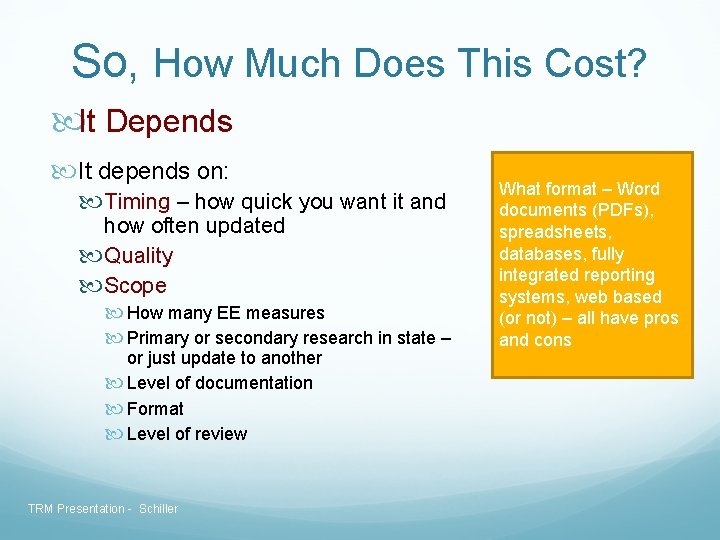
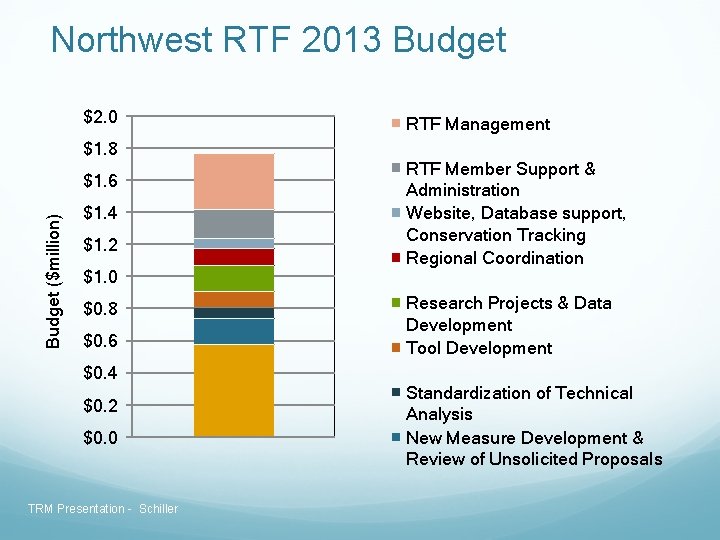
So, How Much Does This Cost? It Depends It depends on: Timing – how quick you want it and how often updated Quality Scope How many EE measures Primary or secondary research in state – or just update to another Level of documentation Format Level of review TRM Presentation - Schiller What format – Word documents (PDFs), spreadsheets, databases, fully integrated reporting systems, web based (or not) – all have pros and cons
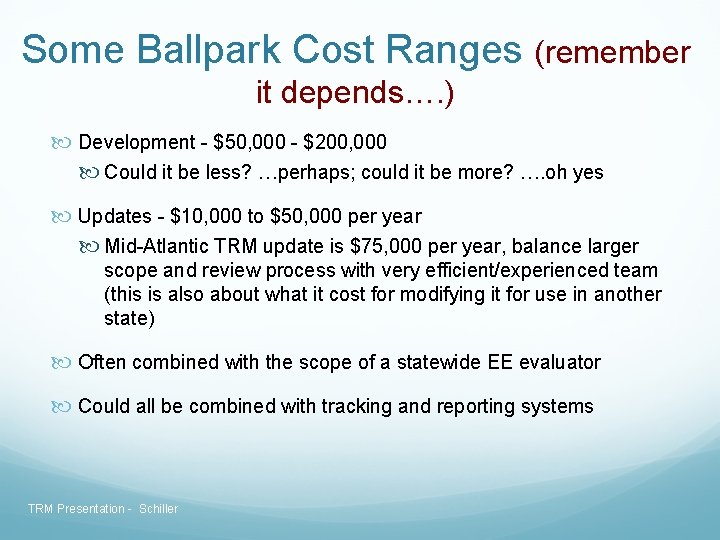
Some Ballpark Cost Ranges (remember it depends…. ) Development - $50, 000 - $200, 000 Could it be less? …perhaps; could it be more? …. oh yes Updates - $10, 000 to $50, 000 per year Mid-Atlantic TRM update is $75, 000 per year, balance larger scope and review process with very efficient/experienced team (this is also about what it cost for modifying it for use in another state) Often combined with the scope of a statewide EE evaluator Could all be combined with tracking and reporting systems TRM Presentation - Schiller
Northwest RTF 2013 Budget $2. 0 $1. 8 Budget ($million) $1. 6 $1. 4 $1. 2 $1. 0 $0. 8 $0. 6 $0. 4 $0. 2 $0. 0 TRM Presentation - Schiller RTF Management RTF Member Support & Administration Website, Database support, Conservation Tracking Regional Coordination Research Projects & Data Development Tool Development Standardization of Technical Analysis New Measure Development & Review of Unsolicited Proposals
Suggestions for working group/advisory structures Whatever the format of working group or advisors, the needs are: Consultants with technical expertise and independence Transparency through public, peer review Cooperative if not consensus approach to input Somebody in charge – provide input to an entity that makes final decision (usually the Commission) Typically an entity (utility, non-profit, Commission) has a contract with consultants that prepare TRM and related documents Advisory Committee provides feedback to that entity and consultants Members either appointed for technical expertise or constituency representation, or combination Members, with occasional exceptions, serve pro bono Working meetings and pre- and post-meeting review – active engagement required Preferably input is solely technical (sorry, no lawyers) May also provide input on selection process and selection of technical consultants TRM Presentation - Schiller
TRM s EM&V and TRM Resources TRM Presentation - Schiller
EM&V Resources DOE/EPA SEE Action EM&V Resources website: http: //www 1. eere. energy. gov/seeaction/emv_resource_ portal. html U. S. DOE Uniform Methods Project website: http: //www 1. eere. energy. gov/office_eere/de_ump. html TRM Presentation - Schiller
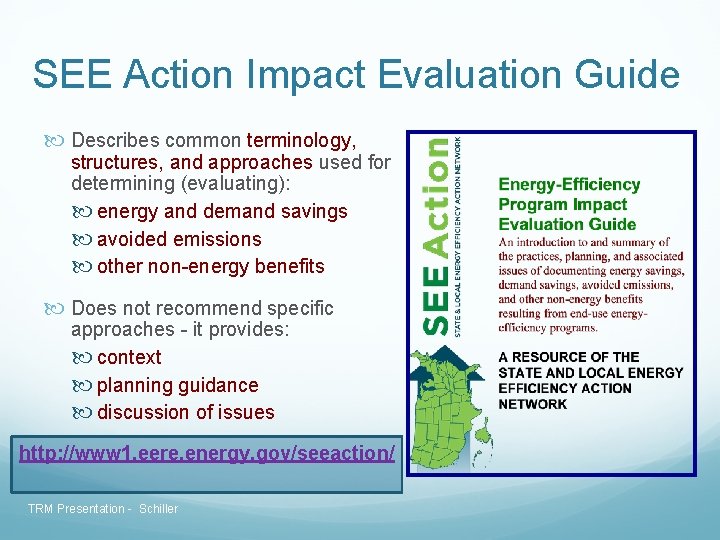
SEE Action Impact Evaluation Guide Describes common terminology, structures, and approaches used for determining (evaluating): energy and demand savings avoided emissions other non-energy benefits Does not recommend specific approaches - it provides: context planning guidance discussion of issues http: //www 1. eere. energy. gov/seeaction/ TRM Presentation - Schiller
M&V: IPMVP Options A-D The Retrofit Isolation Options: Options A or B Addresses only the retrofitted system - Ignores interactive effects beyond the boundary (although these may be independently addressed) Usually needs a new meter The Whole Facility Options: Options C or D Addresses all effects in the facility Retrofits AND other changes (intended and unintended) Often uses the utility meter www. evo-world. org TRM Presentation - Schiller
TRM Resources List of TRMs and their websites (as of January 2013, see pages 4 -6) - http: //www. emvwebinar. org/Meeting%20 Materials/2013/Energy%20 Efficiency%20 EMV%20 Doc uments%20 Resources%20 January%202013. pdf Two Regional TRMs: Mid-Atlantic TRM – http: //www. neep. org/Assets/uploads/files/emvproducts/A 5_Mid_Atlantic_TRM_V 2_FINAL. pdf Northwest RTF - http: //rtf. nwcouncil. org/measures/Default. asp SEE Action – National TRM Scoping Study - http: //www 1. eere. energy. gov/seeaction/pdfs/emvscoping__databasefeasibility. pdf Mid-Atlantic Technical Reference Manual (TRM)Updating Process Guidelines - https: //neep. org/Assets/uploads/files/emv-rfp/emvproducts/Recommendations%20 and%20 draft%20 update%20 process%20 for%20 the%20 Mid% 20 Atlantic%20 TRM-FINAL. pdf September 2012 webinar on TRM – www. emvwebinar. org - also AESP had webinar on TRMs as well (but fee based) And… there about 6 -12 national engineering/EM&V consulting firms that would be happy to talk with you about their experience doing just this kind of work TRM Presentation - Schiller
Thank You From Albert Einstein: “Everything should be as simple as it is, but not simpler” “Everything that can be counted does not necessarily count; everything that counts cannot necessarily be counted” Steve Schiller steve@schiller. com TRM Presentation - Schiller