Dynamic Causal Modelling For CrossSpectral Densities Rosalyn Moran

- Slides: 59
Dynamic Causal Modelling For Cross-Spectral Densities Rosalyn Moran Virginia Tech Carilion Research Institute Bradley Department of Electrical & Computer Engineering Department of Psychiatry and Behavioral Medicine, VTC School of Medicine
Outline Data Features in DCM for CSD Generative Models in the time domain Generative Models in the frequency domain DCM Inversion procedure Example 1: L-Dopa Modulations of theta spectra using DCM for CSD Example 2: Propofol Modulations of Delta and Gamma spectra using DCM for CSD
Outline Data Features in DCM for CSD Generative Models in the time domain Generative Models in the frequency domain DCM Inversion procedure Example 1: L-Dopa Modulations of theta spectra using DCM for CSD Example 2: Propofol Modulations of Delta and Gamma spectra using DCM for CSD
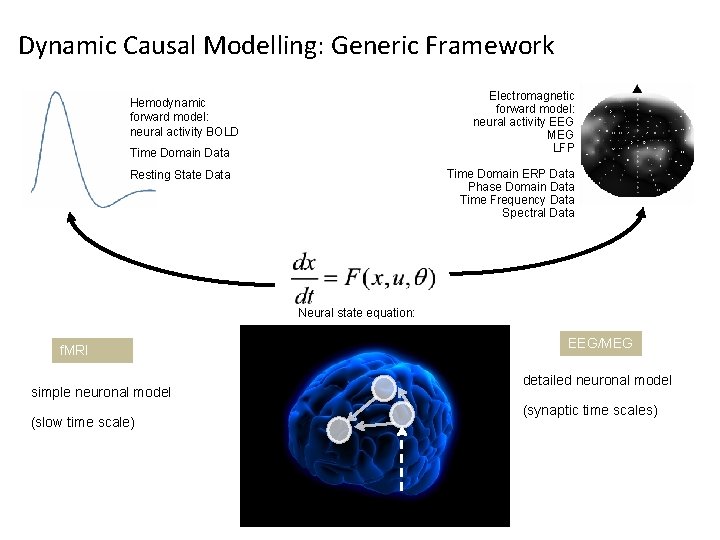
Dynamic Causal Modelling: Generic Framework Electromagnetic forward model: neural activity EEG MEG LFP Hemodynamic forward model: neural activity BOLD Time Domain Data Time Domain ERP Data Phase Domain Data Time Frequency Data Spectral Data Resting State Data Neural state equation: f. MRI simple neuronal model (slow time scale) EEG/MEG detailed neuronal model (synaptic time scales)
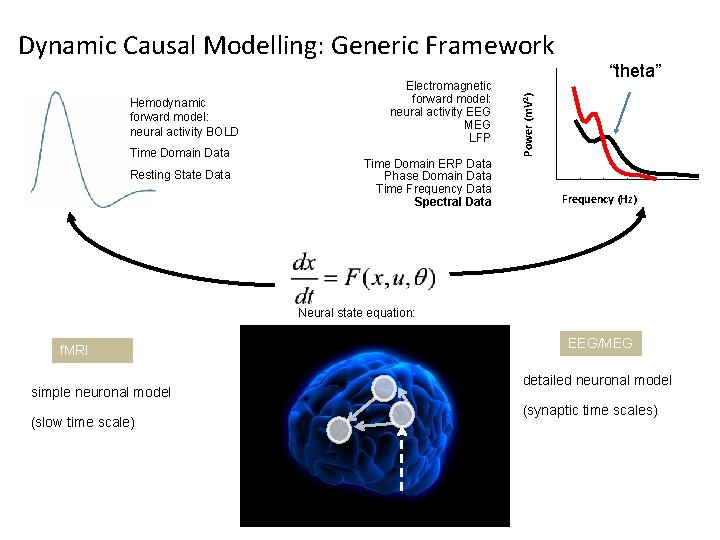
Hemodynamic forward model: neural activity BOLD Time Domain Data Resting State Data Electromagnetic forward model: neural activity EEG MEG LFP Time Domain ERP Data Phase Domain Data Time Frequency Data Spectral Data “theta” Power (m. V 2) Dynamic Causal Modelling: Generic Framework Frequency (Hz) Neural state equation: f. MRI simple neuronal model (slow time scale) EEG/MEG detailed neuronal model (synaptic time scales)
DCM for Steady State Responses Under linearity and stationarity assumptions, the model’s biophysical parameters (e. g. post-synaptic receptor density and time constants) prescribe the cross-spectral density of responses measured directly (e. g. local field potentials) or indirectly through some lead-field (e. g. electroencephalographic and magnetoencephalographic data).
Steady State Statistically: A “Wide Sense Stationary” signal has 1 st and 2 nd moments that do not vary with respect to time Dynamically: A system in steady state has settled to some equilibrium after a transient Data Feature: Quasi-stationary signals that underlie Spectral Densities in the Frequency Domain
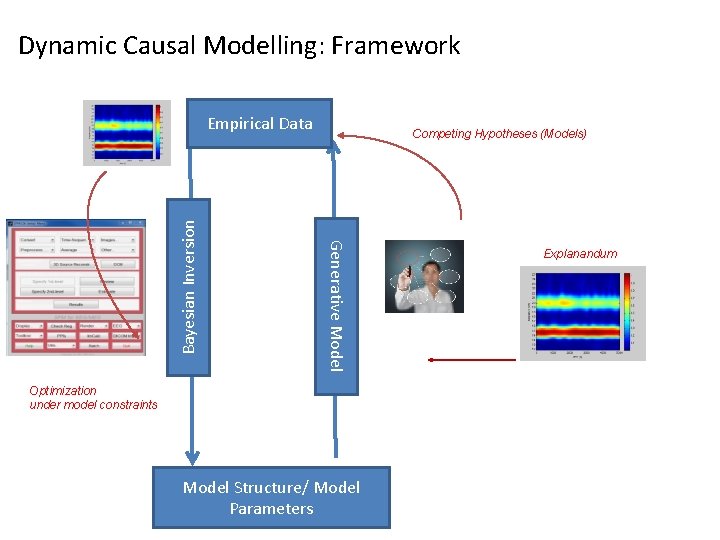
Dynamic Causal Modelling: Framework Competing Hypotheses (Models) Generative Model Bayesian Inversion Empirical Data Optimization under model constraints Model Structure/ Model Parameters Explanandum
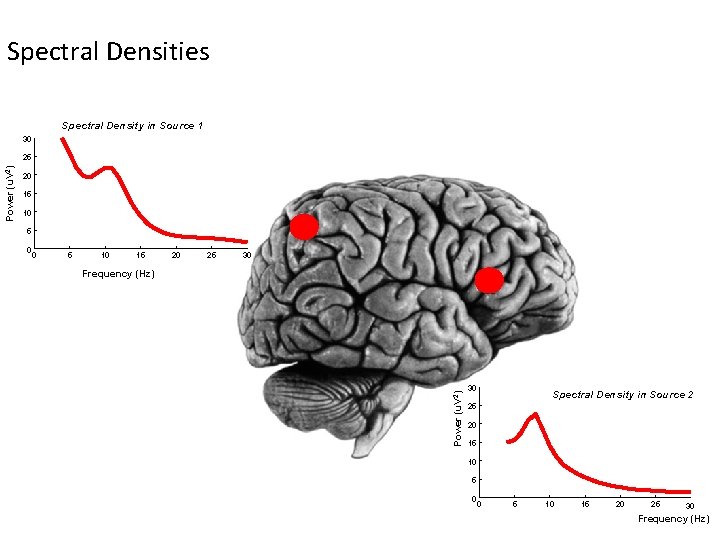
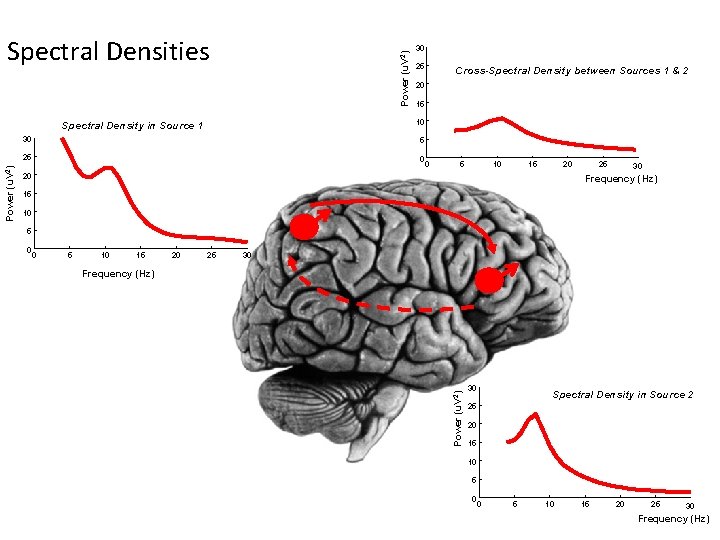
Spectral Densities Spectral Density in Source 1 30 20 15 10 5 0 0 5 10 15 20 25 30 Frequency (Hz) Power (u. V 2) 25 30 Spectral Density in Source 2 25 20 15 10 5 0 0 5 10 15 20 25 30 Frequency (Hz)
Power (u. V 2) Spectral Densities 25 Cross-Spectral Density between Sources 1 & 2 20 15 10 Spectral Density in Source 1 30 5 25 0 0 5 10 15 20 20 25 30 Frequency (Hz) 15 10 5 0 0 5 10 15 20 25 30 Frequency (Hz) Power (u. V 2) 30 30 Spectral Density in Source 2 25 20 15 10 5 0 0 5 10 15 20 25 30 Frequency (Hz)
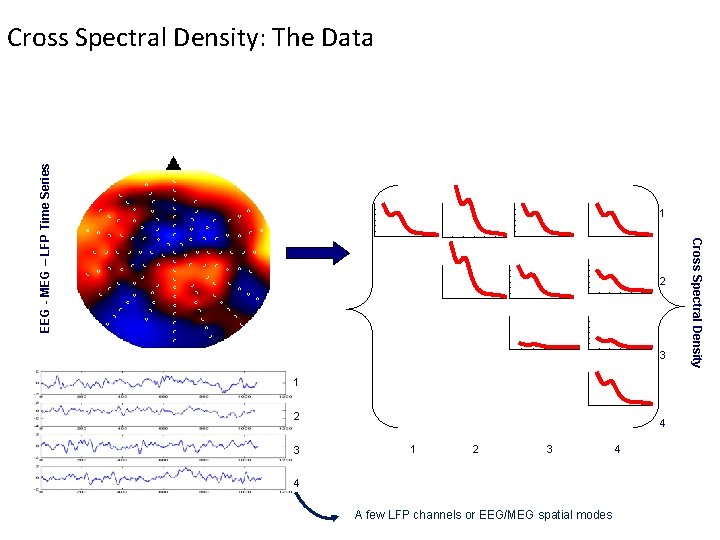
EEG - MEG – LFP Time Series Cross Spectral Density: The Data 1 3 1 2 3 4 A few LFP channels or EEG/MEG spatial modes 4 Cross Spectral Density 2
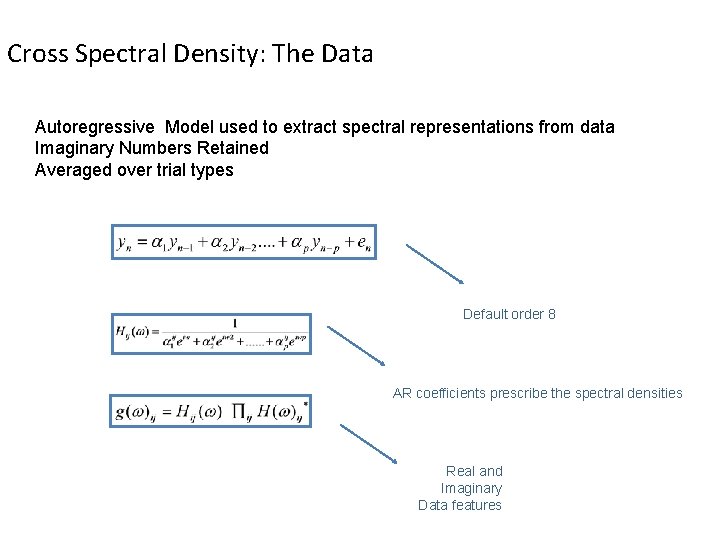
Cross Spectral Density: The Data Autoregressive Model used to extract spectral representations from data Imaginary Numbers Retained Averaged over trial types Default order 8 AR coefficients prescribe the spectral densities Real and Imaginary Data features
Outline Data Features in DCM for CSD Generative Models in the time domain Generative Models in the frequency domain DCM Inversion procedure Example 1: L-Dopa Modulations of theta spectra using DCM for CSD Example 2: Propofol Modulations of Delta and Gamma spectra using DCM for CSD
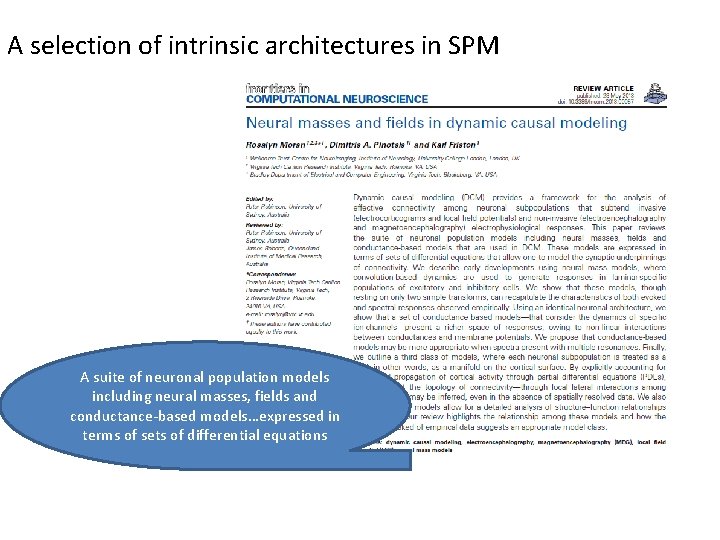
A selection of intrinsic architectures in SPM A suite of neuronal population models including neural masses, fields and conductance-based models…expressed in terms of sets of differential equations
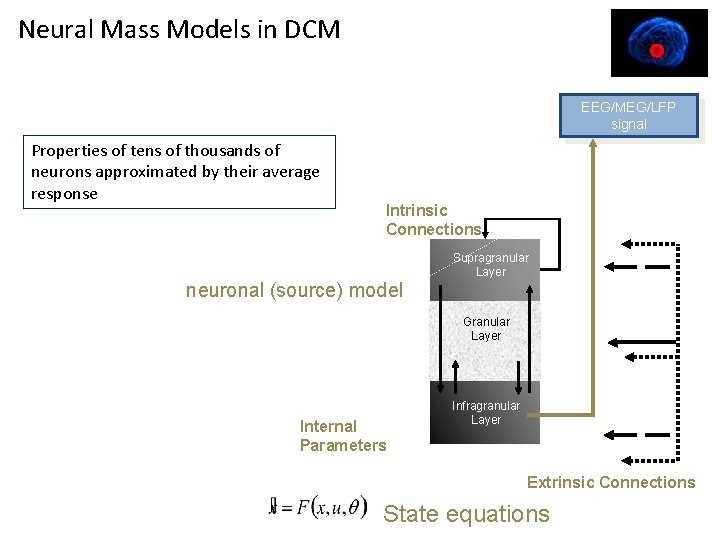
Neural Mass Models in DCM EEG/MEG/LFP signal Properties of tens of thousands of neurons approximated by their average response Intrinsic Connections Supragranular Layer neuronal (source) model Granular Layer Internal Parameters Infragranular Layer Extrinsic Connections State equations
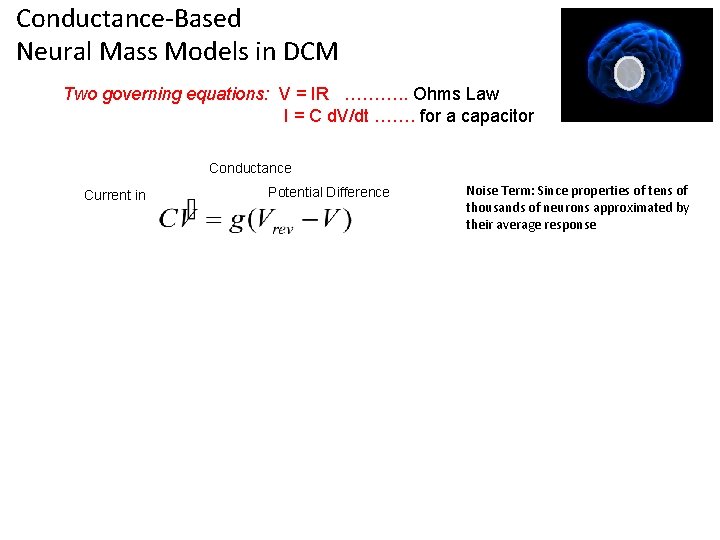
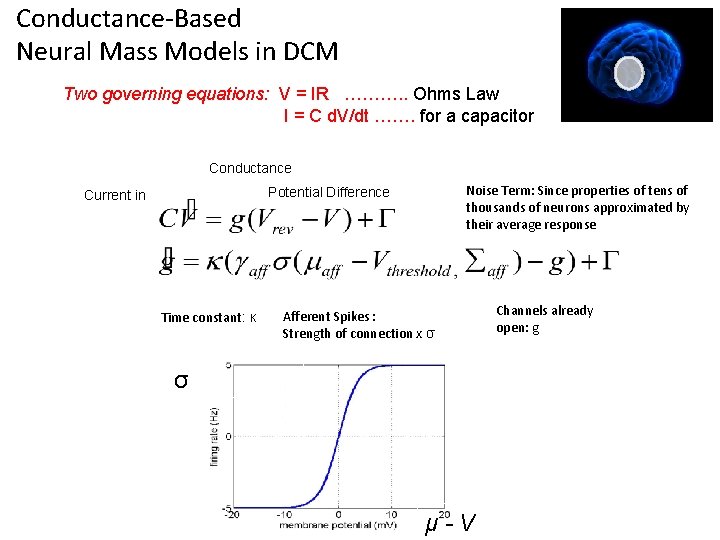
Conductance-Based Neural Mass Models in DCM Two governing equations: V = IR ………. . Ohms Law I = C d. V/dt ……. for a capacitor Conductance Current in Potential Difference Noise Term: Since properties of tens of thousands of neurons approximated by their average response
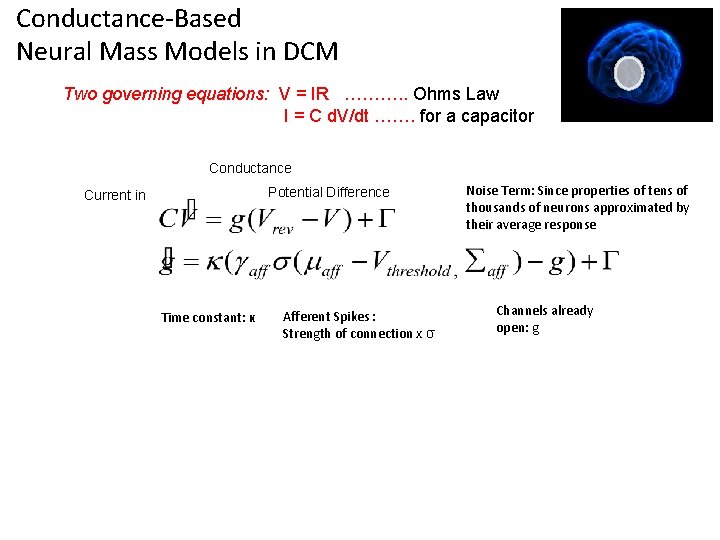
Conductance-Based Neural Mass Models in DCM Two governing equations: V = IR ………. . Ohms Law I = C d. V/dt ……. for a capacitor Conductance Potential Difference Current in Time constant: κ Afferent Spikes : Strength of connection x σ Noise Term: Since properties of tens of thousands of neurons approximated by their average response Channels already open: g
Conductance-Based Neural Mass Models in DCM Two governing equations: V = IR ………. . Ohms Law I = C d. V/dt ……. for a capacitor Conductance Noise Term: Since properties of tens of thousands of neurons approximated by their average response Potential Difference Current in Time constant: κ Afferent Spikes : Strength of connection x σ σ μ-V Channels already open: g
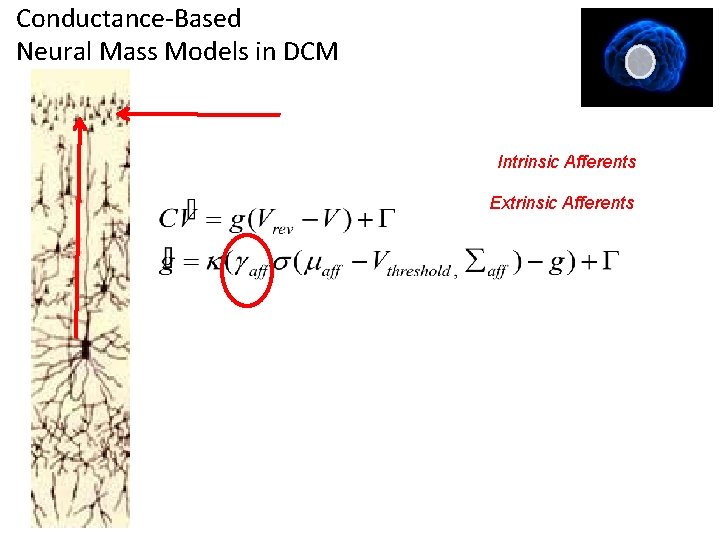
Conductance-Based Neural Mass Models in DCM Intrinsic Afferents Extrinsic Afferents
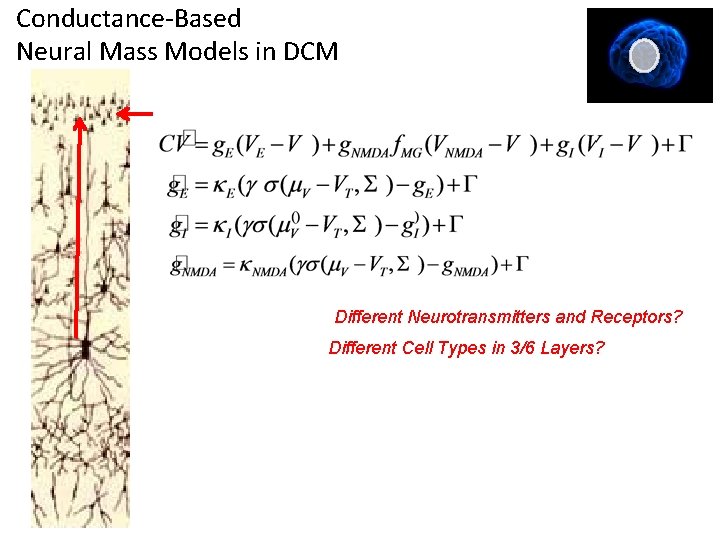
Conductance-Based Neural Mass Models in DCM Different Neurotransmitters and Receptors? Different Cell Types in 3/6 Layers?
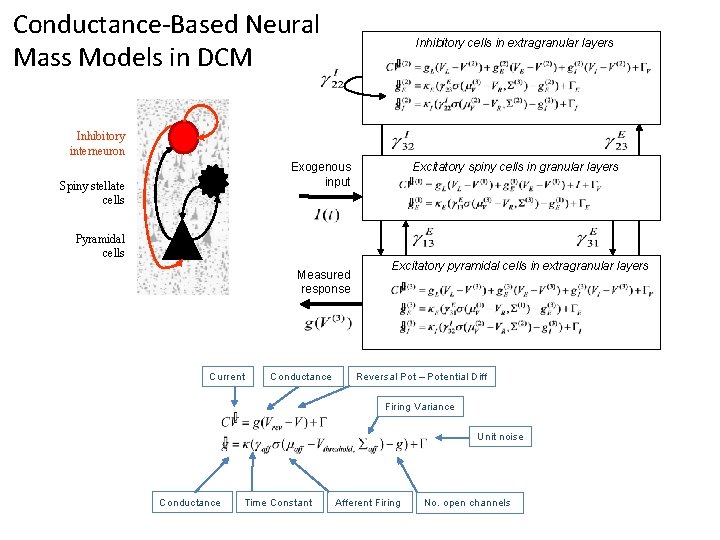
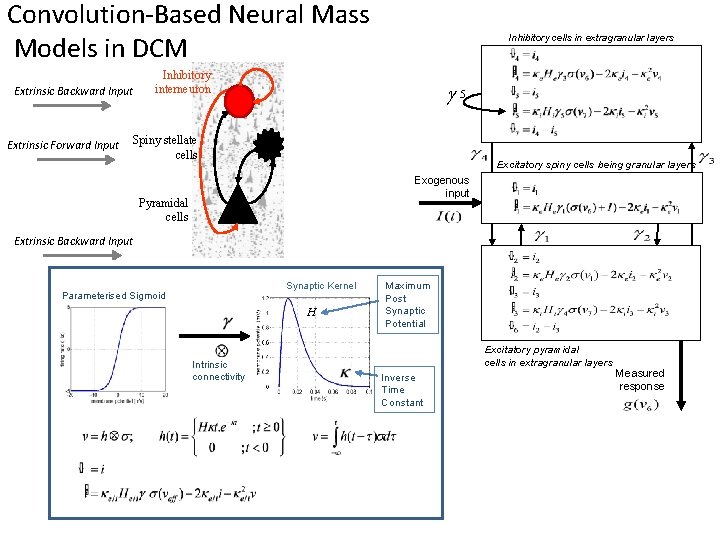
Conductance-Based Neural Mass Models in DCM Inhibitory cells in extragranular layers Inhibitory interneuron Excitatory spiny cells in granular layers Exogenous input Spiny stellate cells Pyramidal cells Measured response Current Conductance Excitatory pyramidal cells in extragranular layers Reversal Pot – Potential Diff Firing Variance Unit noise Conductance Time Constant Afferent Firing No. open channels
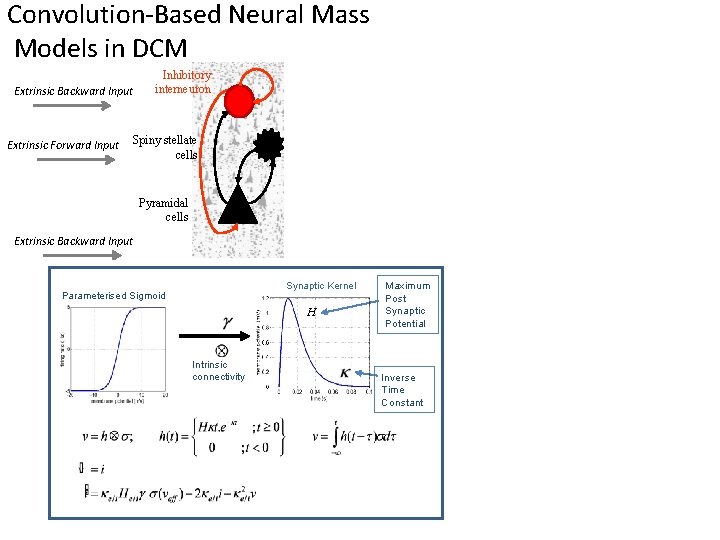
Convolution-Based Neural Mass Models in DCM Extrinsic Backward Input Extrinsic Forward Input Inhibitory interneuron Spiny stellate cells Pyramidal cells Extrinsic Backward Input Synaptic Kernel Parameterised Sigmoid H Intrinsic connectivity Maximum Post Synaptic Potential Inverse Time Constant
Convolution-Based Neural Mass Models in DCM Extrinsic Backward Input Extrinsic Forward Input Inhibitory cells in extragranular layers Inhibitory interneuron g 5 Spiny stellate cells Excitatory spiny cells being granular layers Exogenous input Pyramidal cells Extrinsic Backward Input Synaptic Kernel Parameterised Sigmoid H Intrinsic connectivity Maximum Post Synaptic Potential Excitatory pyramidal cells in extragranular layers Inverse Time Constant Measured response
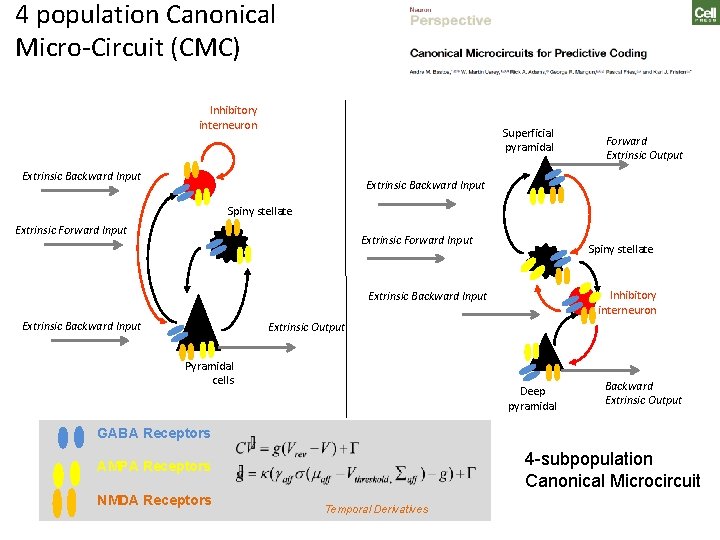
4 population Canonical Micro-Circuit (CMC) Inhibitory interneuron Superficial pyramidal Extrinsic Backward Input Forward Extrinsic Output Extrinsic Backward Input Spiny stellate Extrinsic Forward Input Spiny stellate Inhibitory interneuron Extrinsic Backward Input Extrinsic Output Pyramidal cells Deep pyramidal Backward Extrinsic Output GABA Receptors 4 -subpopulation Canonical Microcircuit AMPA Receptors NMDA Receptors Temporal Derivatives
Outline Data Features in DCM for CSD Generative Models in the time domain Generative Models in the frequency domain DCM Inversion procedure Example 1: L-Dopa Modulations of theta spectra using DCM for CSD Example 2: Propofol Modulations of Delta and Gamma spectra using DCM for CSD
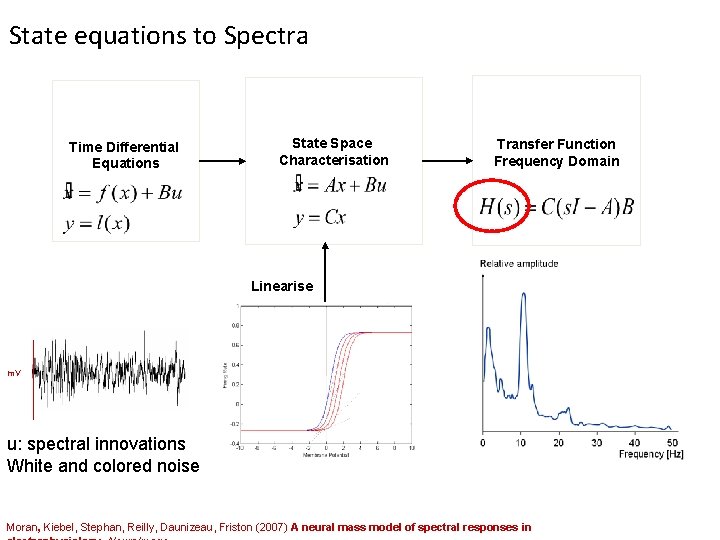
State equations to Spectra Time Differential Equations State Space Characterisation Transfer Function Frequency Domain Linearise m. V u: spectral innovations White and colored noise Moran, Kiebel, Stephan, Reilly, Daunizeau, Friston (2007) A neural mass model of spectral responses in
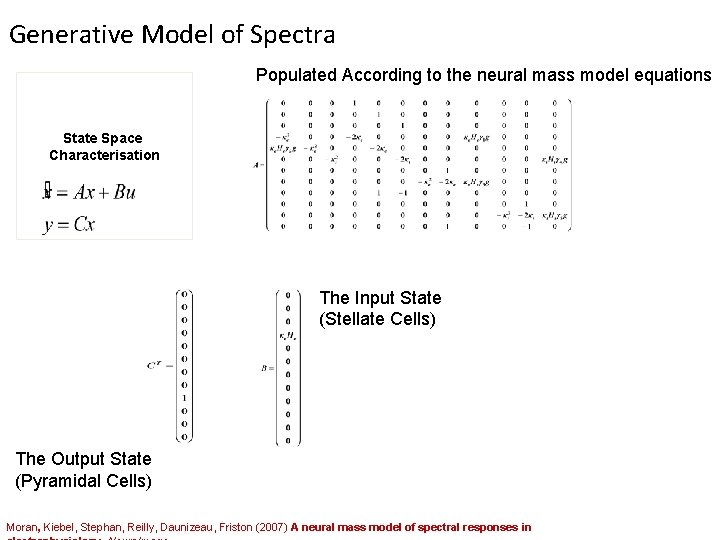
Generative Model of Spectra Populated According to the neural mass model equations State Space Characterisation The Input State (Stellate Cells) The Output State (Pyramidal Cells) Moran, Kiebel, Stephan, Reilly, Daunizeau, Friston (2007) A neural mass model of spectral responses in
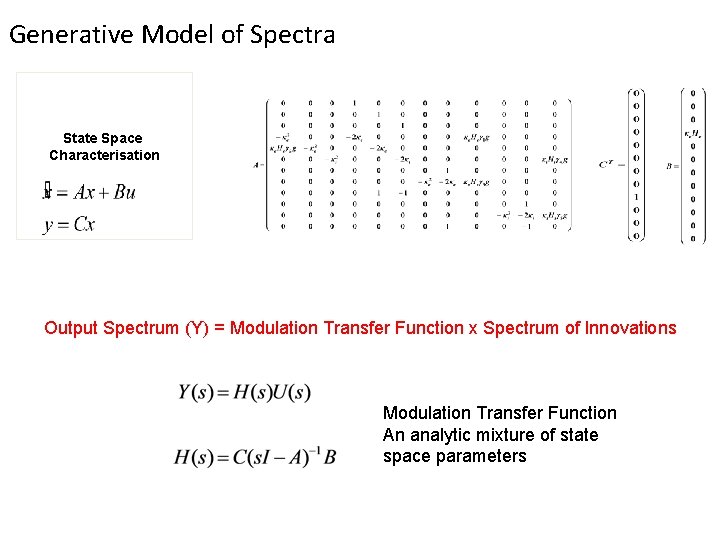
Generative Model of Spectra State Space Characterisation Output Spectrum (Y) = Modulation Transfer Function x Spectrum of Innovations Modulation Transfer Function An analytic mixture of state space parameters
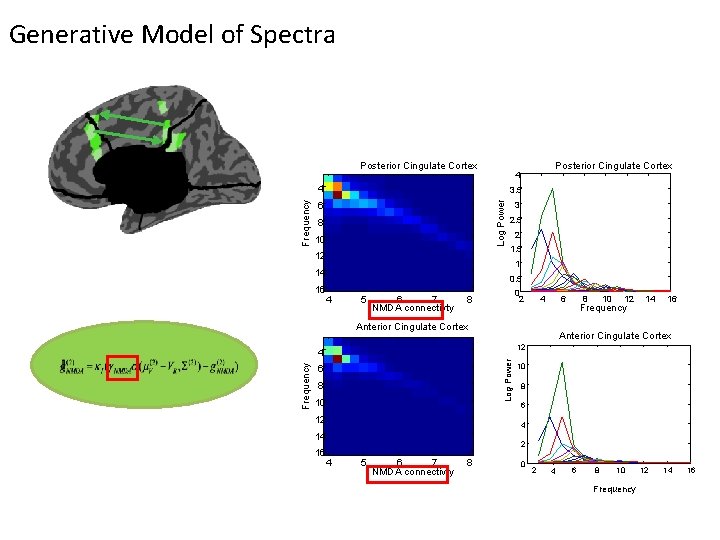
Generative Model of Spectra Posterior Cingulate Cortex 3. 5 Log Power Frequency 4 6 8 10 12 3 2. 5 2 1. 5 1 14 16 Posterior Cingulate Cortex 4 0. 5 4 5 6 7 NMDA connectivty 0 2 8 4 6 Anterior Cingulate Cortex 12 14 16 Anterior Cingulate Cortex Log Power Frequency 10 12 4 6 8 10 12 10 8 6 4 14 16 8 Frequency 2 4 5 6 7 NMDA connectivty 8 0 2 4 6 8 10 Frequency 12 14 16
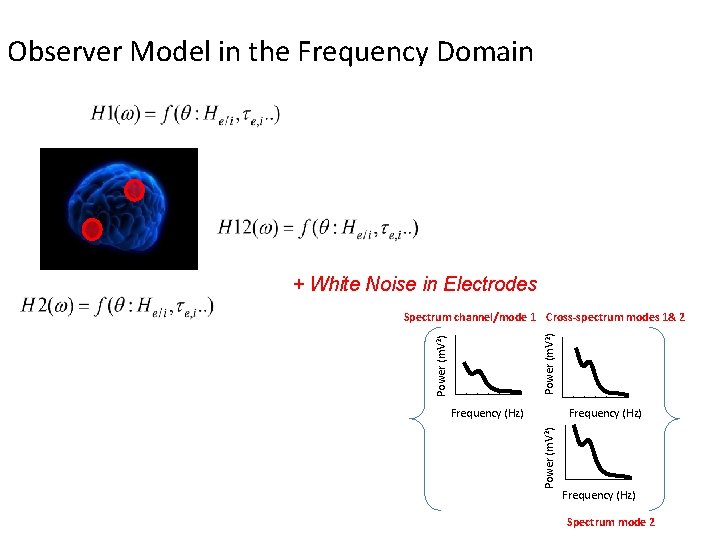
Observer Model in the Frequency Domain + White Noise in Electrodes Power (m. V 2) Spectrum channel/mode 1 Cross-spectrum modes 1& 2 Frequency (Hz) Power (m. V 2) Frequency (Hz) Spectrum mode 2
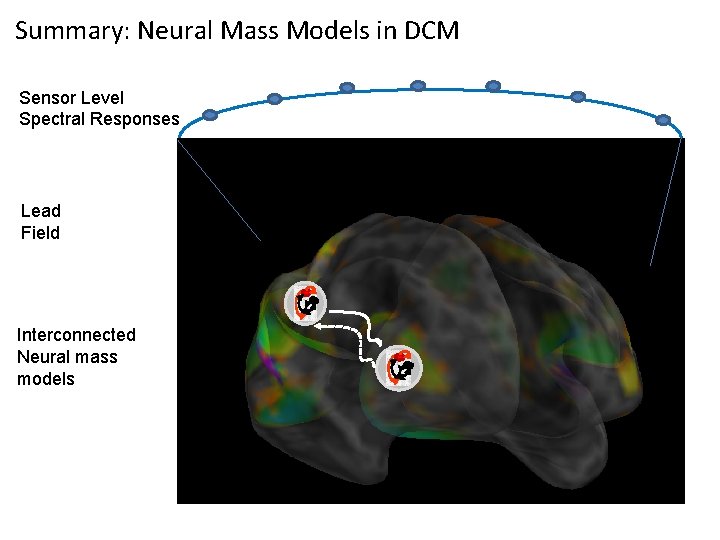
Summary: Neural Mass Models in DCM Sensor Level Spectral Responses Lead Field Interconnected Neural mass models
Outline Data Features in DCM for CSD Generative Models in the time domain Generative Models in the frequency domain DCM Inversion procedure Example 1: L-Dopa Modulations of theta spectra using DCM for CSD Example 2: Propofol Modulations of Delta and Gamma spectra using DCM for CSD
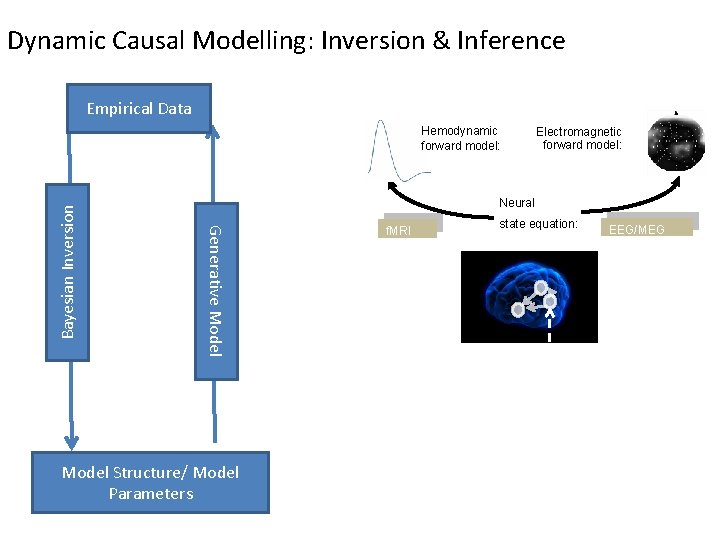
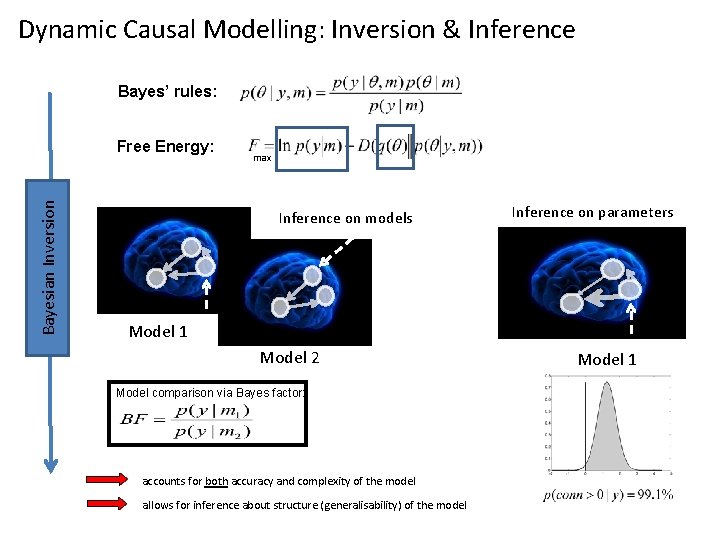
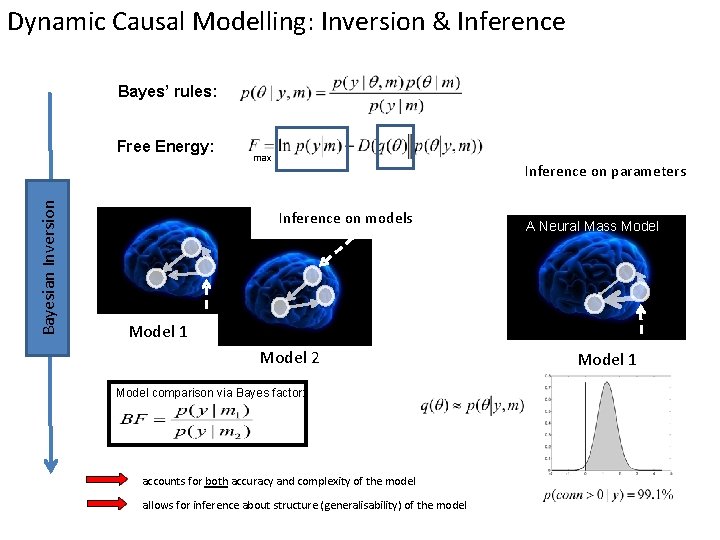
Dynamic Causal Modelling: Inversion & Inference Empirical Data Electromagnetic forward model: Neural Generative Model Bayesian Inversion Hemodynamic forward model: Model Structure/ Model Parameters f. MRI state equation: EEG/MEG
Dynamic Causal Modelling: Inversion & Inference Bayes’ rules: Bayesian Inversion Free Energy: max Inference on models Inference on parameters Model 1 Model 2 Model comparison via Bayes factor: accounts for both accuracy and complexity of the model allows for inference about structure (generalisability) of the model Model 1
Dynamic Causal Modelling: Inversion & Inference Bayes’ rules: Bayesian Inversion Free Energy: max Inference on parameters Inference on models A Neural Mass Model 1 Model 2 Model comparison via Bayes factor: accounts for both accuracy and complexity of the model allows for inference about structure (generalisability) of the model Model 1
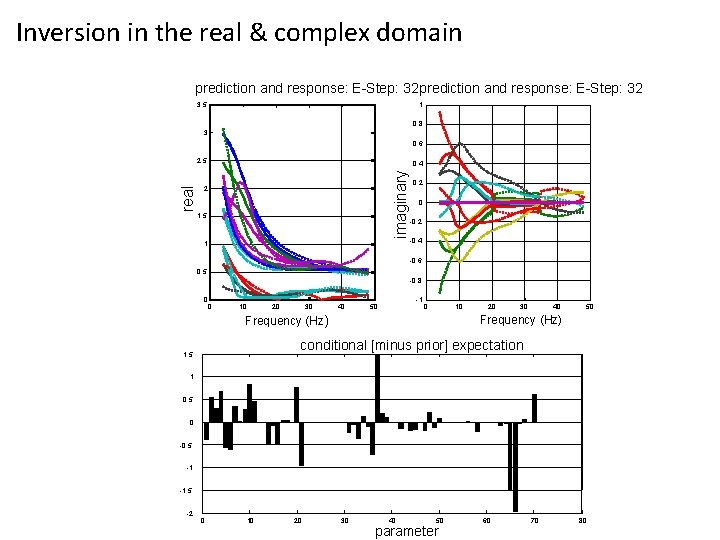
Inversion in the real & complex domain prediction and response: E-Step: 32 3. 5 1 0. 8 3 0. 6 0. 4 imaginary real 2. 5 2 1. 5 1 0. 2 0 -0. 2 -0. 4 -0. 6 0. 5 -0. 8 0 0 10 20 30 40 -1 50 0 10 Frequency (Hz) 20 30 40 50 Frequency (Hz) conditional [minus prior] expectation 1. 5 1 0. 5 0 -0. 5 -1 -1. 5 -2 0 10 20 30 40 50 parameter 60 70 80
Outline Data Features in DCM for CSD Generative Models in the time domain Generative Models in the frequency domain DCM Inversion procedure Example 1: L-Dopa Modulations of theta spectra using DCM for CSD Example 2: Propofol Modulations of Delta and Gamma spectra using DCM for CSD
Dopaminergic modulation in Humans Aim: Infer plausible synaptic effects of dopamine in humans via non-invasive imaging Approach: Double blind cross-over (within subject) design, with participants on placebo or levodopa Use MEG to measure effects of increased dopaminergic transmission Study a simple paradigm with “known” dopaminergic effects (from the animal literature): working memory maintenance Apply DCM to one region (a region with sustained activity throughout maintenance prefrontal) Moran, Symmonds, Stephan, Friston, Dolan (2011) An In Vivo Assay of Synaptic Function Mediating Human Cognition, Current Biology
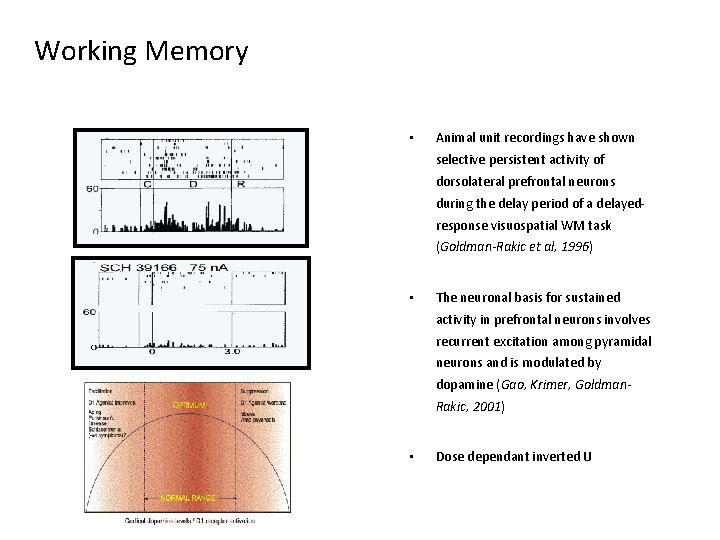
Working Memory • Animal unit recordings have shown selective persistent activity of dorsolateral prefrontal neurons during the delay period of a delayedresponse visuospatial WM task (Goldman-Rakic et al, 1996) • The neuronal basis for sustained activity in prefrontal neurons involves recurrent excitation among pyramidal neurons and is modulated by dopamine (Gao, Krimer, Goldman. Rakic, 2001) • Dose dependant inverted U
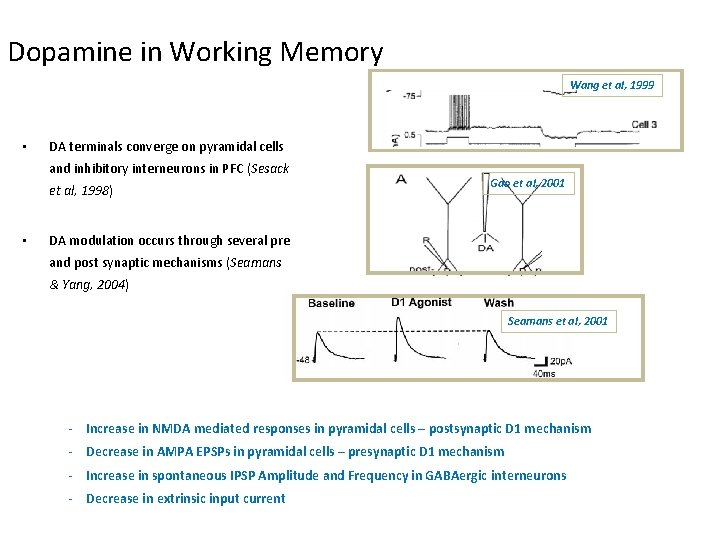
Dopamine in Working Memory Wang et al, 1999 • DA terminals converge on pyramidal cells and inhibitory interneurons in PFC (Sesack et al, 1998) • Gao et al, 2001 DA modulation occurs through several pre and post synaptic mechanisms (Seamans & Yang, 2004) Seamans et al, 2001 - Increase in NMDA mediated responses in pyramidal cells – postsynaptic D 1 mechanism - Decrease in AMPA EPSPs in pyramidal cells – presynaptic D 1 mechanism - Increase in spontaneous IPSP Amplitude and Frequency in GABAergic interneurons - Decrease in extrinsic input current
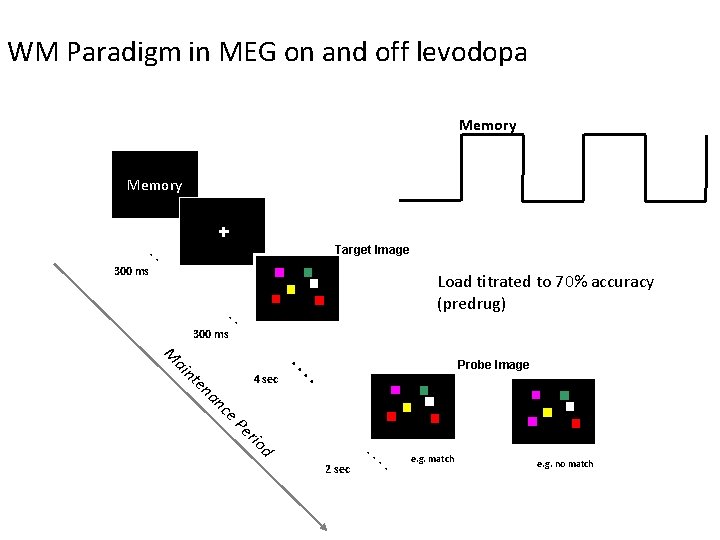
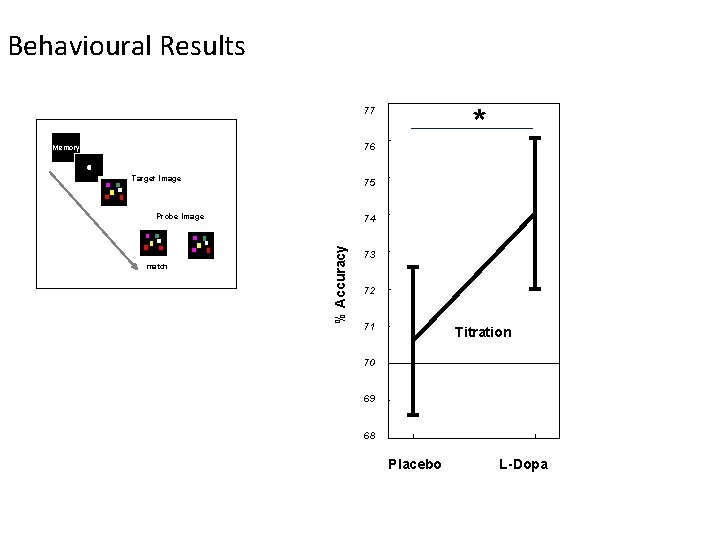
WM Paradigm in MEG on and off levodopa Memory . . Target Image 300 ms Load titrated to 70% accuracy (predrug) . . 300 ms e. P er Probe Image . . en an c 4 sec . . M ai nt io d . . 2 sec . . e. g. match e. g. no match
Behavioural Results * 77 76 Memory Target Image 75 Probe Image % Accuracy match 74 73 72 71 Titration 70 69 68 Placebo L-Dopa
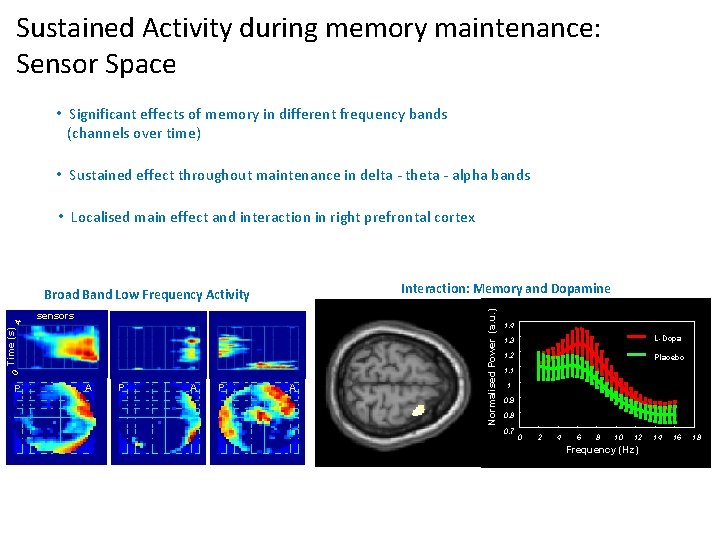
Sustained. Activity during memory maintenance: at sensors during Sensor Space maintenance • Significant effects of memory in different frequency bands (channels over time) • Sustained effect throughout maintenance in delta - theta - alpha bands • Localised main effect and interaction in right prefrontal cortex c A P A Frequency (Hz) 0 Time (s) 4 P sensors Normalised Power (a. u. ) Interaction: Memory and Dopamine Broad Band Low Frequency Activity 1. 4 1. 3 1. 2 1. 1 L-Dopa Placebo 1 0. 9 0. 8 0. 7 0 2 4 6 8 10 12 Frequency (Hz) Time (msec) 14 16 18
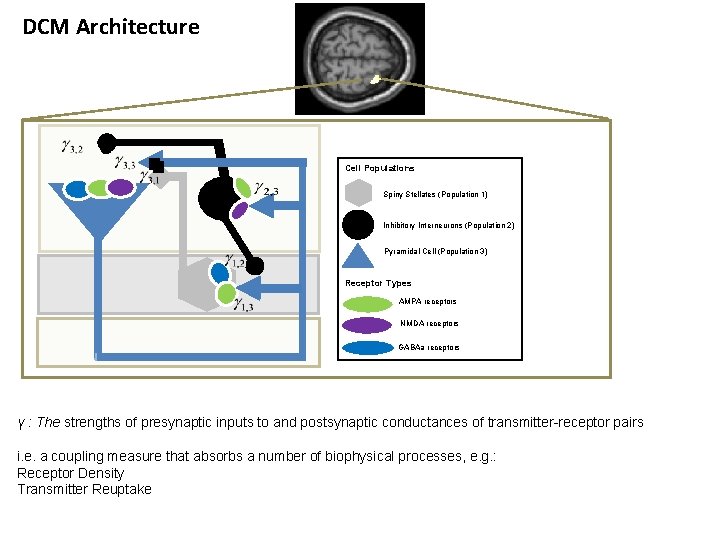
DCM Architecture Cell Populations Spiny Stellates (Population 1) Inhibitory Interneurons (Population 2) Pyramidal Cell (Population 3) Receptor Types AMPA receptors NMDA receptors GABAa receptors γ : The strengths of presynaptic inputs to and postsynaptic conductances of transmitter-receptor pairs i. e. a coupling measure that absorbs a number of biophysical processes, e. g. : Receptor Density Transmitter Reuptake
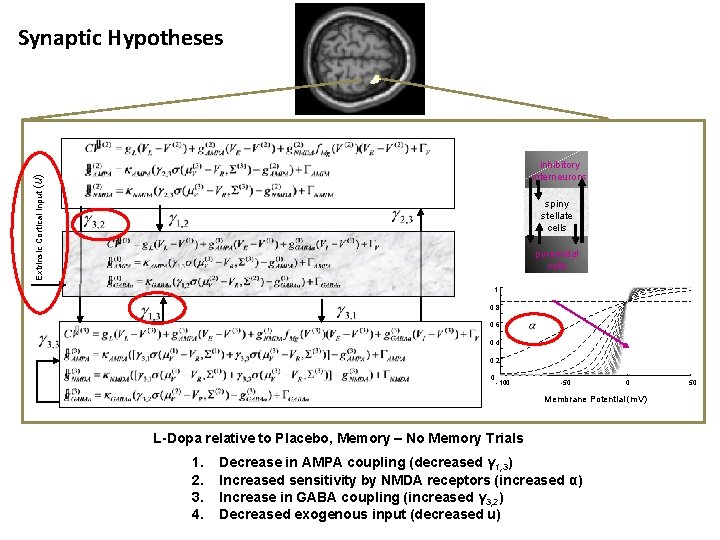
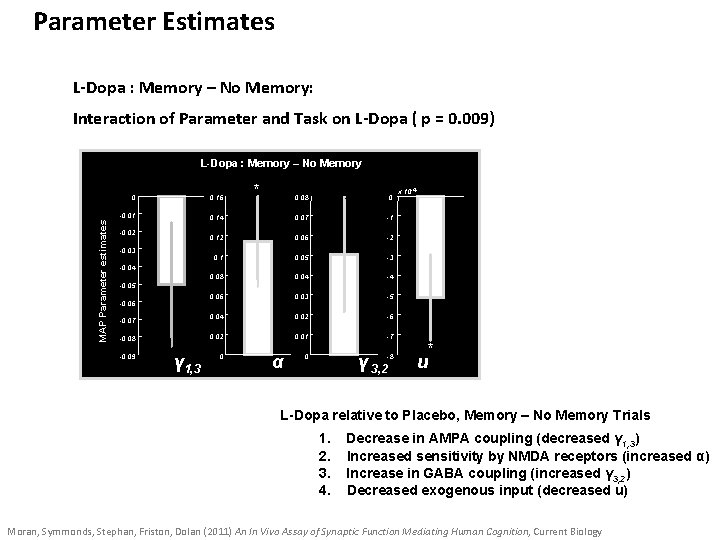
Synaptic Hypotheses Extrinsic Cortical Input (u) inhibitory interneurons pyrami dal spiny stellate cells pyrami dal pyramidal cells 1 0. 8 0. 6 0. 4 0. 2 0 -100 -50 0 Membrane Potential (m. V) L-Dopa relative to Placebo, Memory – No Memory Trials 1. 2. 3. 4. Decrease in AMPA coupling (decreased γ 1, 3) Increased sensitivity by NMDA receptors (increased α) Increase in GABA coupling (increased γ 3, 2) Decreased exogenous input (decreased u) 50
Parameter Estimates L-Dopa : Memory – No Memory: Interaction of Parameter and Task on L-Dopa ( p = 0. 009) MAP Parameter estimates L-Dopa : Memory – No Memory 0 0. 16 -0. 01 -0. 02 -0. 03 * 0. 08 0 0. 14 0. 07 -1 0. 12 0. 06 -2 0. 1 0. 05 -3 0. 08 0. 04 -4 0. 06 0. 03 -5 0. 04 0. 02 -6 0. 02 0. 01 -7 x 10 -4 -0. 05 -0. 06 -0. 07 -0. 08 -0. 09 γ 1, 3 u 0 α γ 3, 2 0 -8 * u L-Dopa relative to Placebo, Memory – No Memory Trials 1. 2. 3. 4. Decrease in AMPA coupling (decreased γ 1, 3) Increased sensitivity by NMDA receptors (increased α) Increase in GABA coupling (increased γ 3, 2) Decreased exogenous input (decreased u) Moran, Symmonds, Stephan, Friston, Dolan (2011) An In Vivo Assay of Synaptic Function Mediating Human Cognition, Current Biology
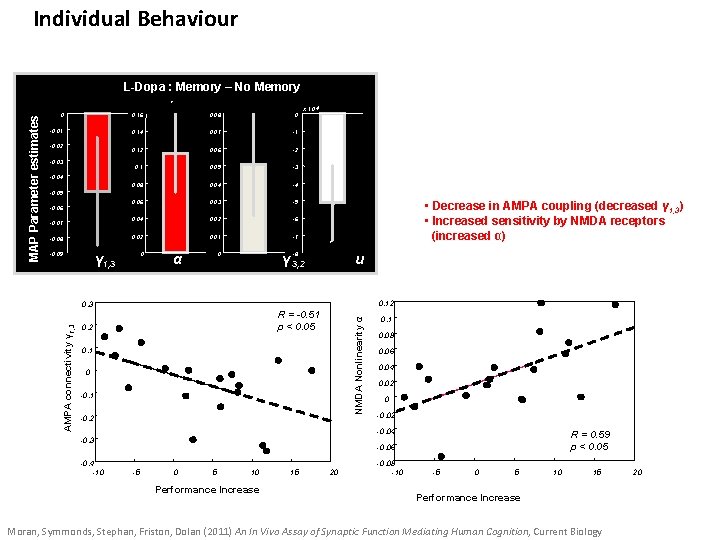
Individual Behaviour L-Dopa : Memory – No Memory 0. 16 0. 08 0 -0. 01 0. 14 0. 07 -1 0. 12 0. 06 -2 0. 1 0. 05 -3 0. 08 0. 04 -4 0. 06 0. 03 -5 0. 04 0. 02 -6 -0. 08 0. 02 0. 01 -7 -0. 09 0 0 -8 -0. 02 -0. 03 x 10 -4 -0. 05 -0. 06 -0. 07 γ 1, 3 α * γ 3, 2 u 0. 12 0. 3 AMPA connectivity γ 1, 3 • Decrease in AMPA coupling (decreased γ 1, 3) • Increased sensitivity by NMDA receptors (increased α) R = -0. 51 p < 0. 05 0. 2 NMDA Nonlinearity α MAP Parameter estimates * 0 0. 1 0 -0. 1 -0. 2 0. 1 0. 08 0. 06 0. 04 0. 02 0 -0. 02 -0. 04 -0. 3 -0. 4 -10 R = 0. 59 p < 0. 05 -0. 06 -5 0 5 10 Performance Increase 15 20 -0. 08 -10 -5 0 5 10 15 Performance Increase Moran, Symmonds, Stephan, Friston, Dolan (2011) An In Vivo Assay of Synaptic Function Mediating Human Cognition, Current Biology 20
Outline Data Features in DCM for CSD Generative Models in the time domain Generative Models in the frequency domain DCM Inversion procedure Example 1: L-Dopa Modulations of theta spectra using DCM for CSD Example 2: Propofol Modulations of Delta and Gamma spectra using DCM for CSD
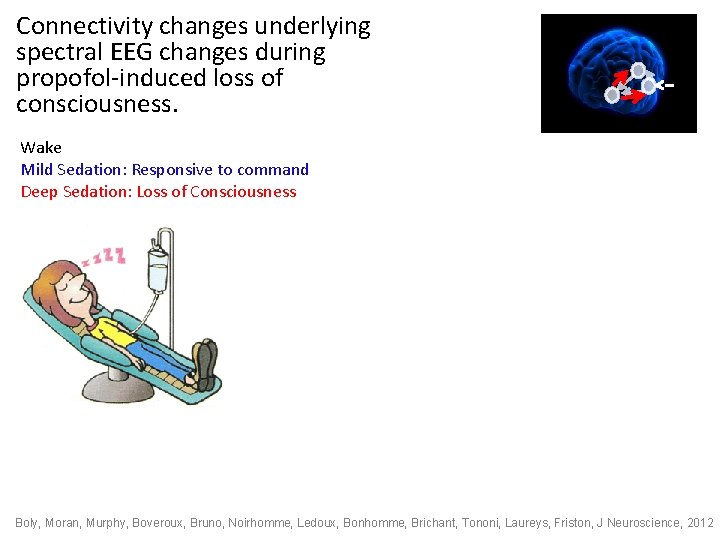
Connectivity changes underlying spectral EEG changes during propofol-induced loss of consciousness. Wake Mild Sedation: Responsive to command Deep Sedation: Loss of Consciousness Boly, Moran, Murphy, Boveroux, Bruno, Noirhomme, Ledoux, Bonhomme, Brichant, Tononi, Laureys, Friston, J Neuroscience, 2012
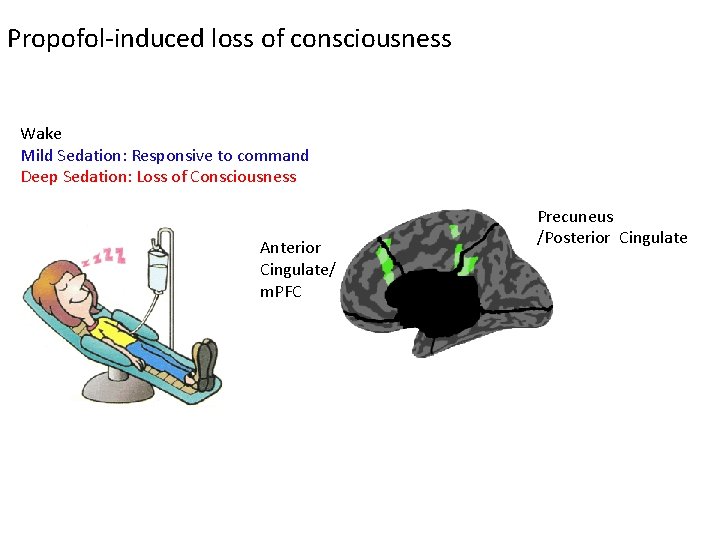
Propofol-induced loss of consciousness Wake Mild Sedation: Responsive to command Deep Sedation: Loss of Consciousness Anterior Cingulate/ m. PFC Precuneus /Posterior Cingulate
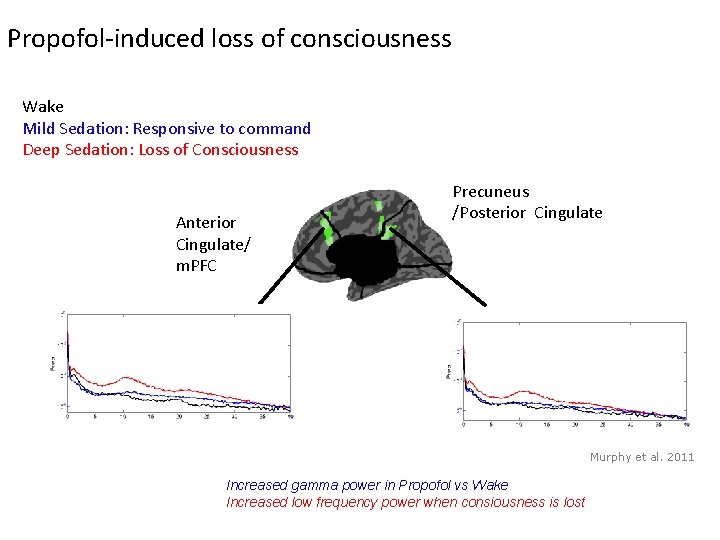
Propofol-induced loss of consciousness Wake Mild Sedation: Responsive to command Deep Sedation: Loss of Consciousness Anterior Cingulate/ m. PFC Precuneus /Posterior Cingulate Murphy et al. 2011 Increased gamma power in Propofol vs Wake Increased low frequency power when consiousness is lost
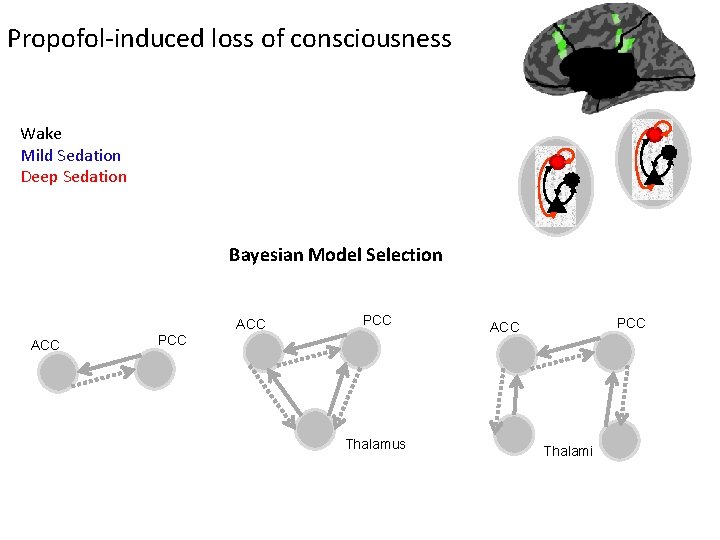
Propofol-induced loss of consciousness Wake Mild Sedation Deep Sedation Bayesian Model Selection ACC PCC Thalamus PCC ACC Thalami
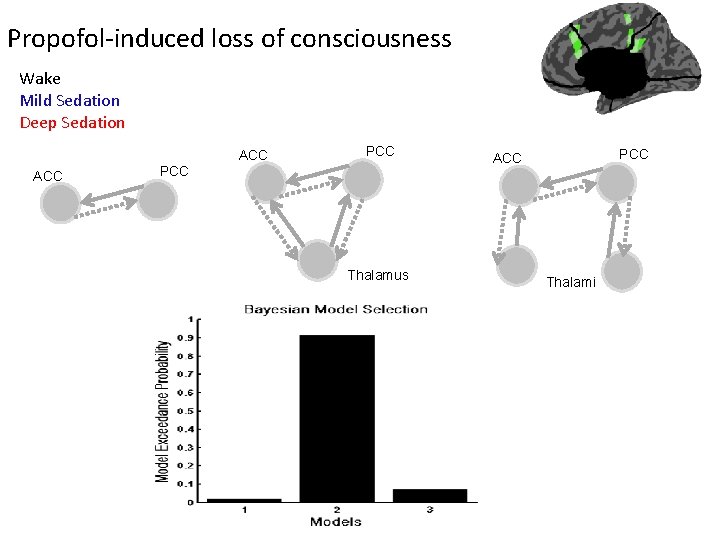
Propofol-induced loss of consciousness Wake Mild Sedation Deep Sedation ACC PCC Thalamus PCC ACC Thalami
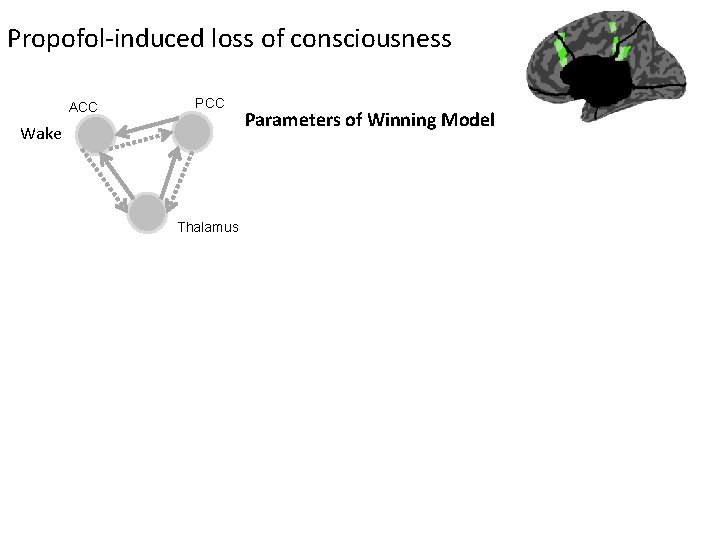
Propofol-induced loss of consciousness ACC PCC Wake Thalamus Parameters of Winning Model
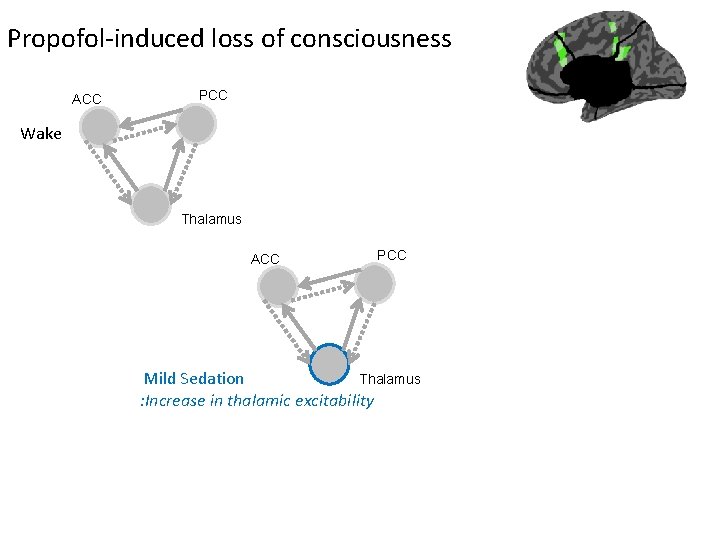
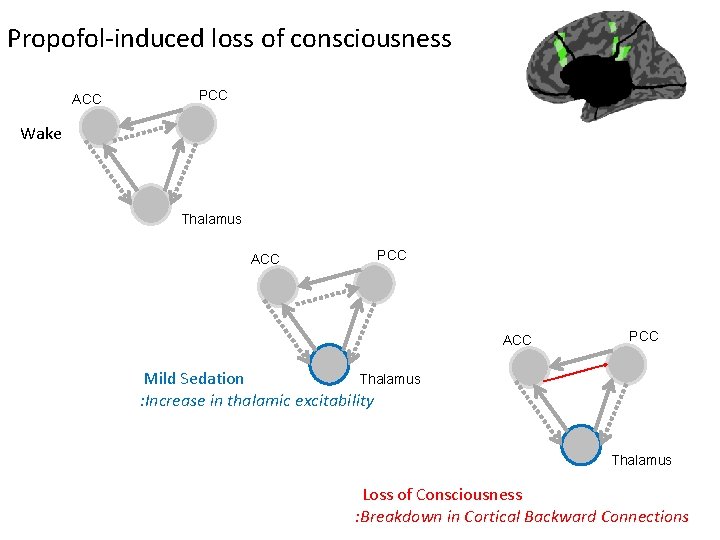
Propofol-induced loss of consciousness ACC PCC Wake Thalamus ACC PCC Thalamus Mild Sedation : Increase in thalamic excitability
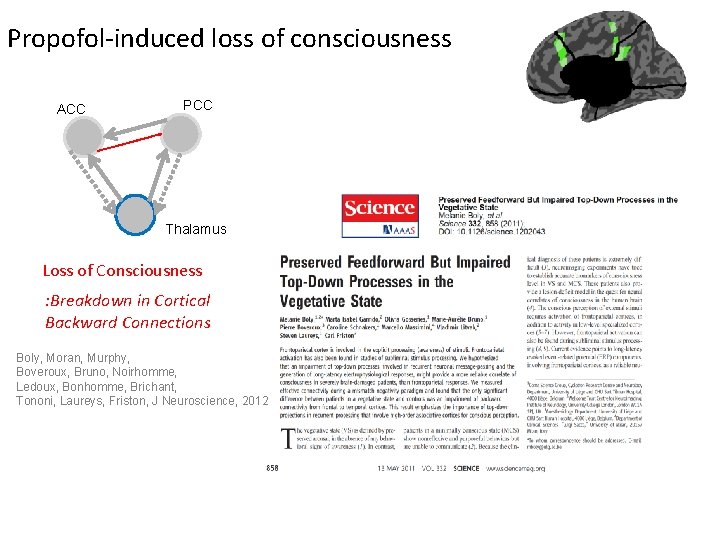
Propofol-induced loss of consciousness ACC PCC Wake Thalamus ACC PCC Thalamus Mild Sedation : Increase in thalamic excitability Thalamus Loss of Consciousness : Breakdown in Cortical Backward Connections
Propofol-induced loss of consciousness ACC PCC Thalamus Loss of Consciousness : Breakdown in Cortical Backward Connections Boly, Moran, Murphy, Boveroux, Bruno, Noirhomme, Ledoux, Bonhomme, Brichant, Tononi, Laureys, Friston, J Neuroscience, 2012
Summary • DCM is a generic framework for asking mechanistic questions of neuroimaging data • Neural mass models parameterise intrinsic and extrinsic ensemble connections and synaptic measures • DCM for SSR is a compact characterisation of multi- channel LFP or EEG data in the Frequency Domain • Bayesian inversion provides parameter estimates and allows model comparison for competing hypothesised architectures • Empirical results suggest valid physiological predictions
Thank You • FIL Methods Group