Correlation The sample covariance matrix where The sample


 The test")
 The test statistic")


-variate Normal distribution with mean vector and Covariance matrix We are")


 have p-variate Normal distribution with and Let and")
 Now Thus has")
 Now Thus hence")


 Proof: then and")


 Now has covariance")


 • motivation score (X 2). • •")


- Slides: 48
Correlation
The sample covariance matrix: where
The sample correlation matrix: where
Note: where
Tests for Independence and Non-zero correlation
Tests for Independence Test for zero correlation (Independence between a two variables) The test statistic If independence is true then the test statistic t will have a t distributions with n = n – 2 degrees of freedom. The test is to reject independence if:
Test for non-zero correlation (H 0: r = r 0 ) The test statistic If H 0 is true the test statistic z will have approximately a Standard Normal distribution We then reject H 0 if:
Partial Correlation Conditional Independence
Recall has p-variate Normal distribution with mean vector and Covariance matrix Then the conditional distribution of Normal distribution with mean vector and Covariance matrix given is qi-variate
is called the matrix of partial variances and covariances. is called the partial covariance (variance if i = j) between xi and xj given x 1, … , xq. is called the partial correlation between xi and xj given x 1, … , xq.
Let denote the sample Covariance matrix Let is called the sample partial covariance (variance if i = j) between xi and xj given x 1, … , xq.
Also is called the sample partial correlation between xi and xj given x 1, … , xq.
Test for zero partial correlation (Conditional independence between a two variables given a set of p Independent variables) The test statistic = the partial correlation between yi and yj given x 1, …, xp. If independence is true then the test statistic t will have a t distributions with n = n – p - 2 degrees of freedom. The test is to reject independence if:
Test for non-zero partial correlation The test statistic If H 0 is true the test statistic z will have approximately a Standard Normal distribution We then reject H 0 if:
The Multiple Correlation Coefficient Testing independence between a single variable and a group of variables
Definition has (p +1)-variate Normal distribution with mean vector and Covariance matrix We are interested if the variable y is independent of the vector The multiple correlation coefficient is the maximum correlation between y and a linear combination of the components of
Derivation This vector has a bivariate Normal distribution with mean vector and Covariance matrix We are interested if the variable y is independent of the vector The multiple correlation coefficient is the maximum correlation between y and a linear combination of the components of
The multiple correlation coefficient is the maximum correlation between y and The correlation between y and Thus we want to choose Equivalently to maximize
Note:
The multiple correlation coefficient is independent of the value of k.
We are interested if the variable y is independent of the vector The sample Multiple correlation coefficient Then the sample Multiple correlation coefficient is
Testing for independence between y and The test statistic If independence is true then the test statistic F will have an Fdistributions with n 1 = p degrees of freedom in the numerator and n 1 = n – p + 1 degrees of freedom in the denominator The test is to reject independence if:
Canonical Correlation Analysis
The problem Quite often when one has collected data on several variables. The variables are grouped into two (or more) sets of variables and the researcher is interested in whether one set of variables is independent of the other set. In addition if it is found that the two sets of variates are dependent, it is then important to describe and understand the nature of this dependence. The appropriate statistical procedure in this case is called Canonical Correlation Analysis.
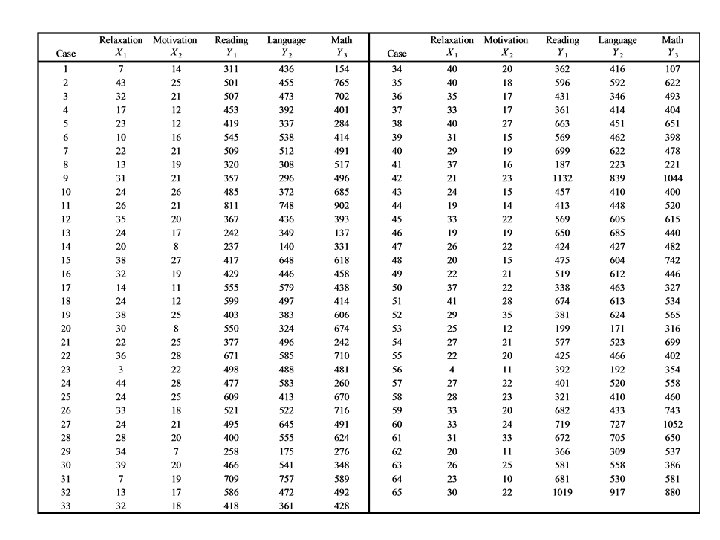
Canonical Correlation: An Example In the following study the researcher was interested in whether specific instructions on how to relax when taking tests and how to increase Motivation , would affect performance on standardized achievement tests • • • Reading, Language and Mathematics
A group of 65 third- and fourth-grade students were rated after the instruction and immediately prior taking the Scholastic Achievement tests on: • how relaxed they were (X 1) and • how motivated they were (X 2). In addition data was collected on the three achievement tests • • • Reading (Y 1), Language (Y 2) and Mathematics (Y 3). The data were tabulated on the next page
Definition: (Canonical variates and Canonical correlations) have p-variate Normal distribution with and Let and be such that U 1 and V 1 have achieved the maximum correlation f 1. Then U 1 and V 1 are called the first pair of canonical variates and f 1 is called the first canonical correlation coefficient.
derivation: ( 1 st pair of Canonical variates and Canonical correlation) Now Thus has covariance matrix
derivation: ( 1 st pair of Canonical variates and Canonical correlation) Now Thus hence has covariance matrix
Thus we want to choose so that is at a maximum or is at a maximum Let
Computing derivatives and
Thus This shows that is an eigenvector of k is the largest eigenvalue of and is the eigenvector associated with the largest eigenvalue.
Also and
Summary: The first pair of canonical variates are found by finding , eigenvectors of the matrices associated with the largest eigenvalue (same for both matrices) The largest eigenvalue of the two matrices is the square of the first canonical correlation coefficient f 1
Note: have exactly the same eigenvalues (same for both matrices) Proof: then and
The remaining canonical variates and canonical correlation coefficients The second pair of canonical variates , so that are found by finding 1. (U 2, V 2) are independent of (U 1, V 1). 2. The correlation between U 2 and V 2 is maximized The correlation, f 2, between U 2 and V 2 is called the second canonical correlation coefficient.
The ith pair of canonical variates are found by finding , so that 1. (Ui, Vi) are independent of (U 1, V 1), …, (Ui-1, Vi-1). 2. The correlation between Ui and Vi is maximized The correlation, f 2, between U 2 and V 2 is called the second canonical correlation coefficient.
derivation: ( 2 nd pair of Canonical variates and Canonical correlation) Now has covariance matrix
Now and maximizing Is equivalent to maximizing subject to Using the Lagrange multiplier technique
Now and also gives the restrictions
These equations can used to show that are eigenvectors of the matrices associated with the 2 nd largest eigenvalue (same for both matrices) The 2 nd largest eigenvalue of the two matrices is the square of the 2 nd canonical correlation coefficient f 2
continuing Coefficients for the ith pair of canonical variates, are eigenvectors of the matrices associated with the ith largest eigenvalue (same for both matrices) The ith largest eigenvalue of the two matrices is the square of the ith canonical correlation coefficient fi
Example Variables • relaxation Score (X 1) • motivation score (X 2). • • • Reading (Y 1), Language (Y 2) and Mathematics (Y 3).
Summary Statistics
Canonical Correlation statistics Statistics
continued
Summary U 1 = 0. 197 Relax + 0. 979 Mot V 1 = 0. 504 Read + 0. 900 Lang + 0. 565 Math f 1 =. 592 U 2 = 0. 980 Relax + 0. 203 Mot V 2 = 0. 391 Math - 0. 361 Read - 0. 354 Lang f 2 =. 159