Confirmatory Factor Analysis 1 n Multitraitmultimethod matrix 6

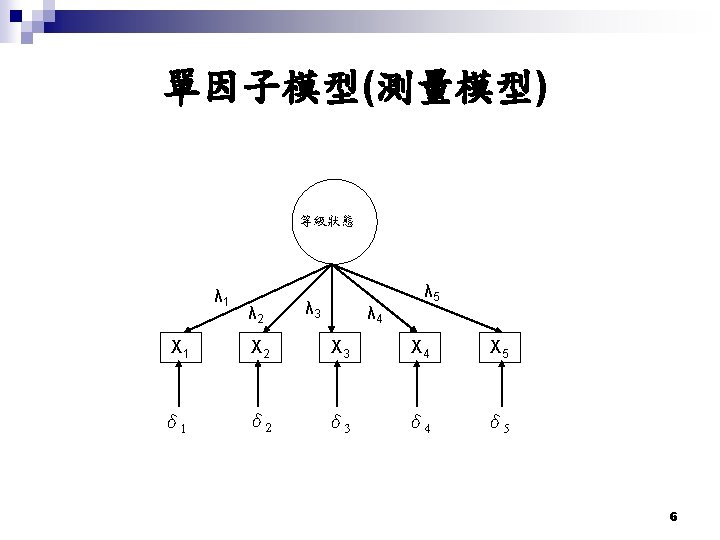
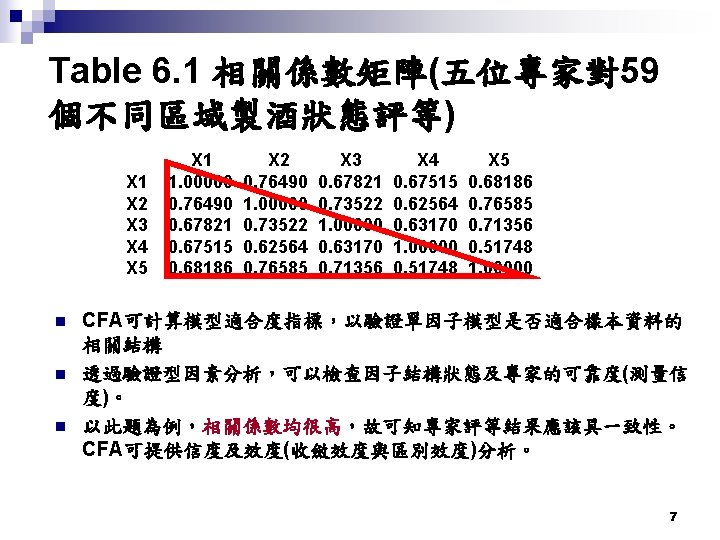
 圖 6. 1 1. 李克尺度: Strongly Agree “Selection is")
分 別採用三種不同方法(Likert scale,")

 17")


 不受樣本大小 > 0. 95:good level (goodness of fit index) 影響,可用於 >")
 信度需 >0. 7 n 定義: n 計算方式 ¨ Test-retest ¨ CFA")
 n n d oo elih Lik ction fun")
 n MLE n n Final version of the log likelihood function (6.")

 >0. 9")

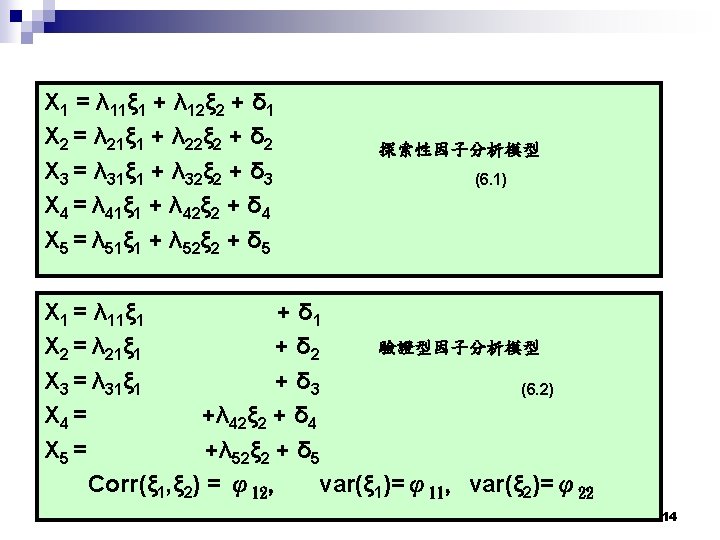
 指標變數 Title Confirmatory Factor Analysis for student test performance Observed")

 採用Single dimension status expert 1 expert 2 expert 3 δ 1 δ")
 指標變數 Title Confirmatory Factor Analysis for Wine Industry")
 指標變數 Title Confirmatory Factor Analysis for student test performance Observed")
 status expert 1 expert 2 expert 3 δ 1 δ 2 δ")
 指標變數 Title Confirmatory Factor Analysis for Wine Inc. - restricted")
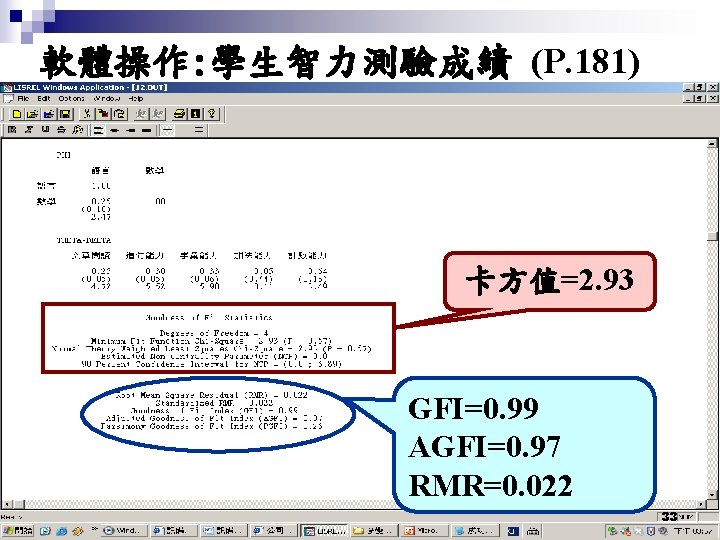
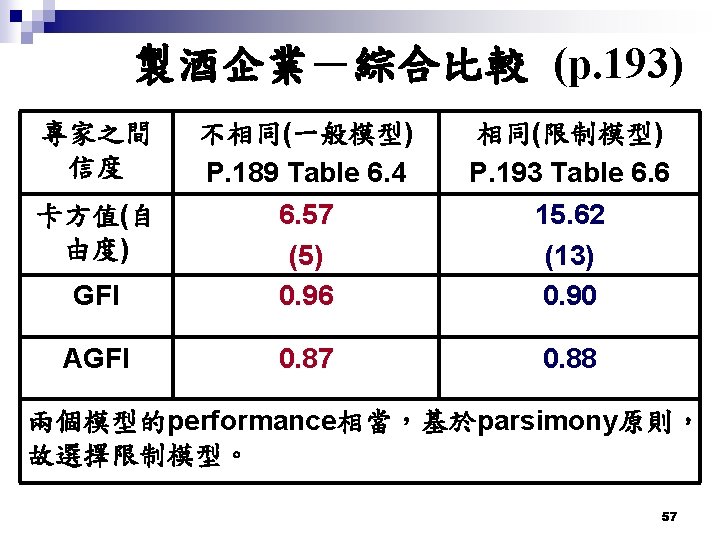
 卡方值 GFI (acceptable)、 AGFI (acceptable)、 RMR 56")
 Menezes and Elber(1979)使用多重衡量方法,李 克尺度(Likert Scale)、語意差異尺度(Semantic differential Scale)、史德培尺度(Stapel Scale)評估 連鎖商店的商店外觀(store")
 assortment appearance AL δ 1 AD δ 2 AS PL")

 62")
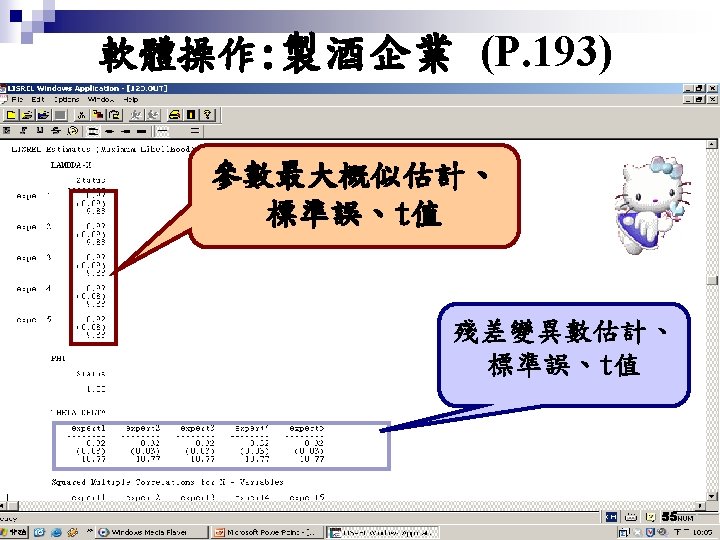
 殘差變異數估計、 標準誤、t值 卡方值 GFI (good)、 AGFI (acceptable) 近似標準殘差矩陣")


 AS PL Semantic differential PD PS")

 product appearance AL δ 1 AD δ 2 加入殘差")

 GFI(good)、 AGFI(good)、RMR 80")

- Slides: 82
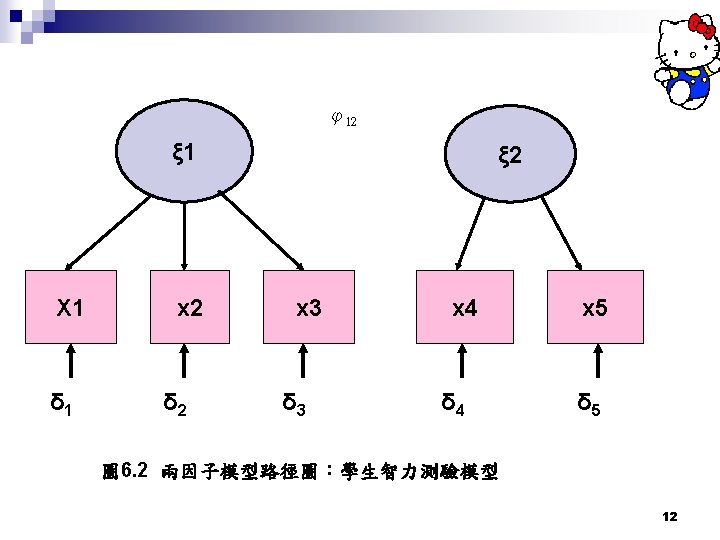
第六章 驗證型因素分析 Confirmatory Factor Analysis 1
n Multitrait–multimethod matrix (多重特質多重方法 ) 圖 6. 1 1. 李克尺度: Strongly Agree “Selection is wide. ” ____ 2. Generally Agree ____ Moderately Disagree ____ Generally Strongly Disagree ____ 語言差異尺度: Extremely Quite Wide Selection ____ Slight ____ Quite ____ Exremely ____ Limited Selection 3. 史德培尺度: +3 ___ +2 ___ +1 ___ Wide Selection -1 ___ -2 ___ 9
n 表 6. 2 相關係數矩陣(針對連鎖商店的兩個特 徵(store appearance, A and product assortment, P)分 別採用三種不同方法(Likert scale, L, Differential scale, D, and Stapel scale, S) ) AL AD AS PL PD PS AL 1. 000 0. 776 0. 638 0. 561 0. 522 AD 1. 000 0. 739 0. 600 0. 635 0. 559 AS PL PD PS 1. 000 0. 539 1. 000 0. 527 0. 713 1. 000 0. 589 0. 720 0. 698 1. 000 10
factor loadings matrix Λ= factor correlation matrix λ 11 0 λ 21 0 λ 31 0 0 0 λ 42 λ 52 1 ψ12 ψ21 1 16
(6. 3) 17
18
適合度衡量指標 說明 數值(0~1) 不受樣本大小 > 0. 95:good level (goodness of fit index) 影響,可用於 > 0. 90:acceptable 不同模型之間 level > 0. 90:good level AGFI 調整後配適 的比較。 度指標 GFI 配適度指標 > 0. 80:acceptable level (adjusted goodness of fit index) RMR 殘差平方根 (root mean square residual) 反應理論假 設模型的整 體殘差 < 0. 05, 越接近 0越好 21
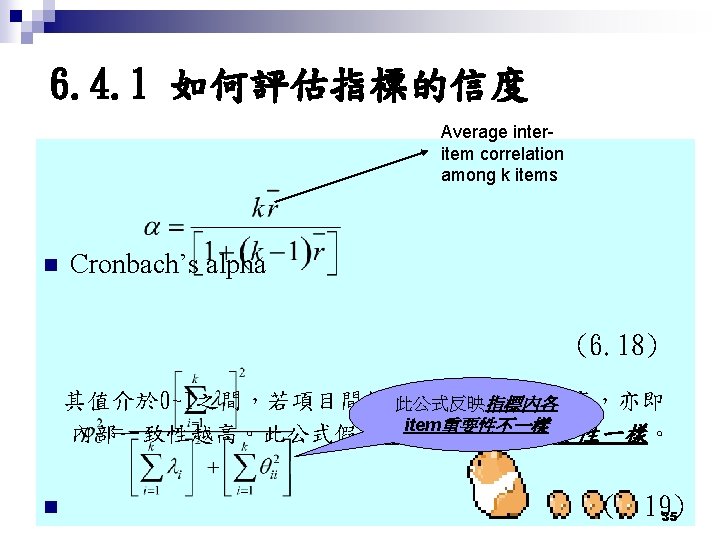
Measure Reliability (信度) 信度需 >0. 7 n 定義: n 計算方式 ¨ Test-retest ¨ CFA λ 2 22
6. 2. 2 Mechanism (6. 6) n n d oo elih Lik ction fun n (P. 184) 假設 Xi~N(0, Σ) (6. 7) 23
(6. 10) n MLE n n Final version of the log likelihood function (6. 11) Obtain parameter estimates to maximize 6. 12 (6. 12)24
模式適合度檢定 H 0: Reduced model is indifferent from full model Ha: two models are significantly different Set α=0. 2 對n極為敏感 25
其他替代的模式適合度指標 >0. 95 good fit >0. 9 acceptable fit (6. 16 ) >0. 9 good fit >0. 8 acceptable fit n (6. 17 ) n 26
Sample Problems 27
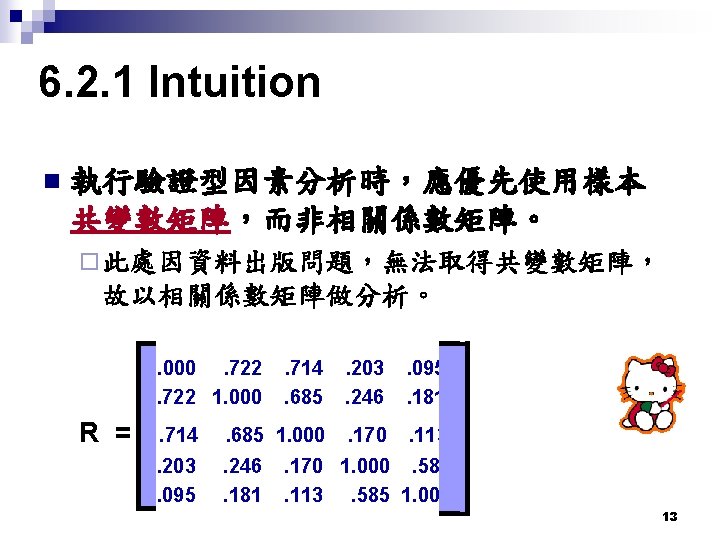
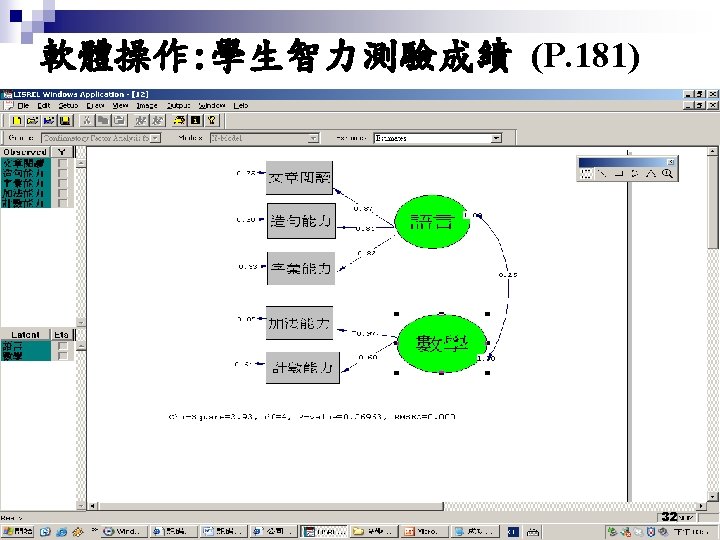
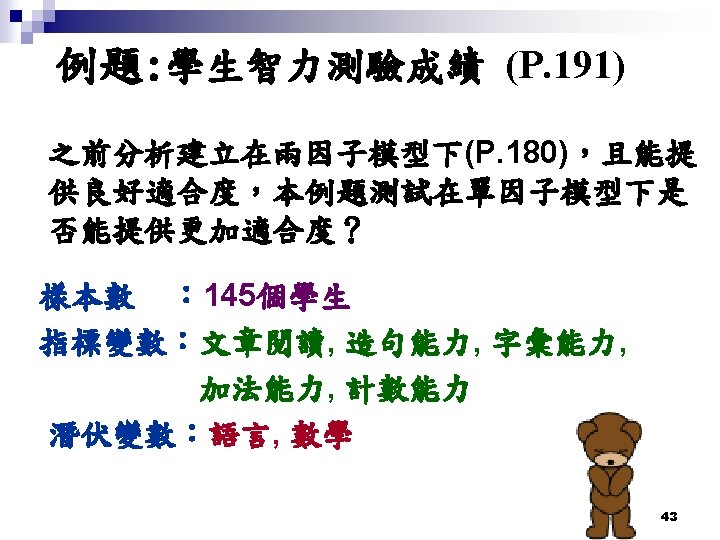
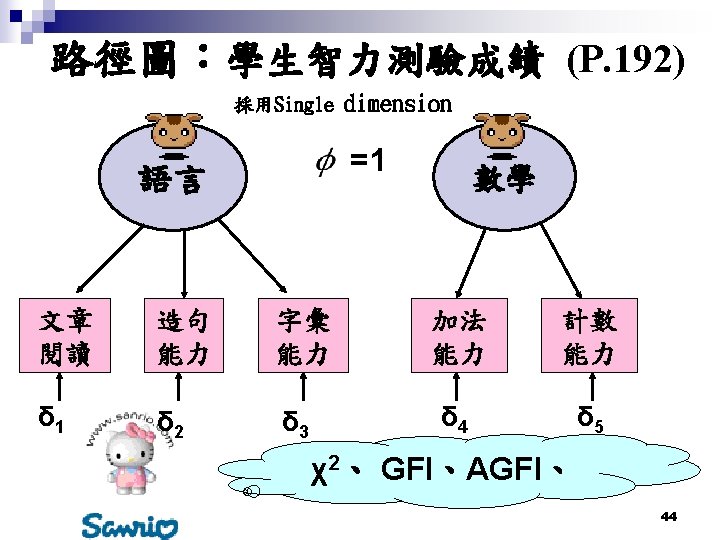
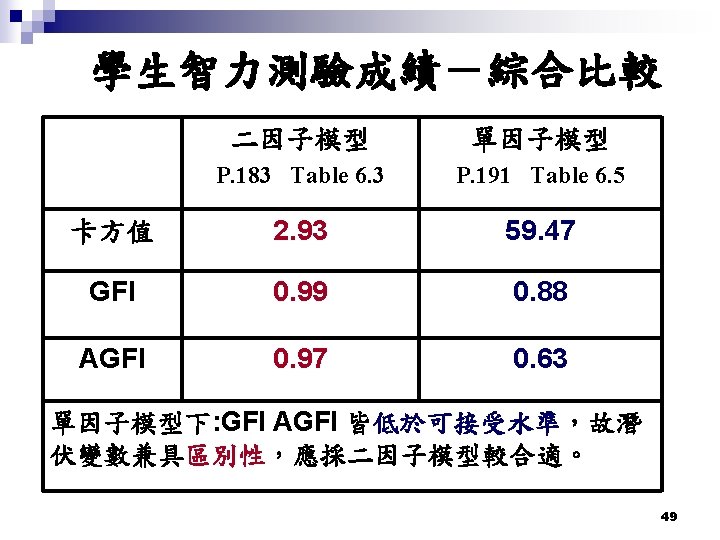
軟體操作: 學生智力測驗成績 (P. 181) 指標變數 Title Confirmatory Factor Analysis for student test performance Observed Variables 文章閱讀 造句能力 字彙能力 加法能力 計數能力 Correlation Matrix= 1 相關矩陣 0. 722 1 0. 714 0. 685 1 0. 203 0. 246 0. 170 1 潛伏變數 0. 095 0. 181 0. 113 0. 585 1 Sample Size=145 Latent Variables 語言 數學 Relationships: 文章閱讀=語言 定義指標變數與 輸出指令 造句能力=語言 潛伏變數之關係 字彙能力=語言 SE: 標準誤 加法能力=數學 TV: t檢定 計數能力=數學 RS: 常態化殘差與Q圖 SET the Covariance of 語言 and 數學 to 1 Path Diagram MI: 修飾指標 31 LISREL OUTPUT SE TV RS MI
Questions Regarding the Application of CFA 34
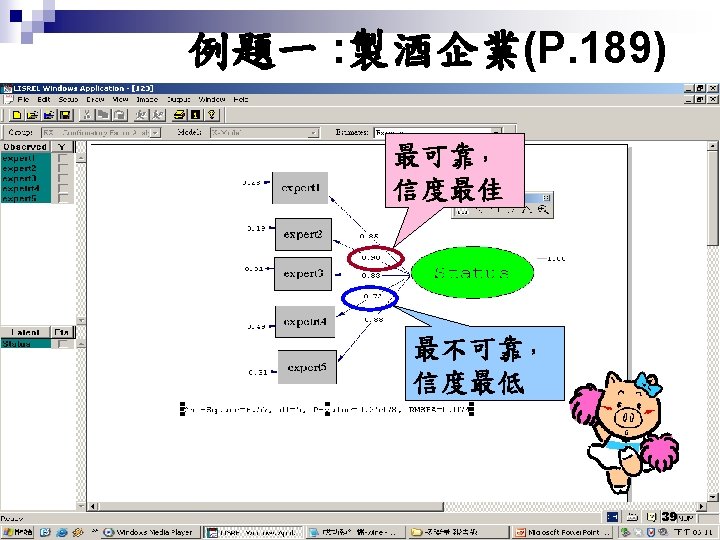
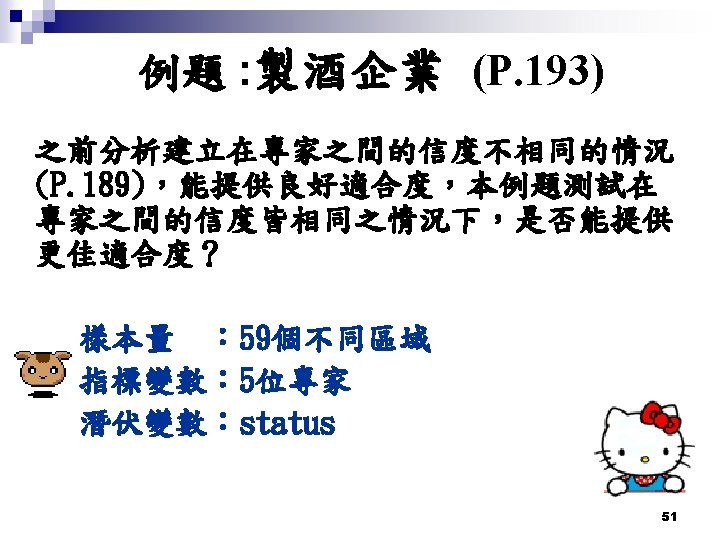
路徑圖:製酒企業(P. 188) 採用Single dimension status expert 1 expert 2 expert 3 δ 1 δ 2 δ 3 Cronbach’s α=0. 91 expert 4 δ 4 expert 5 δ 5 χ2、 GFI、AGFI、 RMR 37
Title: 整個語例題一 法的標題 : 製酒企業(P. 188) 指標變數 Title Confirmatory Factor Analysis for Wine Industry Observed Variables expert 1 expert 2 expert 3 expert 4 expert 5 Correlation Matrix= 1 相關矩陣: 相關性高 0. 765 1 0. 678 0. 735 1 0. 675 0. 626 0. 632 1 樣本量 0. 682 0. 766 0. 714 0. 517 1 Sample Size=59 潛伏變數命名 Latent Variables Status Relationships: 指標變數與潛 expert 1=Status 輸出指令 expert 2=Status 伏變數的關係 SE: 標準誤 expert 3=Status expert 4=Status TV: t檢定 expert 5=Status 繪製路徑圖 RS: 常態化殘差與Q圖 Path Diagram MI: 修飾指標 38 LISREL OUTPUT SE TV RS MI
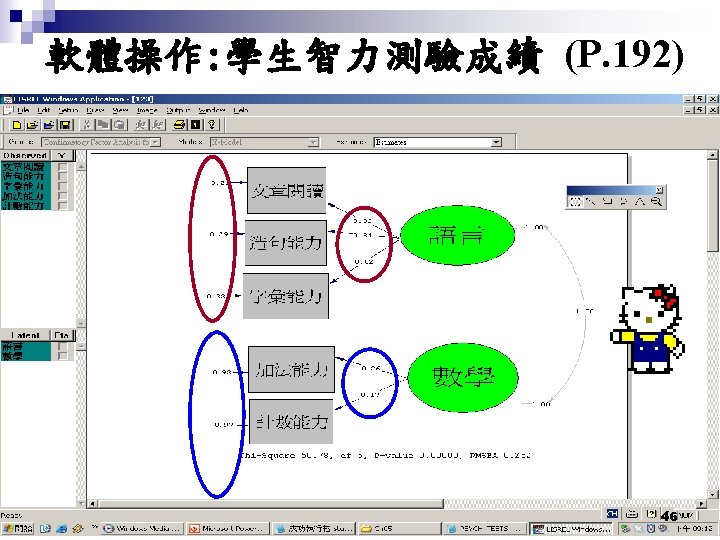
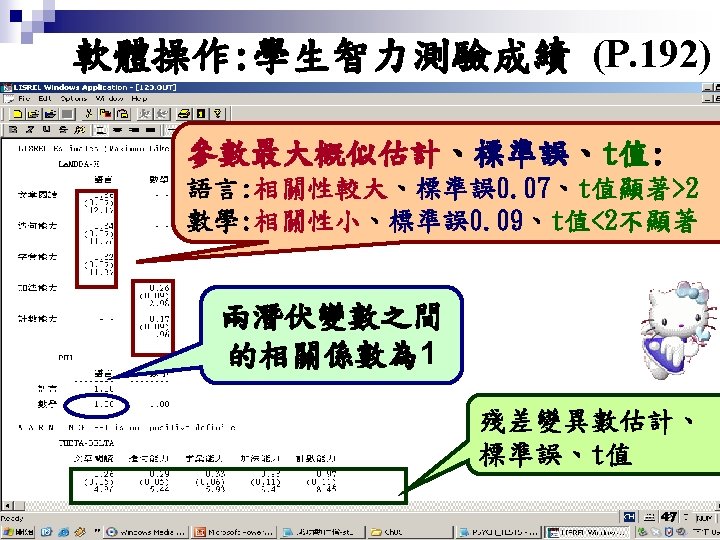
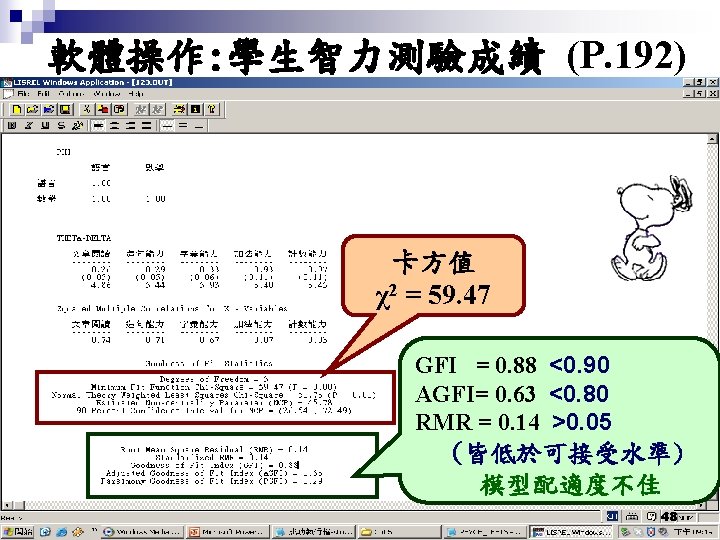
軟體操作: 學生智力測驗成績 (P. 192) 指標變數 Title Confirmatory Factor Analysis for student test performance Observed Variables 文章閱讀 造句能力 字彙能力 加法能力 計數能力 Correlation Matrix= 1 相關矩陣 0. 722 1 0. 714 0. 685 1 0. 203 0. 246 0. 170 1 潛伏變數 0. 095 0. 181 0. 113 0. 585 1 Sample Size=145 定義潛伏變數之間的關係 Latent Variables 語言 數學 Relationships: 相關係數為 1,不具區別效度 文章閱讀=語言 定義指標變數與 造句能力=語言 輸出指令 潛伏變數之關係 字彙能力=語言 SE: 標準誤 加法能力=數學 TV: t檢定 計數能力=數學 SET the Covariance of 語言 and 數學 to 1 RS: 常態化殘差與Q圖 Path Diagram 45 MI: 修飾指標 LISREL OUTPUT SE TV RS MI
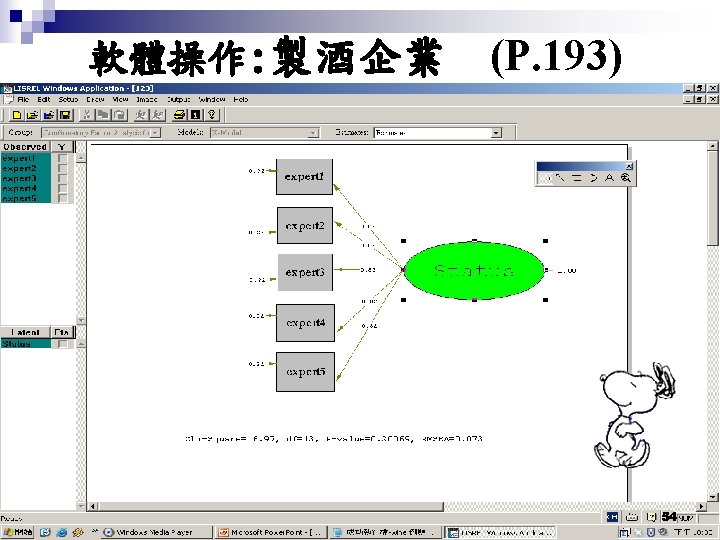
路徑圖:製酒企業(P. 193) status expert 1 expert 2 expert 3 δ 1 δ 2 δ 3 expert 4 expert 5 δ 4 δ 5 χ2、 GFI、AGFI、 RMR 52
軟體操作: 製酒企業 (P. 193) 指標變數 Title Confirmatory Factor Analysis for Wine Inc. - restricted model Observed Variables expert 1 expert 2 expert 3 expert 4 expert 5 Correlation Matrix= 1 0. 765 1 0. 678 0. 735 1 0. 675 0. 626 0. 632 1 0. 682 0. 766 0. 714 0. 517 1 Sample Size=59 Latent Variables Status Relationships: expert 1=Status expert 2=Status expert 3=Status expert 4=Status expert 5=Status SET the path from Status to expert 1 equal to the path from Status to expert 2 SET the path from Status to expert 2 equal to the path from Status to expert 3 SET the path from Status to expert 3 equal to the path from Status to expert 4 SET the path from Status to expert 4 equal to the path from Status to expert 5 Equal error variances: expert 1 expert 2 expert 3 expert 4 expert 5 Path Diagram LISREL OUTPUT SE TV RS MI 相關矩陣 潛伏變數 定義指標變數與 潛伏變數之關係 定義潛伏變數 之間的關係 輸出指令 SE: 標準誤 TV: t檢定 RS: 常態化殘差 53 MI: 修飾指標
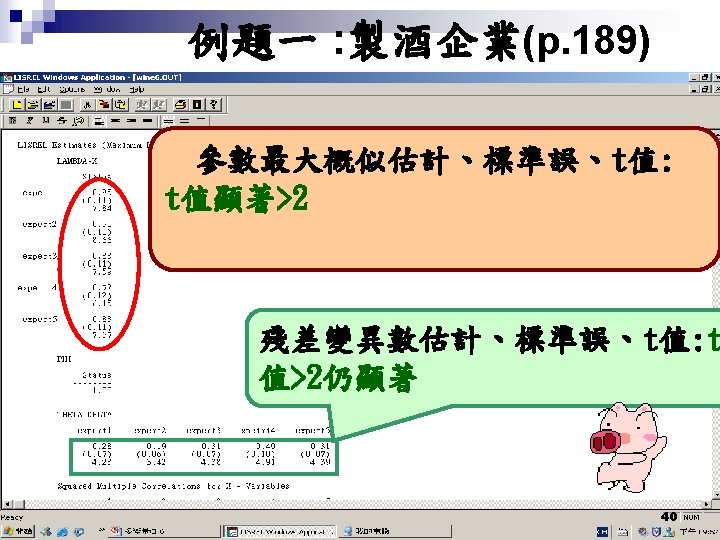
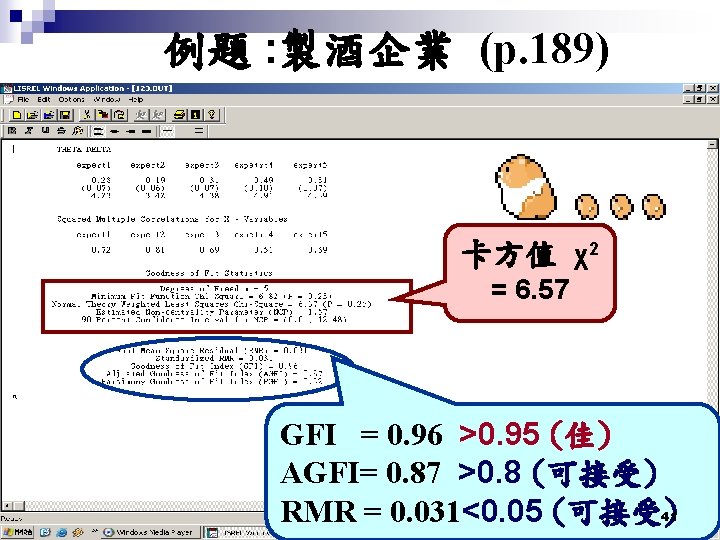
軟體操作: 製酒企業 (P. 193) 卡方值 GFI (acceptable)、 AGFI (acceptable)、 RMR 56
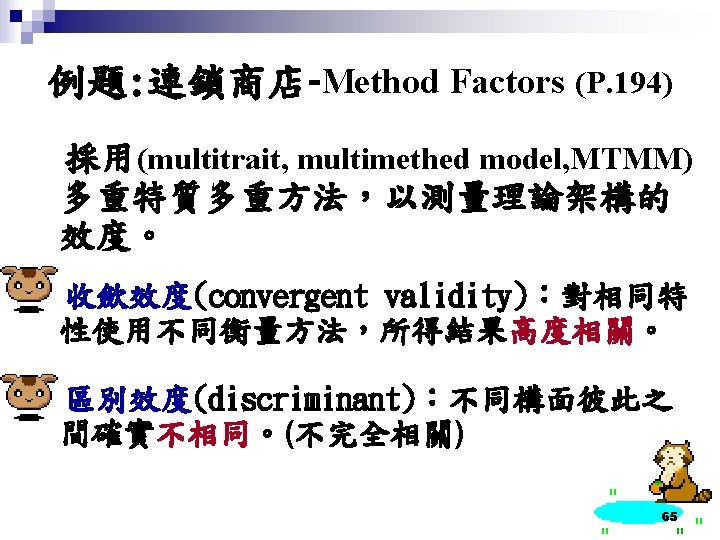
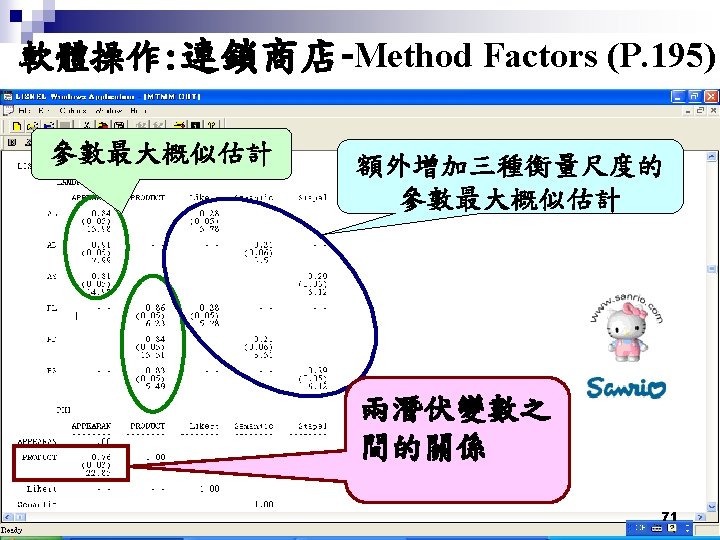
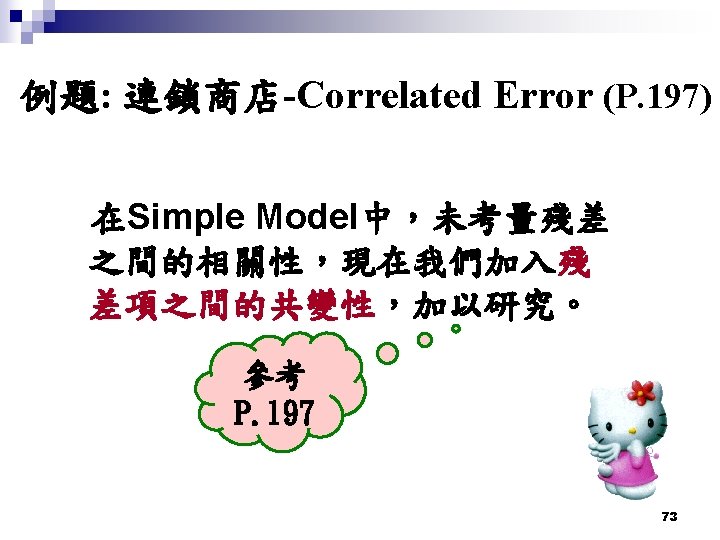
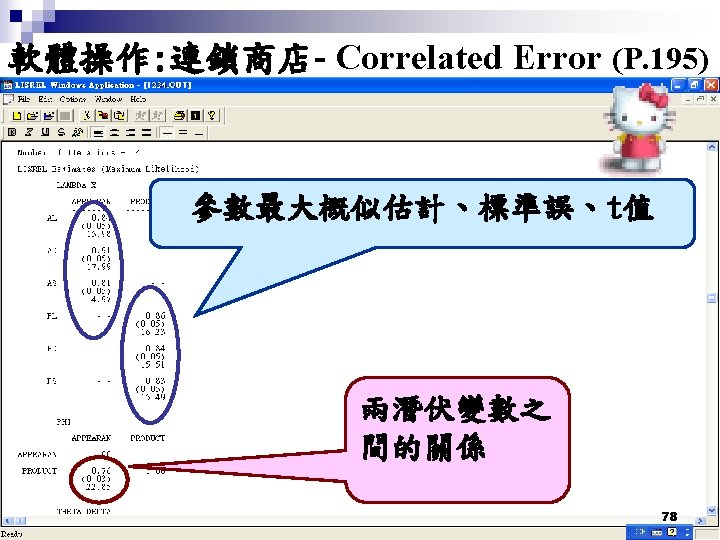
例題 : 連鎖商店 (p. 194) Menezes and Elber(1979)使用多重衡量方法,李 克尺度(Likert Scale)、語意差異尺度(Semantic differential Scale)、史德培尺度(Stapel Scale)評估 連鎖商店的商店外觀(store appearance)與產品多 樣化(product assortment)特徵,樣本來源為 250 位夜校學生。 樣本量 : 250 指標變數:AL、AD、AS、PL、PD、PS 潛伏變數:store appearance、product assortment 59
路徑圖:連鎖商店-Simple Model (P. 194) assortment appearance AL δ 1 AD δ 2 AS PL PD PS δ 3 δ 4 δ 5 δ 6 χ2、 GFI、AGFI、 60
軟體操作 : 連鎖商店- Simple Model 指標變數 Title Confirmatory Factor Analysis for Store Grocery- Simple model Observed Variables AL AD AS PL PD PS Correlation Matrix= 1. 000 0. 776 1. 000 0. 676 0. 739 1. 000 0. 638 0. 600 0. 539 1. 000 0. 561 0. 635 0. 527 0. 713 1. 000 0. 522 0. 559 0. 589 0. 720 0. 698 1. 000 Sample Size=250 Latent Variables APPEARANCE PRODUCT Relationships: AL=APPEARANCE AD=APPEARANCE AS=APPEARANCE PL=PRODUCT PD=PRODUCT PS=PRODUCT Path Diagram LISREL OUTPUT SE TV RS MI 相關矩陣 潛伏變數 定義指標變數與 潛伏變數之關係 輸出指令 SE: 標準誤 TV: t檢定 RS: 常態化殘差與Q圖 MI: 修飾指標 61
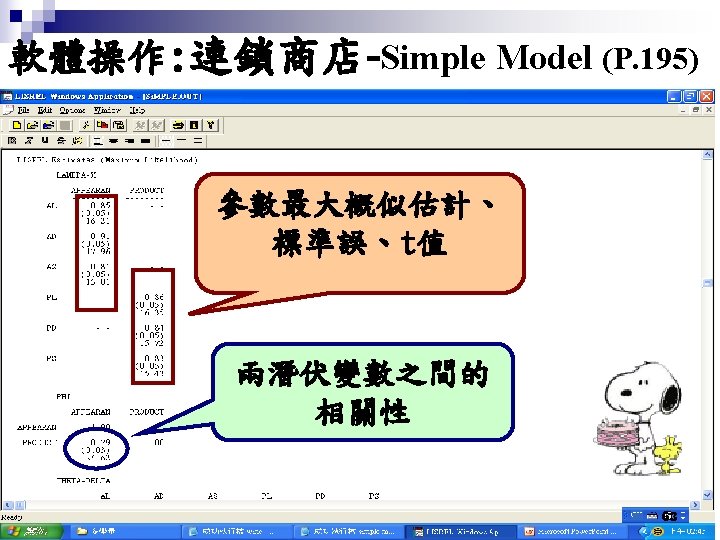
軟體操作: 連鎖商店- Simple Model (P. 195) 62
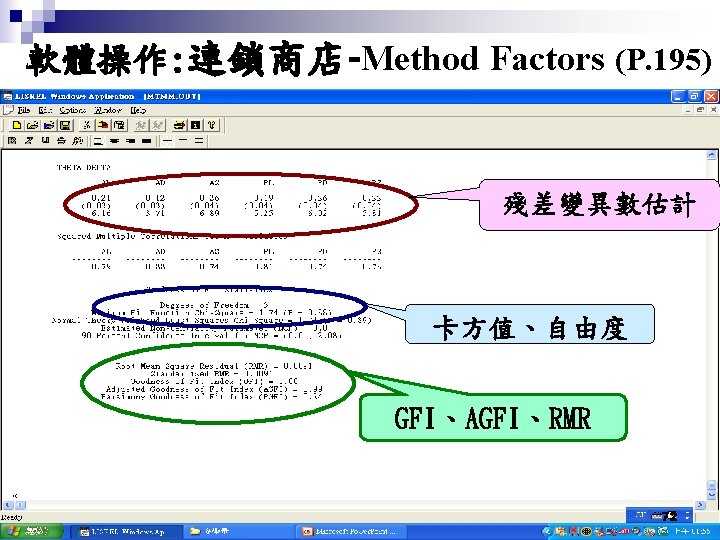
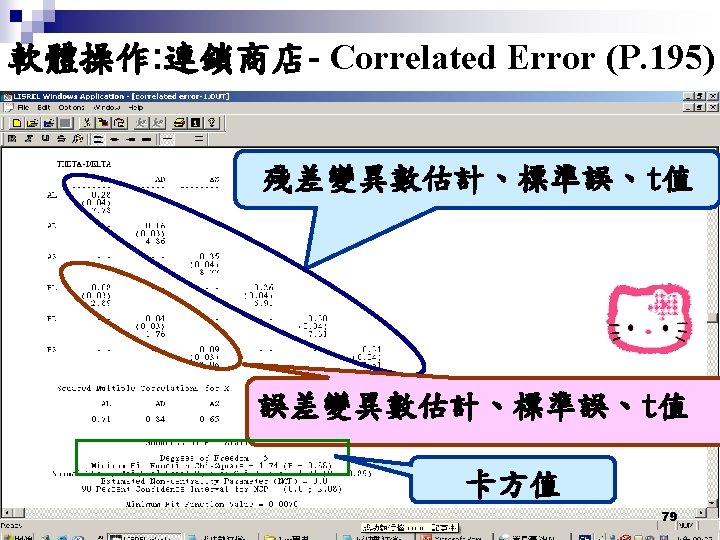
軟體操作: 連鎖商店- Simple Model (P. 195) 殘差變異數估計、 標準誤、t值 卡方值 GFI (good)、 AGFI (acceptable) 近似標準殘差矩陣 Asymptotically Standardized Residual Matrix 64
n n n 66
n 67
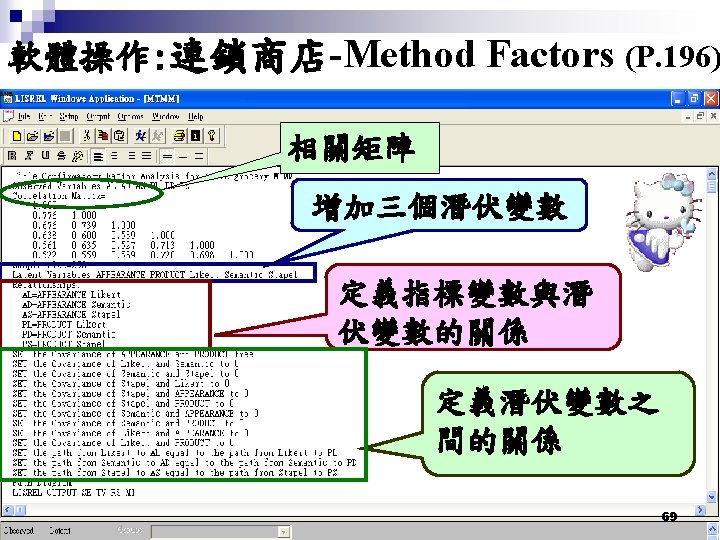
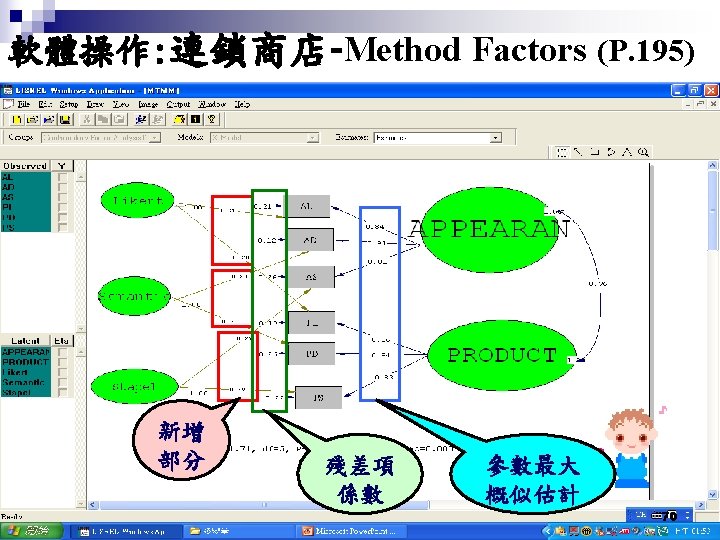
路徑圖:連鎖商店-Method product appearance AL AD Likert Factors(P. 197) AS PL Semantic differential PD PS (參p. 194) 考量方法因 素,使用相 同尺度衡量 不同因素。 Stapel χ2、 GFI、AGFI、 68
74
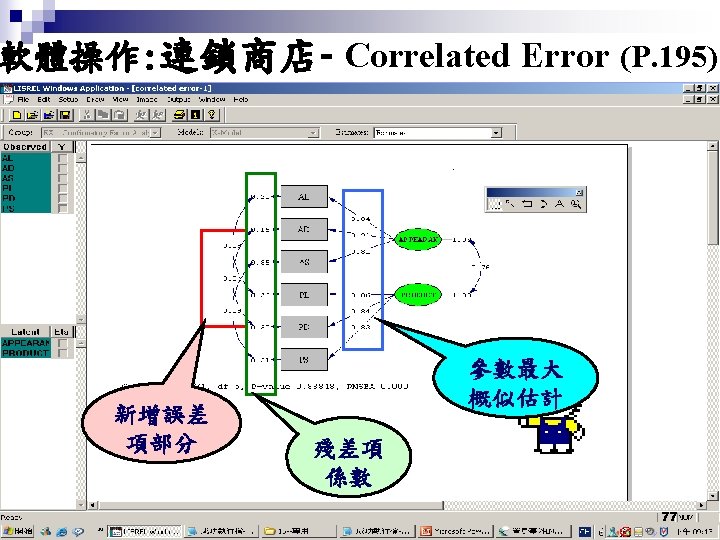
路徑圖:連鎖商店- Correlated Error (P. 198) product appearance AL δ 1 AD δ 2 加入殘差 項之間的 共變性 AS PL PD PS δ 3 δ 4 δ 5 δ 6 考量誤差項 75
軟體操作: 連鎖商店- Correlated Error Title EX 1: Confirmatory Factor Analysis for grocery store-correlated error Observed Variables AL AD AS PL PD PS Correlation Matrix= 1. 000 0. 776 1. 000 0. 676 0. 739 1. 000 0. 638 0. 600 0. 539 1. 000 0. 561 0. 635 0. 527 0. 713 1. 000 0. 522 0. 559 0. 589 0. 720 0. 698 1. 000 Sample Size=250 Latent Variables APPEARANCE PRODUCT Relationships: AL=APPEARANCE AD=APPEARANCE AS=APPEARANCE PL=PRODUCT PD=PRODUCT PS=PRODUCT SET the errors between AL and PL correlate SET the errors between AD and PD correlate SET the errors between AS and PS correlate Path Diagram LISREL OUTPUT SE TV RS MI 相關矩陣 對潛在變數進行標籤 定義指標變數與潛伏 變數的關係 定義殘差的關係 76
軟體操作: 連鎖商店- Correlated Error (P. 195) GFI(good)、 AGFI(good)、RMR 80
~ The End ~ 82