
NRCSE 2 Covariances Valid covariance functions The class

- Slides: 35
NRCSE 2. Covariances
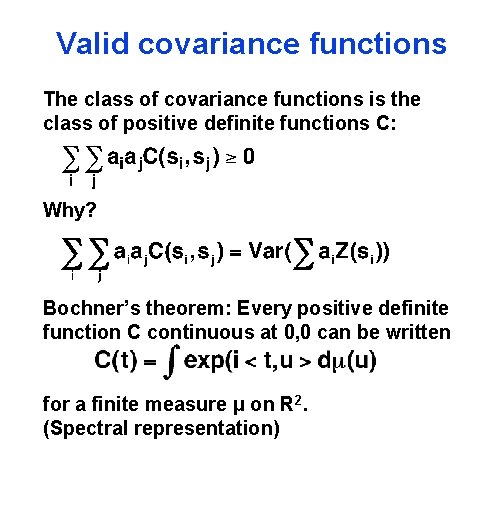
Valid covariance functions The class of covariance functions is the class of positive definite functions C: Why? Bochner’s theorem: Every positive definite function C continuous at 0, 0 can be written for a finite measure μ on R 2. (Spectral representation)
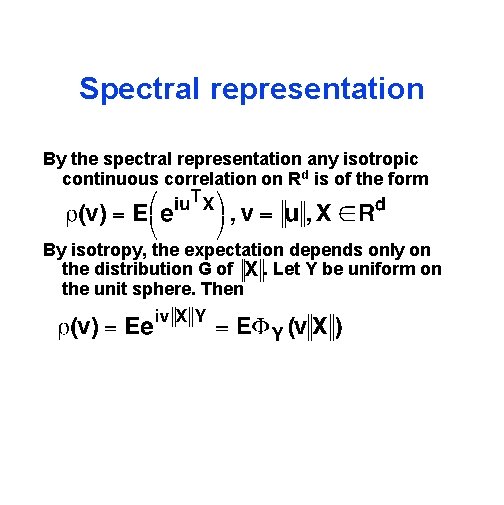
Spectral representation By the spectral representation any isotropic continuous correlation on Rd is of the form By isotropy, the expectation depends only on the distribution G of. Let Y be uniform on the unit sphere. Then
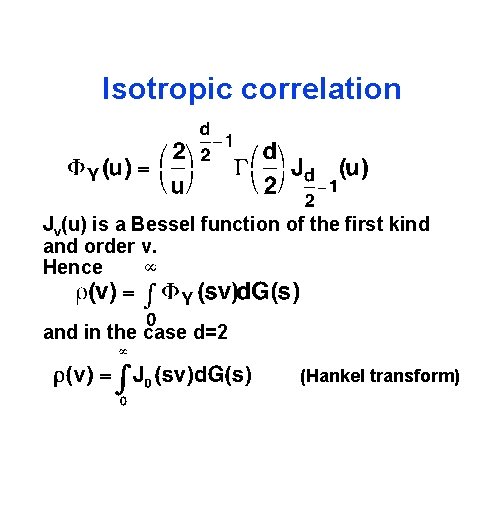
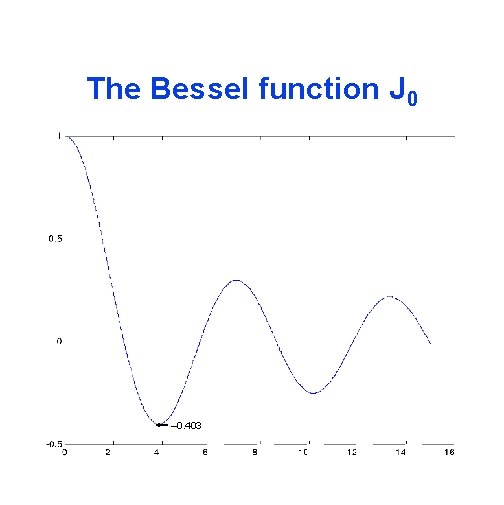
Isotropic correlation Jv(u) is a Bessel function of the first kind and order v. Hence and in the case d=2 (Hankel transform)
The Bessel function J 0 – 0. 403
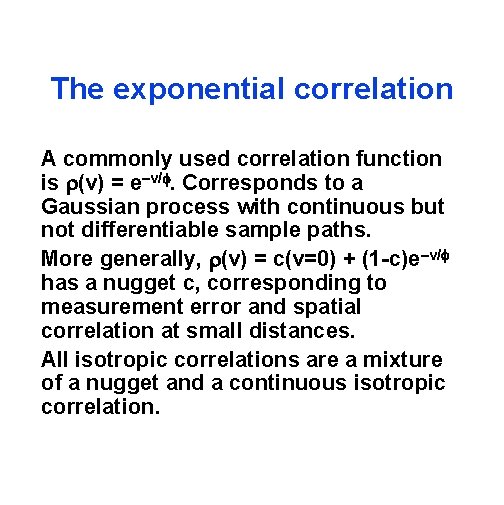
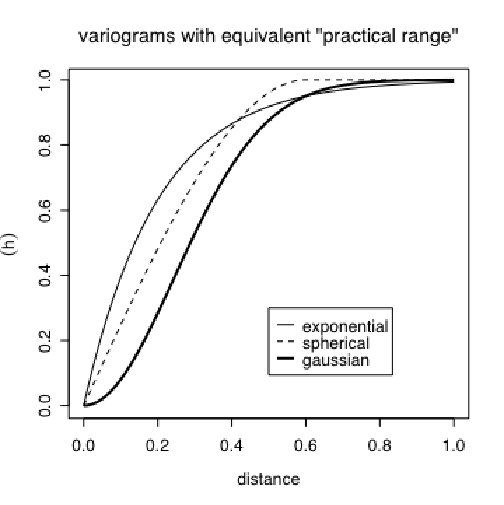
The exponential correlation A commonly used correlation function is (v) = e–v/. Corresponds to a Gaussian process with continuous but not differentiable sample paths. More generally, (v) = c(v=0) + (1 -c)e–v/ has a nugget c, corresponding to measurement error and spatial correlation at small distances. All isotropic correlations are a mixture of a nugget and a continuous isotropic correlation.
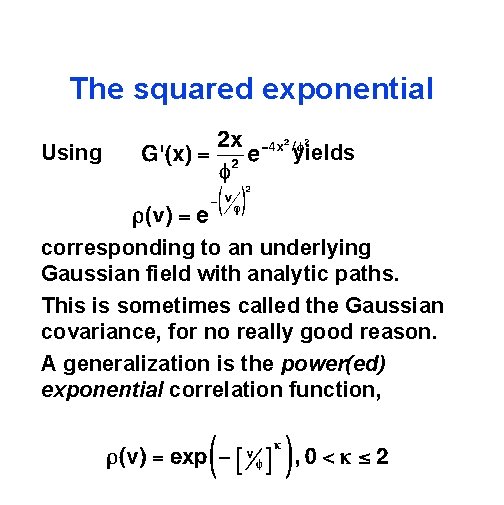
The squared exponential Using yields corresponding to an underlying Gaussian field with analytic paths. This is sometimes called the Gaussian covariance, for no really good reason. A generalization is the power(ed) exponential correlation function,
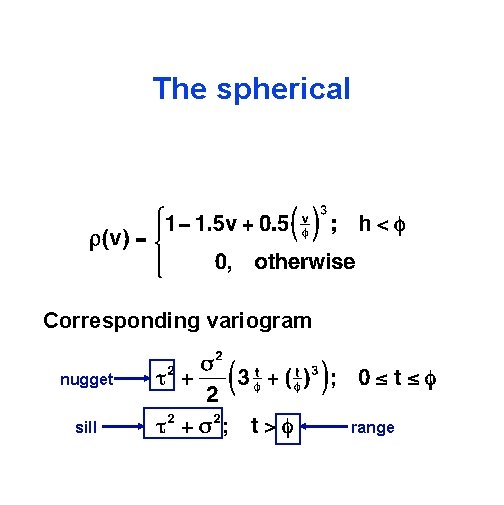
The spherical Corresponding variogram nugget sill range
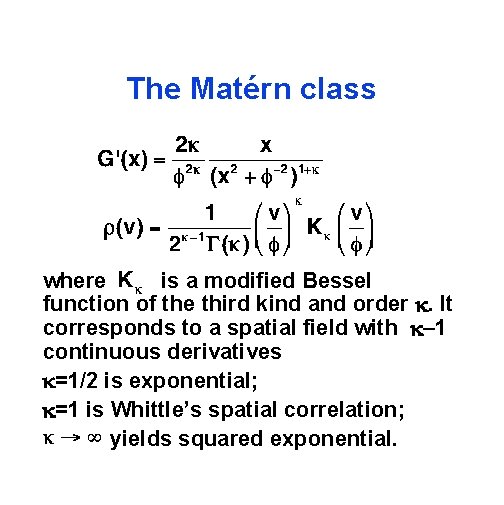
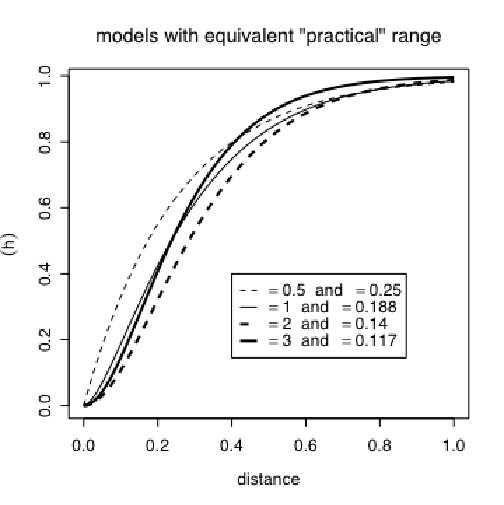
The Matérn class where is a modified Bessel function of the third kind and order . It corresponds to a spatial field with – 1 continuous derivatives =1/2 is exponential; =1 is Whittle’s spatial correlation; yields squared exponential.
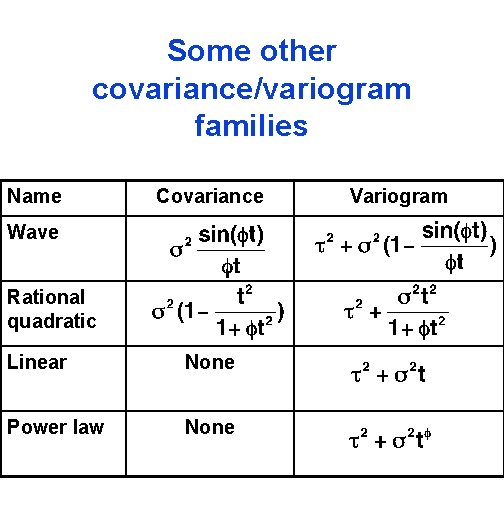
Some other covariance/variogram families Name Covariance Wave Rational quadratic Linear None Power law None Variogram
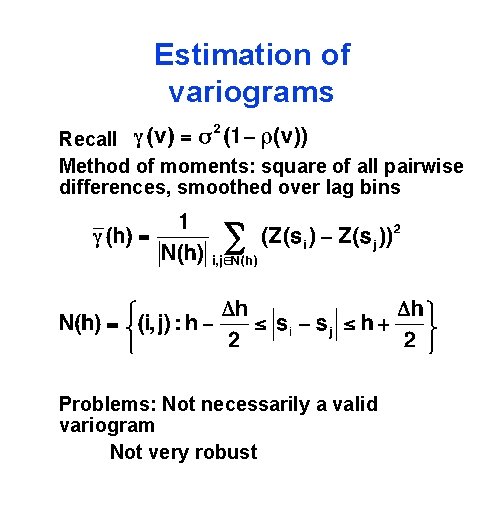
Estimation of variograms Recall Method of moments: square of all pairwise differences, smoothed over lag bins Problems: Not necessarily a valid variogram Not very robust
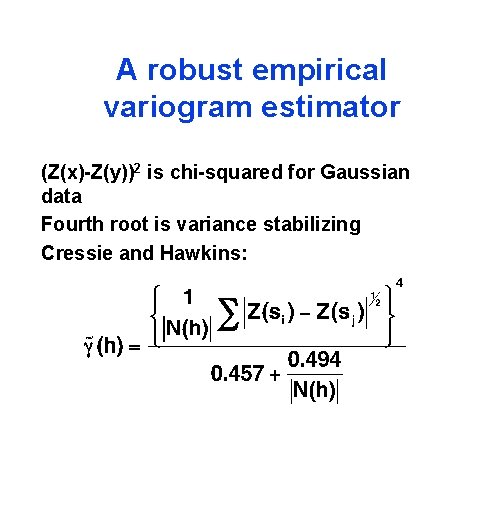
A robust empirical variogram estimator (Z(x)-Z(y))2 is chi-squared for Gaussian data Fourth root is variance stabilizing Cressie and Hawkins:
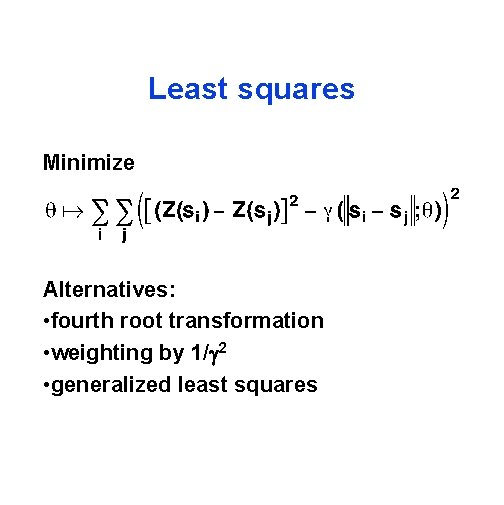
Least squares Minimize Alternatives: • fourth root transformation • weighting by 1/ 2 • generalized least squares
Maximum likelihood Z~Nn( , ) = [ (si-sj; )] = V( ) Maximize and maximizes the profile likelihood
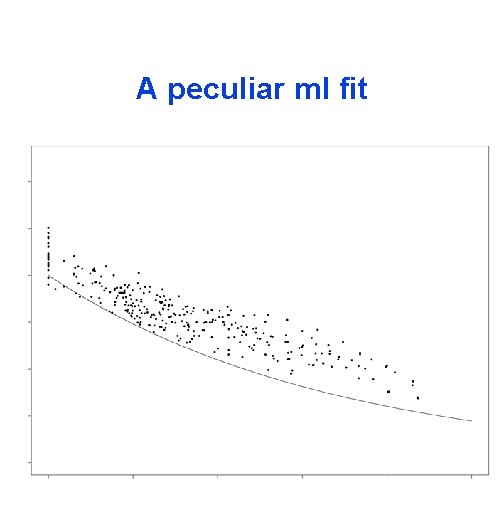
A peculiar ml fit
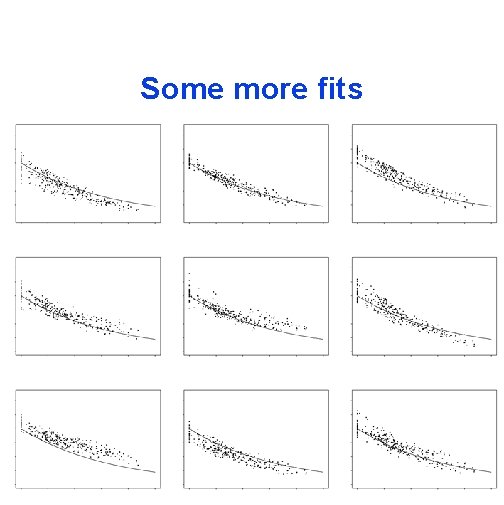
Some more fits
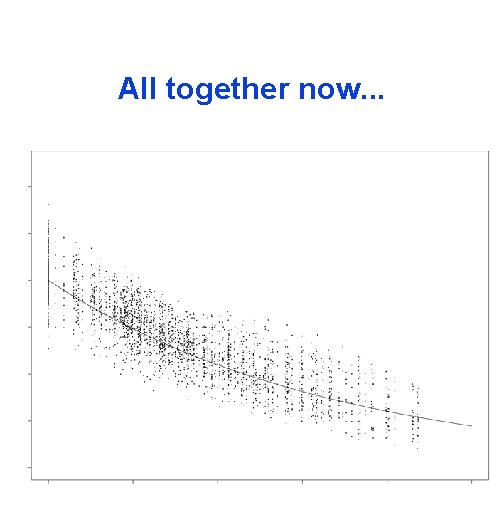
All together now. . .
Asymptotics Increasing domain asymptotics: let region of interest grow. Station density stays the same Bad estimation at short distances, but effectively independent blocks far apart Infill asymptotics: let station density grow, keeping region fixed. Good estimates at short distances. No effectively independent blocks, so technically trickier
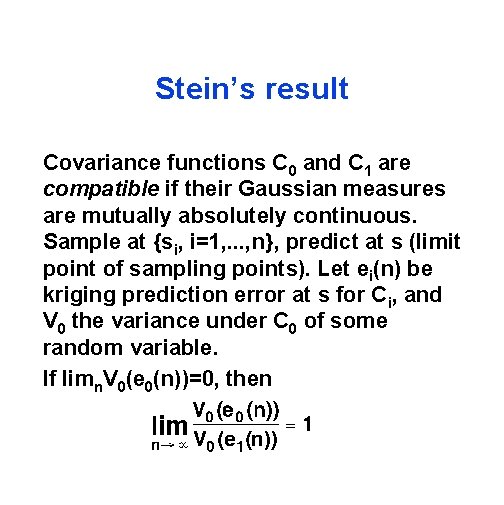
Stein’s result Covariance functions C 0 and C 1 are compatible if their Gaussian measures are mutually absolutely continuous. Sample at {si, i=1, . . . , n}, predict at s (limit point of sampling points). Let ei(n) be kriging prediction error at s for Ci, and V 0 the variance under C 0 of some random variable. If limn. V 0(e 0(n))=0, then
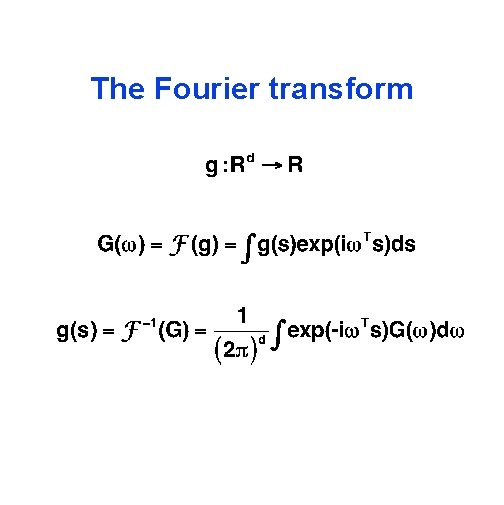
The Fourier transform
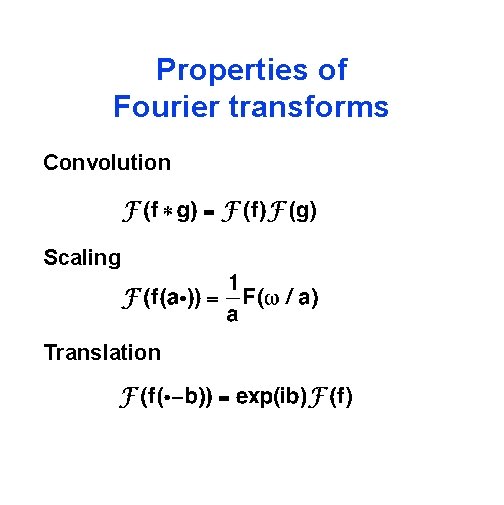
Properties of Fourier transforms Convolution Scaling Translation
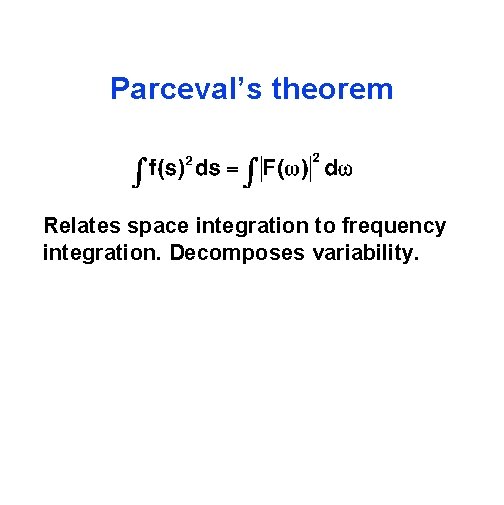
Parceval’s theorem Relates space integration to frequency integration. Decomposes variability.
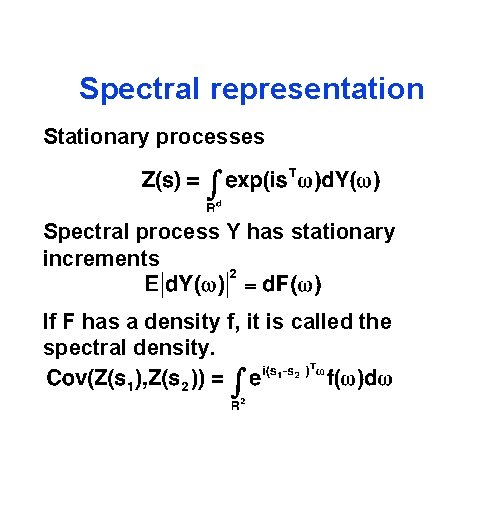
Spectral representation Stationary processes Spectral process Y has stationary increments If F has a density f, it is called the spectral density.
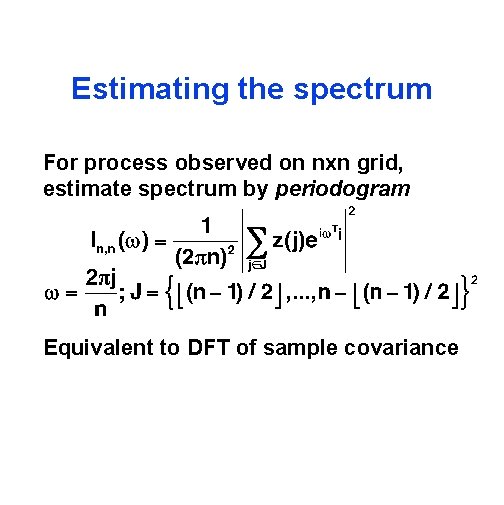
Estimating the spectrum For process observed on nxn grid, estimate spectrum by periodogram Equivalent to DFT of sample covariance
Properties of the periodogram Periodogram values at Fourier frequencies (j, k) are • uncorrelated • asymptotically unbiased • not consistent To get a consistent estimate of the spectrum, smooth over nearby frequencies
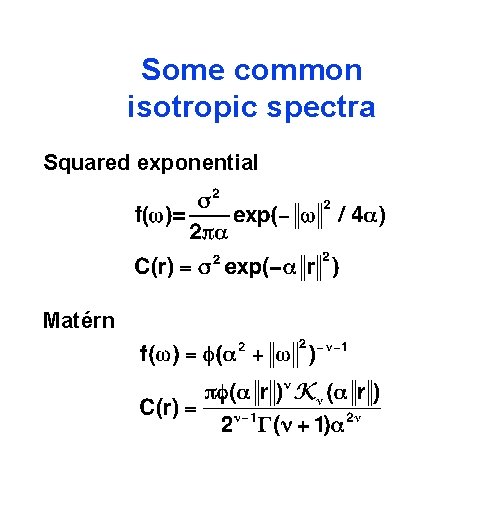
Some common isotropic spectra Squared exponential Matérn
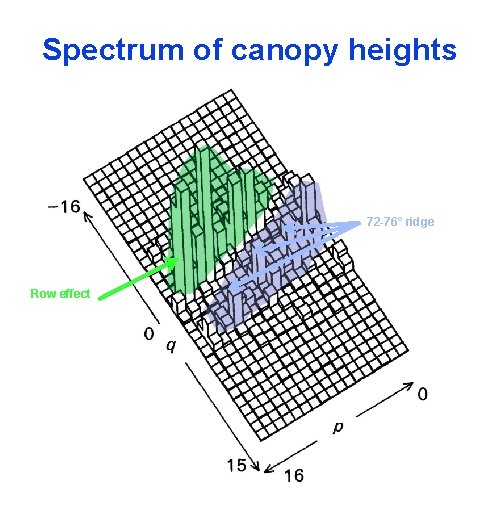
Thetford canopy heights 39 -year thinned commercial plantation of Scots pine in Thetford Forest, UK Density 1000 trees/ha 36 m x 120 m area surveyed for crown height Focus on 32 x 32 subset
Spectrum of canopy heights 72 -76° ridge Row effect
Correlation function
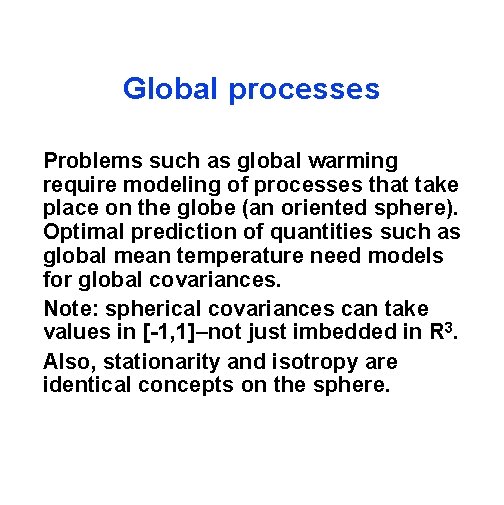
Global processes Problems such as global warming require modeling of processes that take place on the globe (an oriented sphere). Optimal prediction of quantities such as global mean temperature need models for global covariances. Note: spherical covariances can take values in [-1, 1]–not just imbedded in R 3. Also, stationarity and isotropy are identical concepts on the sphere.
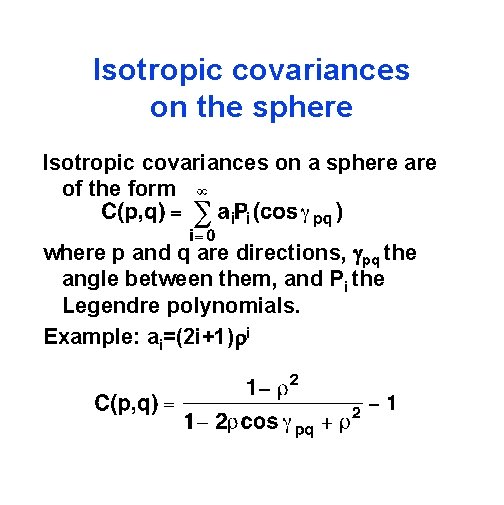
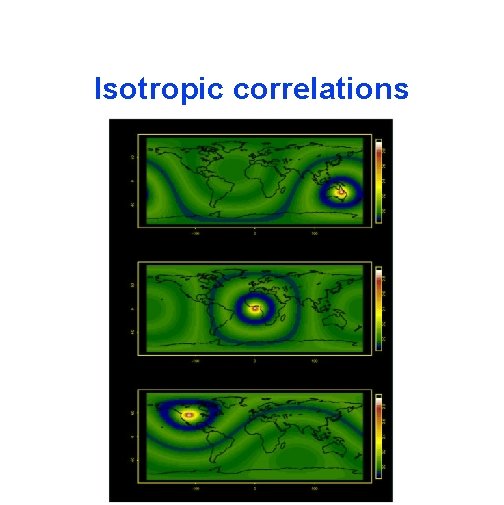
Isotropic covariances on the sphere Isotropic covariances on a sphere are of the form where p and q are directions, pq the angle between them, and Pi the Legendre polynomials. Example: ai=(2 i+1) i
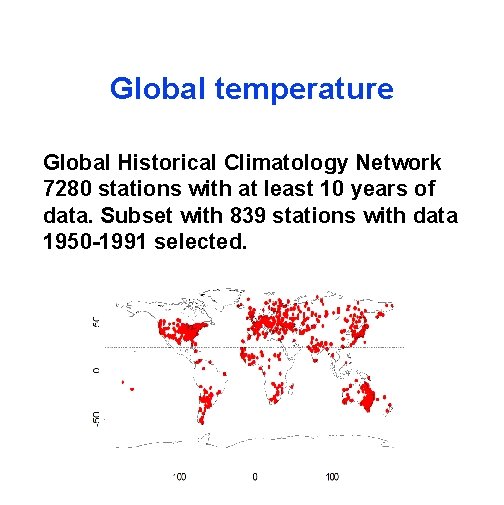
Global temperature Global Historical Climatology Network 7280 stations with at least 10 years of data. Subset with 839 stations with data 1950 -1991 selected.
Isotropic correlations