Advancing our understanding of risk assessment What is


 • First generation:")
: variation")

 for Sexual Recidivism")


 – Physical phenomena (not human behaviour)")


 •")
 – Direct protective: factors associated with lower levels")


 – Mann, Hanson,")
 Lived with a Lover Deviant Sexual Interests (-) Deviant PPG (+)")


 • Discrimination (a. k. a. relative risk)")


 Based on Helmus et al")
 Based on Hanson, Lloyd, Helmus")


 – Characteristics of the")
 differences between categories • Profile – Needs: Criminogenic & Non-criminogenic – Personal")


 Revised Category")
 Percentile Risk")


 • 111 reports for DO hearings (court or prosecution-appointed) •")
 • 2, 135 mental health professionals doing violence risk assessment")
 • 434 psychiatrists/psychologists (868 cases) • Most from US, Canada,")
 • Structured risk tools – Least likely for: competence (58%),")
 • Survey of American psychologists • Sex offenders: Static-99 most")
 • 95% use nominal risk categories • Actuarial scales –")
 • 109 experts using Static-99 R in SVP evaluations •")

. Predictive validity performance")
 • • • Sensitivity Specificity Positive predictive value Negative predictive")
 Diagnosis Correct! True positive Cancerous (Recidivism) (hit) Error! Not cancerous")
 – Proportion of recidivists correctly ‘diagnosed’ as recidivists")
 – Proportion of diagnosed recidivists that")

: odds of a TP relative")
 – Not appropriate for")


 • • • Sensitivity Specificity Positive predictive value Negative predictive")
; Wollert et al. (2010) • Unique LR for each")


/(Number Recidivists Observed) •")

 Helmus, Thornton et al. (2012) 112")


")
")
")


- Slides: 138
Advancing our understanding of risk assessment: What is it, what information does it provide, and how do we talk about its accuracy? L. Maaike Helmus Global Institute of Forensic Research Lmaaikehelmus@gmail. com Cle Ellum, Washington, March 4, 2016 WATSA
Overview • Nature of risk assessment • Nature of risk factors • What information is provided by risk scales? – Universal risk categories? – Do people even understand this information? • How do we assess the accuracy of risk scales? – Possible statistics (pros/cons) – My recommendations • How do we assess change? • Future directions
What is Risk Assessment?
Diagnosis vs Prognosis • Diagnosis – Detecting presence/absence of a condition • Dichotomous decision – True state of affairs currently exists • Prognosis – Predicting likelihood of an event in the future – No true state of affairs – Probabilistic
Diagnosis vs Prognosis • Different levels of certainty – Diagnosis: AUC of. 80 is ‘good’ – Prognosis: AUCs of. 71 and above are large effect sizes (Rice & Harris, 2005) – correspond to large Cohen’s d • Different ways of communicating risk – 40% chance of being pregnant versus 40% chance of survival following chemo
Risk Assessment is a task of Prognosis • Prediction about future event that may or may not occur • Risk is continuous dimension • Dichotomous predictions have no role in risk assessment (e. g. , ATSA, 2014) – Cumulative stochastic model
Warnings in Research Studies • Techniques borrowed from diagnostic field • Should it apply to risk assessment? – Similarities: Both examine dichotomous variable (diseased vs non-diseased; recidivist versus non-recidivist) – Differences: Classification versus Prediction. • Disease is existing state. Recidivism is future possibility.
Norm-Referenced Scales – Classical scale construction in psychology – Designed to measure varying amounts of a single construct (e. g. , intelligence, extroversion, psychopathy) • Factor analyses to better understand construct – Validity increases with more items assessing same construct
Criterion-Referenced Scales – Designed to predict an outcome. Goal: maximize accuracy – Often atheoretical – Measure as many diverse constructs as possible (incremental validity) • Items measuring the same construct considered inefficient – Antithetical to internal reliability – Factor structure difficult to detect
What is Risk Assessment? • Prognostic task • Measures continuous dimension • Criterion-referenced scale
Different Approaches to Risk Assessment
Generations of Risk Assessment (Bonta, 1996; Andrews et al. , 2006) • First generation: Unstructured clinical judgement • Second generation: Static actuarial • Third generation: Dynamic actuarial • Fourth generation: Dynamic actuarial case management/reassessment
Other Nuances • Where does SPJ fit in? – Andrews et al. (2006): variation of first generation – Items developed based on research, theory, OR clinical experience • What are mechanical vs actuarial scales? – Hanson & Morton-Bourgon (2009) – Actuarial: recidivism probability estimates linked to total scores, items empirically derived – Mechanical: no recidivism probabilities, items may be developed from theory
Types of Risk Assessment Type of Evaluation Factors Unstructured Clinical Judgement Empirical-Actuarial Structured Professional Judgement Mechanical SVR-20/HCR-20 (add items) SRA/STABLE-2000 ? Overall Recidivism Evaluation Estimates Professional Judgement Empirically Mechanical Derived Actuarial No Yes No Theory Professional Judgement Theory Mechanical No 14
Risk Scales: Accuracy for Sexual Recidivism Measures Designed d (95% CI) for Sexual Recidivism Empirical Actuarial . 67 (. 63 -. 72) N (k) Mechanical 24, 089 (81). 66 (. 58 -. 74) 5, 838 (29) Structured Judgement . 46 (. 29 -. 62) Unstructured . 42 (. 32 -. 51) 1, 131 (6) 6, 456 (11) 15 Hanson & Morton-Bourgon (2009)
Actuarial vs. Professional Judgment • Large literature: cognitive psychology, medicine, weather forecasts, forensic assessments • Actuarial outperforms professional judgement, but only under some conditions
Good expert performance • • • Weather forecasters Livestock & soil judges Astronomers Test pilots Physicists/mathematicians Chess masters Accountants Grain inspectors Insurance analysts Photo interpreters Poor expert performance • • • Clinical psychologists Psychiatrists Astrologers Student admissions evaluators Court judges Behavioural researchers Counsellors Personnel selectors Police officers Polygraph judges Stock brokers
When do experts outperform actuarials? • Shanteau (1992) – Physical phenomena (not human behaviour) – Non-unique tasks – When feedback is available – Environment tolerant of error • Kahneman & Klein (2011) – Environment highly regular (i. e. , predictable) – Expert has considerable practice – Timely feedback
What types of risk factors might be included in risk scales?
Static • • Historical/unchanging Most reliably documented Often scored quickly and easily Tend to be the most predictive
Dynamic • Stable – Stable personality characteristics – Change slowly (if at all) • Acute – Rapidly changing
Protective? • Losel & Farrington (2012) – Direct protective: factors associated with lower levels of violence – Buffering protective: interacts with risk factor to decrease its influence on recidivism • Farrington & Ttofi (2011) – Protective: basically buffering protective – Promotive: a bit more complicated. • Each factor has three levels: low, moderate, high
Risk and Promotive Factors
Protective/promotive • Promotive: Cannot establish without nonarbitrary scaling of low/moderate/high – Does not exist in our field • Protective – interaction can apply to risk factors as well – Interactions to reduce effect of another risk factor
Are static/dynamic/protective different constructs? • I’m not convinced they are • Protective can often be reversed and reframed as a risk factor (Harris & Rice, 2015)
Psychologically Meaningful Risk Factors • Risk-relevant propensity (personality characteristic, latent/underlying trait) – Mann, Hanson, & Thornton (2010) • Can be assessed with static, dynamic, or protective factors
Male Victims (+) Lived with a Lover Deviant Sexual Interests (-) Deviant PPG (+) Sexual Recidivism Total Prior Offences (+) Negative Attitudes Towards Supervision (+) Antisocial Orientation Employed (-)
Value added? • Yes. Incremental validity of static, dynamic, and protective factors • Does not mean they are different constructs • More comprehensive assessment of riskrelevant propensities
Other advantages to distinguishing types of risk factors • Clinical/conceptual – What can change, what can’t, positive psychology (strengths) • Types of information used – Static: criminal history info – Dynamic: interviews, detailed file review, specialized testing • More intensive
Brain Break!
What information is provided by risk assessment scales?
Information Provided by Risk Scales • Qualitative – Nominal risk categories • Quantitative – Percentiles – Risk ratios – Absolute recidivism estimates
Discrimination vs Calibration (Gail & Pfeiffer, 2005) • Discrimination (a. k. a. relative risk) – Offender’s risk relative to other offenders – Ranking offenders from highest risk to lowest risk – Percentiles, risk ratios • Calibration (a. k. a. absolute risk) – Expected probability of recidivism for a particular score 33
Percentiles – The commonness or unusualness of a particular score • Proportion expected to score higher; lower; the same • E. g. , “By the end of this presentation, you will learn that I score in the bottom 5% of researchers in terms of my ability to make graphs” – Ideal for norm-referenced constructs • intelligence, achievement motivation, ego strength, school grades, athletic competitions – By far the most commonly used metric in psychology • IQ scores, T-scores
Advantages of Percentiles • Easily understood • Easily calculated • Applies to all risk assessment procedures – Unstructured professional judgement, empirical actuarial, etc. • Sufficient for resource allocation decisions – Priority for treatment – Surveillance and Monitoring 35
Disadvantages of Percentiles • Risk tools are criterion referenced, not norm referenced • Percentile metric is unlikely to directly correspond to latent dimension of risk 36
Static-99 R scores and relative risk (log odds ratios) Based on Helmus et al K = 21; N = 5, 692 37
Static-99 R Percentiles and relative risk (log odds ratios) Based on Hanson, Lloyd, Helmus & Thornton (k = 4; n = 2, 011) 38
Risk Ratios – How different is this offender from the typical offender? – Can be describe using rate ratio, odds ratio, hazard ratio • This offender is 2. 5 times more likely to reoffend compared to the typical offender
Advantages of Risk Ratios • Meaningful reference category • Inform decisions – Resource allocation (e. g. , treatment or supervision intensity) • Risk scales are inherent measures of relative risk – Higher scores indicate greater risk, but how risky? • More stable than absolute recidivism rates • More information than percentile rank 40
Disadvantages of Risk Ratios • Cannot be interpreted in the absence of base rates – 2. 5 times more likely… than what? • 10% vs. 50% base rate • Expected recidivism rates (= risk ratio*Base rate) only matches absolute recidivism rates in certain instances – Low base rate samples • Hard to understand! (or unwilling? ) – Varela et al. (2014) 41
Absolute Risk • Expected probability of recidivism – E. g. , This offender scores a 4 on my risk scale. Other individuals with the same score have been found to violently reoffend at a rate of 27% over 5 years • Unique to actuarial risk scales
Advantages of Absolute Risk – Available for most of the commonly used actuarial scales (e. g. , Mn. SOST-R, LSI, VRAG/SORAG, Static-99 R) – Commonly reported in forensic reports – Easily understood – Criterion-referenced – Important in high-stakes contexts • Civil commitment in US • Dangerous offender hearings in Canada? 43
Disadvantages of Absolute Risk • Hard to specify! – Significant variability across samples (Helmus et al. , 2012) – Can change with differences across time, jurisdiction, policy – Requires explicit definition • Outcome • Length of follow-up
Nominal Risk Categories • “Low, ” “Moderate, ” “High” – Preferred by forensic evaluators and decision-makers – Link to action in specific setting • But what do they mean? – Inconsistent meanings • Evaluators use “Low” and “High” risk to mean different things • Infer different recidivism probabilities 45
Goal: Develop non-arbitrary meanings for risk categories
Risk Categories That Work • Describes people (not risk scales) – Characteristics of the offender (psychologically meaningful) • Tell us what to do – Linked to realistic options for action • Evidence-based, scientifically credible – Universal – applicable to all risk scales • Simple – Common Professional Language • Easy to implement – Can be done across jurisdictions/scales/offenders 47
Meaningful (perceptible) differences between categories • Profile – Needs: Criminogenic & Non-criminogenic – Personal and social resources – Life problems • Correctional Strategies & Responses – Human Services – Supervision – Custody • Outcomes – Base Rate of re-offending – Expected outcomes with appropriate services – Life course adjustment 48
Council of State Government Justice Center Standardized Risk Levels Level III Level IV Level V 49
Level I • Profile: – – Criminogenic needs: none or transitory Non-Criminogenic needs: none or transitory Resources: clearly identifiable personal and social resources Reoffending Base Rate: same as non-offender community at large (e. g. , <5%) • Sex offenders: similar to non-sex offenders committing a sex offence (< 2%) • Correctional Strategies: – Human services: unnecessary/ direct to social services if desired – Community Supervision: minimal as not necessary for compliance – Custody: counterproductive • Outcomes: – Short-term: No change in probability of re-offending – Life Course: Desistance 50
Level II • Profile: – Criminogenic needs: Few, if any, more acute than chronic. – Non-Criminogenic needs: Few if any, transitory and quick to respond – Resources: Clearly identifiable personal and social resources – Reoffending Base Rate: Higher than individuals without a criminal record but lower than typical offender • Correctional Strategies: – Human services: Brief interventions: social problem solving aided through existing community services. – Community Supervision: simple case management with minimal supervision for compliance – Custody: may be productive for crisis management but unnecessary long-term • Outcomes: – Short-term: Probability of re-offending reduces quickly to nonoffender levels (Level I) 51 – Life Course: Desistance (i. e. , one and done)
Level III • Profile: – Criminogenic needs: Some; may be severe in one or two discrete needs or less chronic/severe across multiple needs – Non-Criminogenic needs: Some; typical to offenders – Resources: Some identifiable personal and social resources, sporadic use – Reoffending Base Rate: Same as the average rate for offenders as a group • Correctional Strategies: – Human services: Structured services target criminogenic needs over months; (e. g. ~ 100 -200 hours of service); assist with non-criminogenic needs/responsivity factors. – Community Supervision: Change focused supervision with supervision for enhance engagement and compliance – Custody: may support short-term risk management • Outcomes – Short-term: Probability of re-offending can significantly ↓ with appropriate strategies BUT still higher than community at large (Level II) – Life Course: Expected involvement in crime over time but desistance possible over years 52
Level IV • Profile: – Criminogenic needs: Multiple; may be chronic in one or two discrete needs and moderate in others – Non-Criminogenic needs: Multiple, moderate to severe. – Resources: Few identifiable personal and social resources, sporadic prosocial use – Reoffending Base Rate: Higher than the rate of “typical” offender • Correctional Strategies: – Human services: Structured comprehensive services target multiple criminogenic needs over lengthy period with community follow-ups and supports (e. g. ~ 300+ hours of service); assist with non-criminogenic needs/responsivity factors. – Community Supervision: Intensive and change focused supervision with supervision for enhance engagement and compliance as well as risk management – Custody: may be productive for short-term risk management and beginning treatment • Outcomes: – Short-term: Probability of re-offending can ↓ with appropriate strategies BUT still “average” for offender population at large. – Life Course: Chronic offending rate shows gradual decline with appropriate services and time (i. e. , years/decades). 53
Level V • Profile: – Criminogenic needs: Multiple, chronic and entrenched – Non-Criminogenic needs: Multiple, moderate to severe – Resources: Few identifiable personal and social resources; use for procriminal pursuits – Reoffending Base Rate: 85% re-offending rate (Top 5% of offenders) • Not currently possible to empirically identify this group with sex offenders • Correctional Strategies: – Human services: Structured comprehensive services target multiple criminogenic needs over years ideally prior to community release (e. g. ~ 300+ hours of service); assist with non-criminogenic needs/responsivity factors – Community Supervision: Long-term supervision begins with intensive/risk management focus and gradual change to change focus (Level IV) with success over time – Custody: incapacitation for community safety , long-term change strategy starts with behavioral management • Outcomes – Short-term: Probability of re-offending still significantly higher than offender population even with appropriate long-term correctional strategies – Life Course: Chronic offending rate gradually declines over decades or advanced age, cascade within custody environments 54
Three Quantitative Indicators • Absolute recidivism rates – 5%, 85% reconvicted after 2 years • Percentile rank – median – middle risk level (50% score same or lower) • Risk Ratios – 1. 4 times as likely to reoffend as those in the middle of the risk distribution
Calculating Risk Categories 1 Requirement: Risk Scores & Recidivism of Population Recidivism 1. 00 Risk Scores Distribution Base Rate ~. 40 Median 0. 00
Calculating Risk Categories 2 Upper Boundary ~5% Recidivism Cat I Category I: Upper Boundary Category V: Lower Boundary ~85% Recidivism Cat V 1. 00 ~0. 85 ~0. 40 ~0. 05 0. 00 Category I: Risk Score Cutoff Category V: Risk Score Cutoff
Calculating Risk Categories 3 Category III: Boundaries = Appropriate Treatment Effect Size Odds Ratio: ± 1. 44 1. 00 ~0. 85 Cat III Cat IV Cat I ~0. 40 Cat V ~0. 05 0. 00 Category III: Risk Score Cutoffs
New STATIC risk categories • Currently, Static-99 R has 4 categories: – Low, Low-Moderate, Moderate-High, High • Static-2002 R has 5: – Low, Low-Moderate, Moderate. High, High • Standardize STATIC categories
I II IV-a IV-b Name Very Low Risk Below Average Risk Above Average Well Above Average Static-99 R Predicted Midpoint 5 -year Scores percentile Recidivism rate (%) Static-2002 R Scores Midpoint percentile Predicted 5 -year Recidivism rate (%) -3, -2 2. 8 0. 9 – 1. 3 -2, -1 2. 8 1. 0 – 1. 5 -1, 0 14. 8 1. 9 – 2. 8 0 , 1 13. 9 2. 2 – 3. 2 1, 2, 3 49. 1 3. 9 – 7. 9 2, 3, 4 46. 7 4. 6 – 9. 7 4, 5 83. 4 11. 0 – 15. 2 5, 6 81. 6 13. 8 – 19. 2 6 or more 96. 2 20. 5 – 53. 0 7 or more 96. 0 26. 0 – 53. 5
Comparison of Original and Revised STATIC categories Original Category Agreement: 51% (squares) Revised Category Agreement: 72% (shaded area)
Summary: Information Provided by Risk Scales • • • Total score (actuarial) Percentile Risk Ratio Recidivism Estimate (actuarial) Nominal Risk Category • Fuller picture of risk: Use multiple pieces of information
Do People Understand the Info Provided by Risk Scales?
Varela, J. G. , Boccaccini, M. T. , Cuervo, V. A. , Murrie, D. C. , & Clark, J. W. (2014). Same score, different message: Perceptions of offender risk depend on Static-99 R risk communication format. Law and Human Behavior, 38, 418 -427. doi: 10. 1037/lhb 0000073
Method • 211 adult community members called for jury duty • 2 -page document about case and Static 99 R • Manipulations: – Low score (1) versus high score (6) – Risk communication format • risk category (low vs. high) • risk ratio (three-fourths vs. 2. 9 times the recidivism rate of typical offender) • absolute recidivism estimate (9. 4% or 31. 2%)
Outcome Measure • Participants rated on scale of 1 to 6. • Low scores = lower perceived risk. – Likelihood of committing a new sex offence – Dangerousness to community members
Findings • When asked to make dichotomous decision, 95% of participants indicated that the offender would commit a new sex offence in the next 5 years
Findings • Whether participants rated the low risk offender as lower risk than the high risk offender depended on how the information was communicated – Nominal risk category: low risk offender given lower scores than high risk offender – Risk ratio: low risk offenders given nonsignificantly lower scores than high risk offender (p =. 12) – Absolute recidivism rate: low risk offenders given same score as high risk
Effect of Communication Metric • Score of 6 – Those who got the nominal risk category assigned a higher risk score than those who got a risk ratio or recidivism estimate • Score of 1 – Those who got the nominal risk category assigned the lowest scores, but not significantly lower than the other formats
Understanding of Risk Ratios • Message: His risk is 2. 9 times higher than recidivism rate of the typical sex offender – 85% said he was more likely to reoffend than the typical sex offender • Message: His risk is three-quarters the recidivism rate of the typical sex offender – 80% said he was more likely to reoffend than the typical sex offender
How Important/Difficult Were Static-99 R Results? • They were rated as more important for higher risk offenders – When the information was provided as nominal risk category or risk ratio • Those who read about low scoring offenders reported Static-99 R as more difficult to understand
User surveys: What are people using/liking/understanding?
Blais & Forth (2014) • 111 reports for DO hearings (court or prosecution-appointed) • Over 90% used actuarial scale; 53% SPJ • PCL-R used in over 95% of reports • Static-99 was most common risk scale (60%)
Singh et al. (2014) • 2, 135 mental health professionals doing violence risk assessment • Half from Europe, 21% from North America • Over 400 instruments used; roughly half developed for particular institution/setting • Most common: HCR-20, then PCL-R – Roughly half were SPJ, half actuarial
Neal & Grisso (2014) • 434 psychiatrists/psychologists (868 cases) • Most from US, Canada, Europe, Australia, New Zealand • Most common referrals: competence to stand trial, violence risk, sex offender risk, insanity, sentencing, disability, child custody, civil commitment, child protection, civil tort
Neal & Grisso (2014) • Structured risk tools – Least likely for: competence (58%), disability (66%), civil tort (67%) – Most likely for sex offender risk (97%), child protection (93%), and violence risk (89%) • Sex offender risk: Static-99 R/2002 R most common (66%), followed by PCL-R and personality assessments
Archer et al. (2006) • Survey of American psychologists • Sex offenders: Static-99 most common, followed closely by other scales (SVR-20) • Similar to findings by Jackson & Hess (2007; civil commitment) and Mc. Grath et al (2010; treatment)
Blais & Forth (2014) • 95% use nominal risk categories • Actuarial scales – ~66% report total score – 90% report recidivism estimate – 37% report percentile • SPJ – 24% report a total score
Chevalier et al. (2014) • 109 experts using Static-99 R in SVP evaluations • What do they report? – 83% report nominal risk categories – 83% report recidivism estimates – 35% report percentiles – 33% report risk ratios • What’s most important information? – 54% say recidivism estimates – 25% say nominal risk categories
How do we assess the accuracy of risk scales?
Possible Statistics That Could Be Used • Singh, J. P. (2013). Predictive validity performance indicators in violence risk assessment: A methodological primer. Behavioral Sciences and the Law, 31, 8 -22
Possible Statistics (Singh, 2013) • • • Sensitivity Specificity Positive predictive value Negative predictive value Number needed to detain Number safely discharged Diagnostic odds ratio Logistic odds ratio Point-biserial correlation AUC (Area under the curve)
Definitions Reality Cancerous (Recidivism) Diagnosis Correct! True positive Cancerous (Recidivism) (hit) Error! Not cancerous False negative (No recid) (miss) Not cancerous (No recid) Error! False positive (false alarm) Correct! True negative 84
Possible Statistics • Sensitivity – TP/(TP+FN) – Proportion of recidivists correctly ‘diagnosed’ as recidivists • Specificity – TN/(TN+FP) – Proportion of non-recidivists correctly ‘diagnosed’ as non-recidivists
Possible Statistics • Positive Predictive Value – TP/(TP+FP) – Proportion of diagnosed recidivists that actually did recidivate • Negative Predictive Value – TN/(TN+FN) – Proportion of diagnosed non-recidivists that actually did not recidivate
Possible Statistics • Number needed to detain – 1/PPV – Number of diagnosed recidivists we need to detain to prevent 1 act of recidivism • Number safely discharged – (1/(1 -NPV))-1 – Number of diagnosed non-recidivists we could discharge before a recidivism incident occurs
Possible Statistics • Diagnostic Odds ratio – Singh (2013): odds of a TP relative to the odds of a FP
Problems with These Statistics • Developed for diagnostic decisions (dichotomous) – Not appropriate for prognostic decisions – Inappropriate to use any risk scale to classify offenders as recidivists or nonrecidivists • ‘High risk’ is not synonymous with ‘Going to recidivate’ (may be less than 50%) – May just mean: this guy gets more intensive supervision
Problems with These Statistics • Base rates below 50% – If goal is to maximize TP and TN, you should predict “no” for all offenders – But what if low risk group has 4% recidivism rate and high risk group has 40% recidivism rate? • Meaningful info for risk management
Problems with These Statistics • PPV rates determined by overall base rate – Low base rate: Even with high AUC (>. 90), PPV rate will be low – Artificial ways to boost your PPV: choose more common outcome (violence instead of sex offence), increase follow-up • Makes scale look more accurate • Is it?
Possible Statistics • Log odds ratio – Expresses how log odds of recidivism increases with each one-point increase on the risk scale • Point-biserial correlation & AUC – Expresses how recidivism increases with higher risk scores
Log odds ratios • Log odds ratios – Can’t compare for scales with different range of scores – Increase in odds of recidivism for each onepoint increase in scale • Meaning of one point difference varies across scales (e. g. , Static-99 R vs PCL-R)
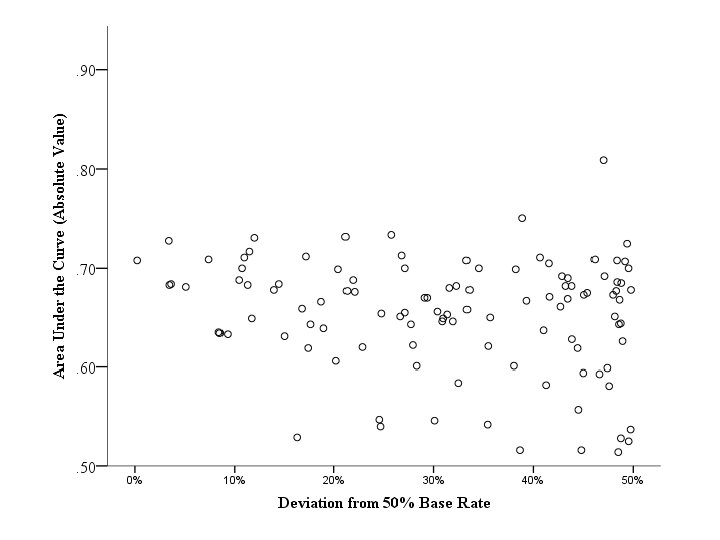
AUCs • Probability that a randomly selected recidivist has a higher risk score than a randomly selected non-recidivist • Varies between 0 and 1. – Below. 5 is negative accuracy (low risk more likely to reoffend) – Above. 5 is positive accuracy (high risk more likely to reoffend) • Values of. 56, . 64, and. 71 are low/moderate/high accuracy, respectively
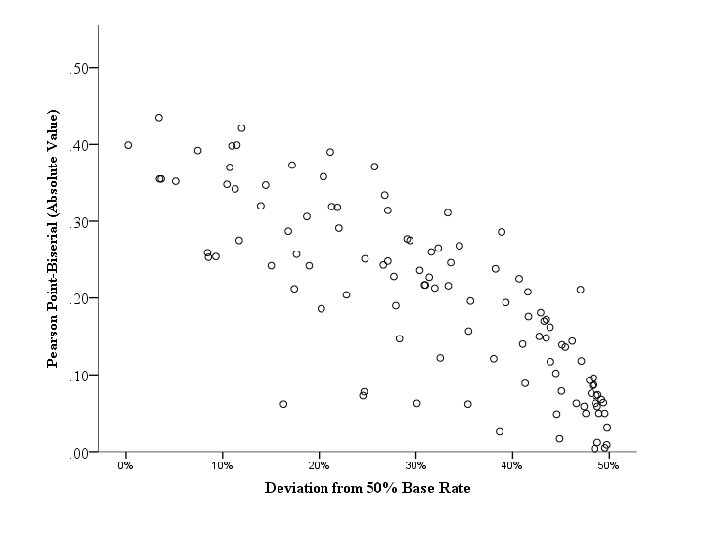
Point-biserial correlations • Ranges between -1 and +1 • Strongly influenced by recidivism rate • As base rate deviates from 50%, r gets smaller • If recidivism rate is 5% and the scale has perfect predictive accuracy, r will still be . 47 (Singh, 2013) – Traditionally, values of. 10, . 30, and. 50 are considered small/moderate/large
How much is the base rate going to impact my effect size? Babchishin, K. M. , & Helmus, L. M. (2015, Online First). The influence of base rates on correlations: An evaluation of proposed alternative effect sizes using real-world dichotomous data. Behavior Research Methods.
Possible Statistics (Singh, 2013) • • • Sensitivity Specificity Positive predictive value Negative predictive value Number needed to detain Number safely discharged Diagnostic odds ratio Logistic odds ratio Point-biserial correlation AUC (Area under the curve)
Likelihood ratios • Mossman (2006); Wollert et al. (2010) • Unique LR for each score on risk scale • Probability of having a particular risk score among recidivists divided by the probability of having that score among non-recidivists
Problems with Likelihood Ratios • Harris & Rice, 2007; Helmus & Thornton, 2014 • Intended for diagnosis tests, not prognosis • Meant to be invariant to base rate – Medical context: people who change from non -diseased to diseased change their symptoms – Offenders change from non-recidivist to recidivist without changing their initial risk score • Not stable across follow-up time, even in same study
Example: Likelihood ratios for each risk/age group on the MATS-1 scale at each year of follow-up (up to 15 years). Source: Helmus & Thornton, 2014
Problems with Likelihood ratios • Artificially affected by distribution of risk scores
Problems with Likelihood Ratios Risk Category N Recidivism N N nonrecidivists 2, 500 5, 000 2, 500 10, 000 5% 10% 125 500 375 1, 000 2, 375 4, 500 2, 125 9, 000 1, 000 4, 000 5, 000 10, 000 5% 10% 15% 12% 50 400 750 1, 200 950 3, 600 4, 250 8, 800 Sample 1 Low Moderate High Total Sample 2 Low Moderate High Total
Problems with Likelihood Ratios Risk Category N Recidivism N N non. Likelihood recidivists Ratios 2, 500 5, 000 2, 500 10, 000 5% 10% 125 500 375 1, 000 2, 375 4, 500 2, 125 9, 000 . 47 1. 00 1. 59 1, 000 4, 000 5, 000 10, 000 5% 10% 15% 12% 50 400 750 1, 200 950 3, 600 4, 250 8, 800 . 39. 81 1. 29 Sample 1 Low Moderate High Total Sample 2 Low Moderate High Total
Brain Break!
What Statistics Should we Report? • My recommendations
Relative Predictive Accuracy • To assess scale’s ability to discriminate between recidivists and non-recidivists – AUCs • Also: Harrell’s c – Risk ratios • Odds ratios from logistic regression • Hazard ratios from Cox regression
Evaluating Absolute Predictive Accuracy • Calibration • Ignored in offender recidivism prediction but well developed in other fields (e. g. , medicine) • To what extent do the observed values (O) correspond to the predicted values (E)? 109
Measure of Effect Size • ER/OR index – (Number Recidivists Expected)/(Number Recidivists Observed) • Poisson variance for the logarithm of the observed number of cases (OR): 110
Interpreting ER/OR • ER/OR = 1 – Number of recidivists matches predicted number • ER/OR < 1 – Scale underpredicted recidivism • ER/OR > 1 – Scale overpredicted recidivism • 95% CI does not include 1: significant difference between observed and expected recidivists 111
Recidivism Rates (5 years sex) Helmus, Thornton et al. (2012) 112
ER/OR index – 5 year sex recidivism Age group Static-99 R 20 s 0. 91 1. 03 30 s 0. 88 1. 01 40 s 1. 16 0. 93 50 s 1. 13 0. 91 60 s 3. 06** 1. 49 70 s 2. 41* 1. 20 113
Discussing Accuracy of Risk Scales • Consider both relative and absolute accuracy • Statistics from other fields are useful (e. g. , medicine) – Ensure your application matches context in which it was developed (e. g. , diagnosis vs. prognosis) • I like: – AUCs and/or risk ratios (odds ratio, hazard ratio) – E/O index 114
How Can We Assess Offender Change?
Assessing John • When John started his community supervision, his STABLE-2007 score was 9 • One year later, I have re-assessed the STABLE and he scores 4 • Has John changed?
Basic Data
Assessing Offender Change • Classical psychological assessment – Difference between multiple assessments is measurement error, not change • Need to demonstrate reliable change beyond measurement error
Question for Analyses of Change • How should we estimate a value (e. g. , for cooperation) at the time of recidivism? • Imputation essential because we will never have precise measurements before all recidivism events. • Time-invariant survival analysis (the standard) assumes that initial values remain unchanged throughout the followup period.
Imputation Option 1: Last is Best; Use Most Recent
Imputation Option 2: Linear: Impossible Results
Option 3: Average of Prior Assessments
Multiple Assessments
Imputation: Most Recent
Imputation: Moving Average (last 2)
Moving Average (last 3)
Moving Average (cumulative)
Arguments for Some Form of Average • Reliability < 1. 0 • Regression to the mean – low scores go up; high scores come down
Future Directions in Assessing Offender Change • What predicts best? – First assessment? – Last assessment? – Average assessment? – Weighted average? – Linear prediction? • Statistical analysis techniques – HLM – AIC/BIC for comparing non-nested models
Preview of Coming Attractions
Special Issue! • Criminal Justice and Behavior – Statistical Issues and Innovations in Predicting Recidivism • Edited by me and Kelly Babchishin
Absolute recidivism estimates • Hard to generate! • Shakiest of the risk communication metrics – But among most commonly reported • Greater research on stability across samples, identifying and incorporating sources of variability
Scale Quality: A Tale of Two States • Two field studies: • Texas – Static-99 AUC =. 57 (Boccaccini et al. 2009) – No information on training, experience, quality control • California – Static-99 R AUC >. 80 – Most rigorous training and certification we’ve seen
Quality of Implementation Matters! • We know on average, these risk factors predict • Need to demonstrate that you’re doing a reliable, high-quality job of assessing them • Indicators of risk assessment training and quality should be more routinely reported
Upcoming Field Studies of Static -99 R • Will be presented at ATSA 2016 – Texas –approx. 34, 000 offenders – British Columbia –approx. 4, 000 offenders – California – approx. 1, 500 offenders
Risk Communication • Is target audience understanding risk information? • Use of graphs, common language, reframing • Numeracy • See 2015 special issue of Behavioral Sciences and the Law
A glimpse in the future? Comprehensive risk assessment model Individual Factors Initial Assessment Environment Factors Offender Change Revised Assessment Environment Change
Thanks for your time! Contact: Lmaaikehelmus@gmail. com