Chapter Two Risk Concepts Risk and Risk Assessment


 Chapters 5, 6 Chapters 2,")


 A study of the potential of acrylonitrile to produce brain")

 and Reference Concentration (Rf. C) The Rf. D is defined")


, Weight of")
 The US EPA often use SARs when estimating hazard and")


 • Occupational Exposure- exposure to people in the workplace •")
 Multiple pathways are")


 Result: # excess cancers per")
- Slides: 36
Chapter Two Risk Concepts
Risk and Risk Assessment Risk: the probability that a substance or situation will produce harm under specific conditions. Risk is a combination of two factors: the probability that an adverse event will occur and the consequences of the adverse event. - The Presidential/Congressional Commission on Risk Assessment & Risk Management, Vol. 1, 1997. Risk assessment is a systematic, analytical method used to determine the probability of adverse effects. A common application is to evaluate human health and ecological impacts of chemical releases to the environment.
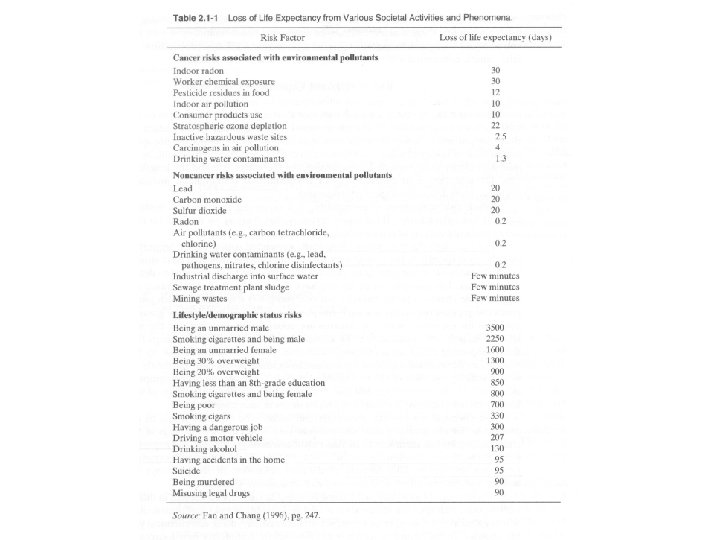
Risk Examples • What is the probability that certain types of cancer will develop in people exposed to benzene from gasoline? • What is the likelihood that workers exposed to lead will develop nervous system disorder? • Risk is normally formulated as the probability for an individual to suffer an adverse effect from an event.
Safety Assessment vs. Environmental Risk Assessment • From engineering perspective, it may be useful to think of risk as safety issues extrapolated from the present to the long term. That is, safety may be thought of as the likelihood of immediate adverse consequences, and environmental risk as the likelihood of long-term adverse consequences. • One important distinction between the environmental risk and conventional safety issues is that while the consequences of chemical accidents are readily linked to their causes, chronic exposures from chemicals often are not. • Any risk assessment should be carefully and fully documented, including specific references for data used and calculations used to reach a conclusion. This is due to the “volatility” of input data.
Risk Assessment: Introductory Concepts Risk = F(exposure x hazard) Chapters 5, 6 Chapters 2, 5 Steps in risk assessment » » Hazard assessment Exposure assessment Dose/response relationships Risk characterization
Hazard is the potential for a substance or situation to cause harm or create adverse impacts on person or the environment. The magnitude of the hazard reflects the potential adverse consequences, including mortality, shortened life-span, impairment of bodily function, sensitization to chemicals in the environment, or diminished ability to reproduce. For chemicals the term hazard is typically associated with the toxic properties of a chemical specific to the types of exposure.
Exposure denotes the magnitude and the length of time the organism is in contact with an environmental contaminant, including chemical, radiation, or biological contaminants. In this course, the exposure term will be for human exposure (ingestion, inhalation and dermal).
Hazard Assessment A chemical exposure hazard assessment answers the questions: What are the adverse health effects of a chemical? Under what conditions? The most common effects, or endpoints, studied are various kinds of cancers, but other types of adverse health effects such as endocrine disruption or reproductive toxicity are also currently being studied.
Cancer can be caused by two different types of chemical substances – genotoxic carcinogens and nongenotoxic carcinogens. Genotoxic chemicals are believed to have no threshold amount below which they will NOT cause cancer. Nongenotoxic carcinogens are believed to have a safe threshold quantity.
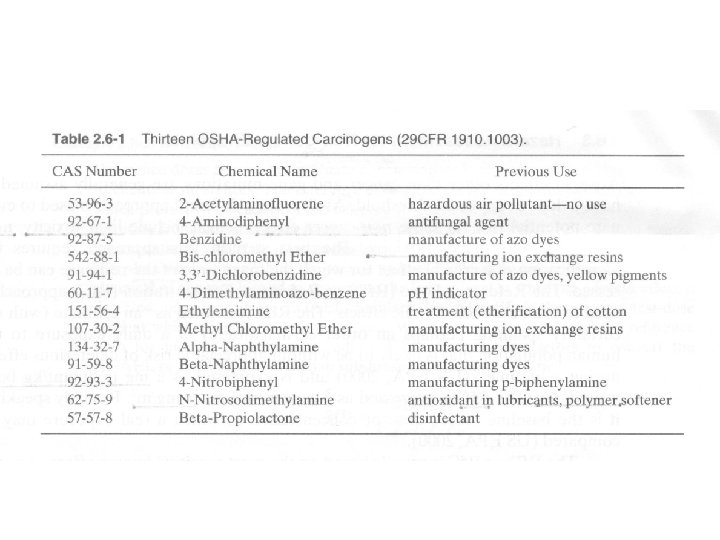
Hazard Assessment for Cancer US EPA guidelines: 1. 2. 3. 4. 5. 6. Group A: Carcinogenic to humans (20 chemical); Group B 1: Probably carcinogenic to humans based on limited human data; Group B 2: Probably carcinogenic to humans based on sufficient animal data, inadequate human evidence; Group C: Possibly carcinogenic to humans; Group D: Not classified for human carcinogenicity; Group E: Evidence for non-carcinogenicity for humans.
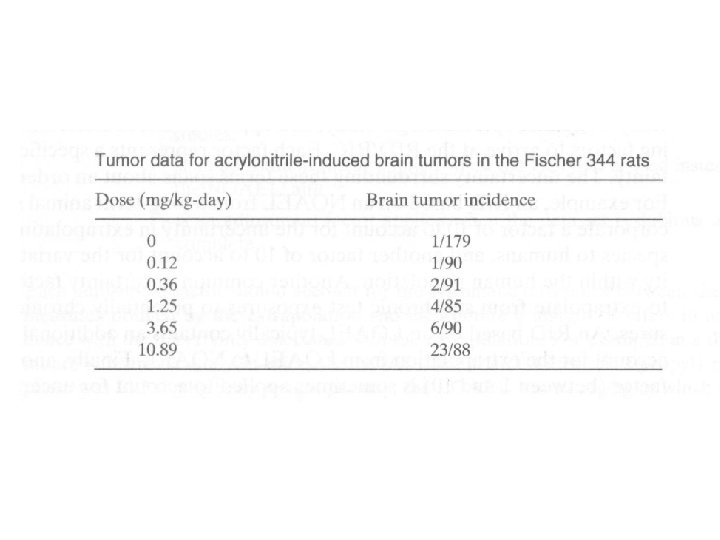
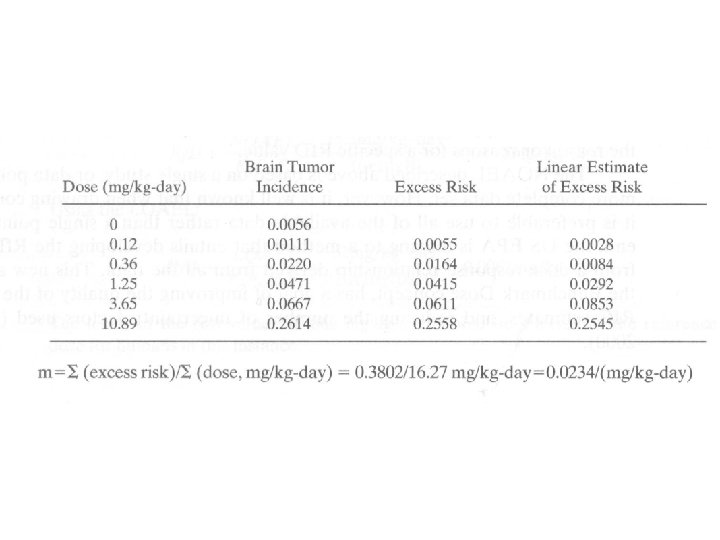
Cancer Slope Factor (Example) A study of the potential of acrylonitrile to produce brain tumors in Fischer 344 rats was conducted by administering the carcinogen in drinking water for 24 months. The results of the study for female rats are tabulated below:
Hazard Assessment for Non-Cancer Endpoints • Adverse effects other than cancer and gene mutations are generally assumed to have a dose or exposure threshold. • The 1 st step to evaluate potential risk for non-cancer effects requires identification of a critical effect for which the magnitude of the response can be assessed. • The Reference Dose (Rf. D) or Reference Concentration (Rf. C) approach is used to evaluate such chronic effects.
Reference Dose (Rf. D) and Reference Concentration (Rf. C) The Rf. D is defined as “an estimate of a daily exposure to the human population that is likely to be without appreciable risk of deleterious effects during a lifetime” (US EPA, 2000). It is expressed as mg pollutant/kg body weight/day. The Rf. C is expressed in mg per cubic meter. Either one of them can be interpreted as the baseline “safe” dose or concentration to which a real exposure may be compared.
Deriving Rf. D and Rf. C The basic approach involves 1. determining a “no-observed-adverse-effect level (NOAEL)” or “lowest-observedadverse-effect level (LOAEL)” from an appropriate animal study or human epidemiologic study, and 2. applying various uncertainty and modifying factors to arrive at Rf. D and Rf. C.
Uncertainty Factors An Rf. D based on NOAEL from long-term animal study might incorporate (1) a factor of 10 to account for the uncertainty in extrapolating from the test species to humans, (2) a factor of 10 to account for the variation in sensitivity within the human population, and (3) a factor of 10 to extrapolate from subchronic test exposures to potentially chronic human exposures. An Rf. D based on LOAEL typically contains an additional factor of 10 to account for the extrapolation from LOAEL to NOAEL. Another modifying factor is sometimes applied to account for uncertainties in data quality. The combination of these uncertainty factors can result in highly conservative interpretations.
Rf. D Formula
Example In a 3 -month subchronic study in mice, the NOAEL for tris (1, 3 -dichloro-2 -propyl) phosphate was 15. 3 mg/kg body weight/day; the LOAEL was 62 mg/kg body weight/day at which dose abnormal liver effects were noted. Based on NOAEL Based on LOAEL
Hazard Assessment Indicators of chemical toxicology Carcinogenic effects - Slope Factor (SF), Weight of Evidence (WOE) classification Noncarcinogenic effects - No Observable Adverse Effects Level (NOAEL), Reference Dose (Rf. D), Reference Concentration (Rf. C), Permissible Exposure Limit (PEL), Threshold Limit Value (TLV) Sources of Data for Health Effects 1. The Material Safety Data Sheet - MSDS 2. NIOSH Pocket Guide to Chemical Hazards (www. cdc. gov/niosh. npg/gpdstart. html) 3. Integrated Risk Information System (IRIS) (http: //www. epa. gov/ngispgm 3/iris/index. html) 4. National Library of Medicine (Tox. Net) (http: //sis. nlm. nih. gov/sis 1) 5. Casarett and Doull’s “Toxicology, the Basic Science of Poisons”, Macmillan 6. Patty’s Industrial Hygiene and Toxicology, John Wiley & Sons
Structure Activity Relationships (SAR) The US EPA often use SARs when estimating hazard and other elements of risk. SARs estimate hazards by drawing analogies with chemically similar substances (a structural analog) whose hazard has already been studied. Structural activity is defined as the relationship between the structural property of a molecule and its biological activity (health effects).
Dose Response Curve How large a dose causes what kind of effect? Effective Dose (reversible) Toxic Dose (irreversible) Lethal Dose Crowl and Louvar, Chemical Process Safety: Fundamentals with Applications, Prentice Hall, 1990
Dose-Response • This analysis enables risk assessors to estimate a “safe” dose. • For a given chemical, there is a separate curve for each adverse effect. • The outcome of the overall dose-response effort helps tell the assessor what the toxicological endpoint of concern is. • The dose-response study also provides the NOAEL. • For cancer, dose-response analysis is appropriate for Group A and B substances. Fewer than 10% of the 80000 or so chemicals in commerce currently have doseresponse curves.
Concerns of Dose-Response Analysis 1. Different species may have different responses. 2. Very high doses, to the point of acute poisoning of the test animal, are sometimes necessary to generate a statistically significant effect. 3. Since it may take a long time for cancers to be detected in laboratory animals, some otherwise well -designed experiments may have been too brief. 4. The route of exposure can also affect the outcomes of an analysis.
Exposure Assessment • The amount of a substance that comes into contact with the external boundaries of a person is called exposure. • The quantity that crosses the external boundary is defined as dose and the amount absorbed is the internal dose. • The ratio of the internal dose to exposure is called bioavailability of the substance.
Exposure Routes
Exposure Routes • Most dermal exposures result from hand contact and may occur while performing common worker activities such as sampling, drumming, filter changing, and maintenance. (Bioavailability: 5%) • Inhalation exposure may be in the form of vapors, aerosols, or solid particulates. Exposure to vapor may occur due to vapors generated during activities such as drumming and sampling, or from fugitive emissions from small process leaks (Close to 100% bioavailability). • Ingestion and percutaneous exposure (injection through the skin) are not usually of interest.
Exposure Assessment 1. The preferred approach is to use personal monitoring data for the chemical of interest at the site. 2. Monitoring data for the chemical at sites with similar operations. 3. Data for a surrogate chemical. 4. Mass balance model 5. Biomarker
Exposure Assessment (Ch 6) • Occupational Exposure- exposure to people in the workplace • Community Exposure- exposure outside the workplace Different modeling approaches and assumptions Exposure Assessment Methodology - Community Exposure 1. Identify all waste stream components and concentrations 2. Estimate release rates to the air, water, and soil 3. Choose proper exposure pathways (through environment) and routes (into humans) 4. Determine exposure concentrations at the point of exposure to humans using measurements or an environmental fate and transport model
Exposure Assessment Exposure Routes 1. Inhalation 2. Ingestion 3. Dermal (skin) Multiple pathways are possible
Exposure assessment - H 2 S release example Atmospheric dispersion Model, Ca x = 300 m H=0 m Q = 0. 025 kg/s H 2 S Rural release, daytime neutral atmosphere, x<500 m, vx=4 m/s sysz = 0. 01082 x 1. 78 Rural release, nighttime stable atmosphere, x<500 m , vx=2. 5 m/s sysz = 0. 0049 x 1. 66
Risk Characterization of Cancer Risk is defined as the probability of developing cancer (in excess of the background cancer level) from a particular chemical is a subpopulation is exposed to that chemical over a lifetime.
Risk Characterization of Non. Cancer Endpoint
Module 1: Risk Characterization Carcinogenic Risk Example (inhalation route) Result: # excess cancers per 106 cases in the population; 10 -4 to 10 -6 acceptable Exposure Dose (mg/kg/d) Dose - Response Relationship, Slope Factor (mg/kg/d)-1 Exposure Factors CR = contact rate (m 3 air breathed / day) EF = exposure frequency (days / yr) ED = exposure duration (yr) BW = body weight (kg) AT = averaging time (days) - 25, 550 days for carcinogenic risk