
OVERVIEW OF RISK ASSESSMENT Requirements in the Directive





- Slides: 71
OVERVIEW OF RISK ASSESSMENT
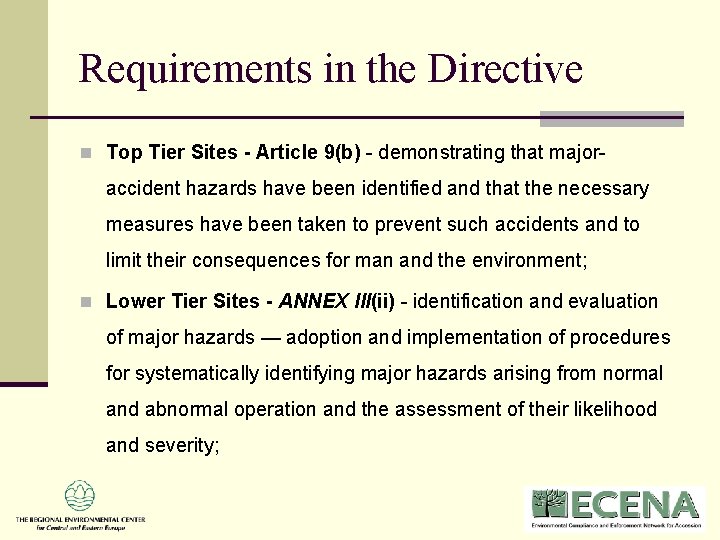
Requirements in the Directive n Top Tier Sites - Article 9(b) - demonstrating that major- accident hazards have been identified and that the necessary measures have been taken to prevent such accidents and to limit their consequences for man and the environment; n Lower Tier Sites - ANNEX III(ii) - identification and evaluation of major hazards — adoption and implementation of procedures for systematically identifying major hazards arising from normal and abnormal operation and the assessment of their likelihood and severity;
Definition of Hazard and Risk n Hazard: the property of a substance or situation with the potential for creating damage n Risk: the likelihood of a specific effect within a specified period n complex function of probability, consequences and vulnerability
Risk Assessment Risk assessment and risk analysis of technical systems can be defined as a set of systematic methods to: n Identify hazards n Quantify risks n Determine components, safety measures and/or human interventions important for plant safety
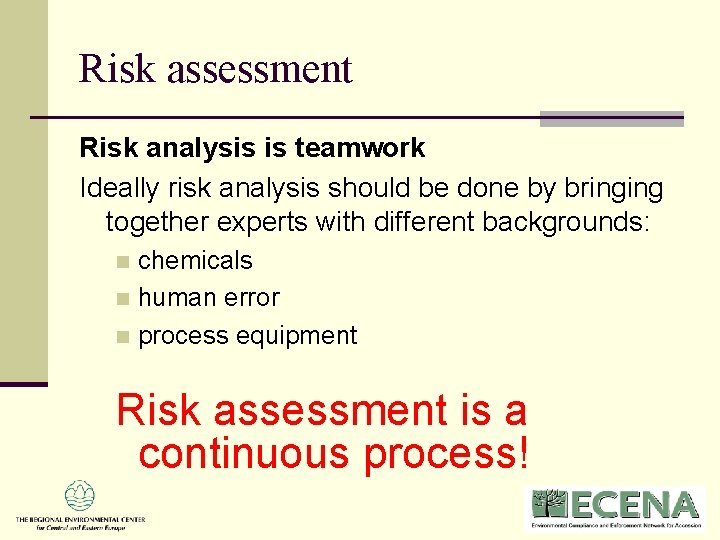
Risk assessment Risk analysis is teamwork Ideally risk analysis should be done by bringing together experts with different backgrounds: chemicals n human error n process equipment n Risk assessment is a continuous process!
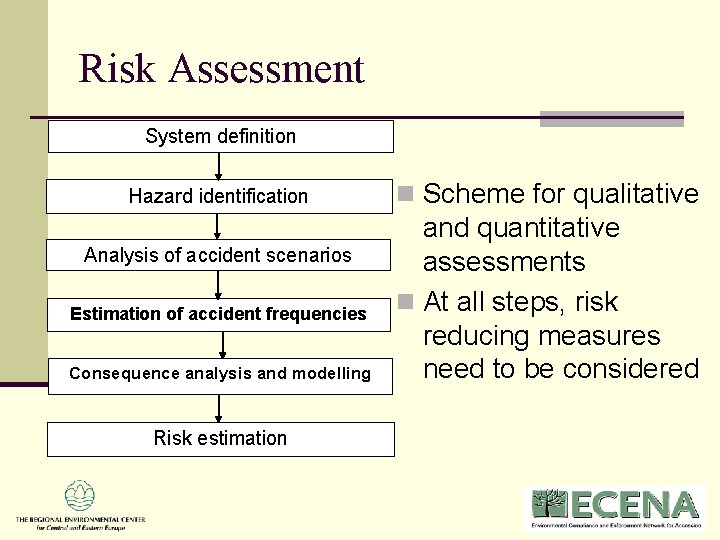
Risk Assessment System definition Hazard identification Analysis of accident scenarios Estimation of accident frequencies Consequence analysis and modelling Risk estimation n Scheme for qualitative and quantitative assessments n At all steps, risk reducing measures need to be considered
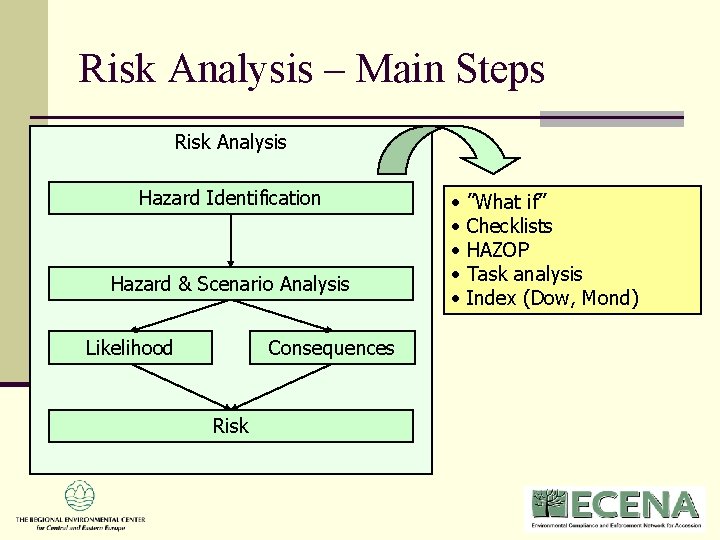
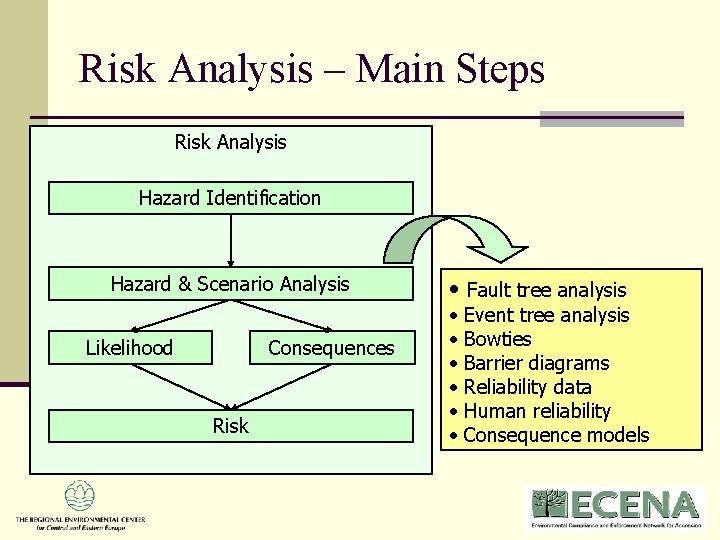
Risk Analysis – Main Steps Risk Analysis Hazard Identification Hazard & Scenario Analysis Likelihood Consequences Risk • • • ”What if” Checklists HAZOP Task analysis Index (Dow, Mond)
Risk Analysis – Main Steps Risk Analysis Hazard Identification Hazard & Scenario Analysis Likelihood Consequences Risk • Fault tree analysis • • • Event tree analysis Bowties Barrier diagrams Reliability data Human reliability Consequence models
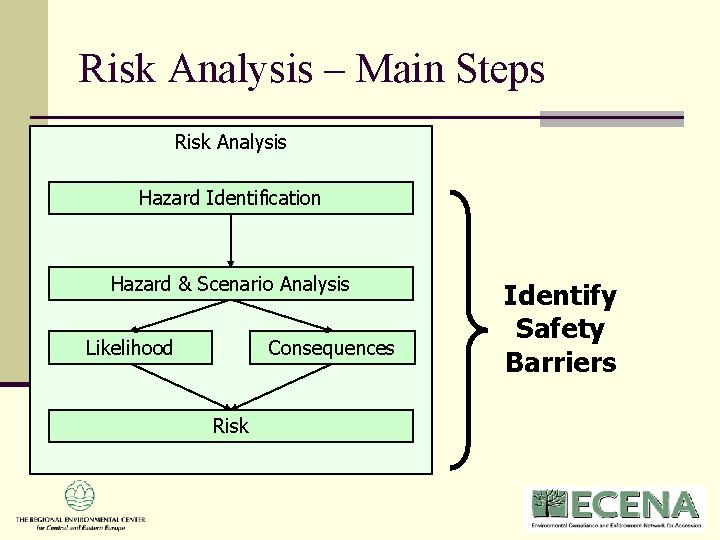
Risk Analysis – Main Steps Risk Analysis Hazard Identification Hazard & Scenario Analysis Likelihood Consequences Risk Identify Safety Barriers
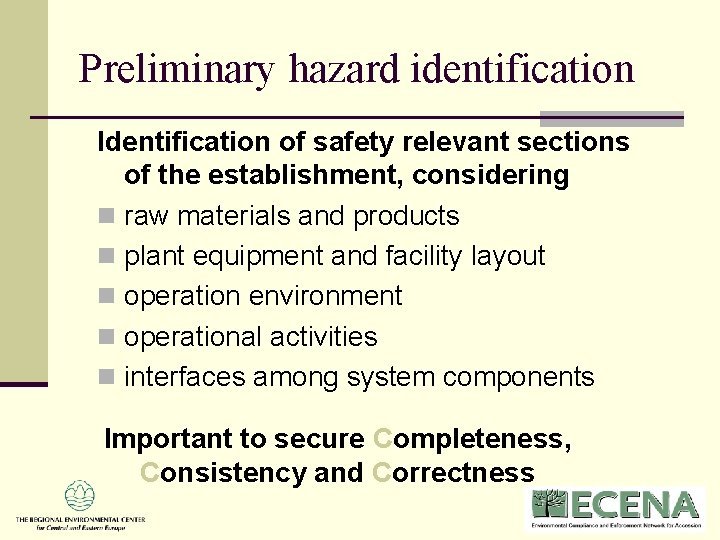
Preliminary hazard identification Identification of safety relevant sections of the establishment, considering n raw materials and products n plant equipment and facility layout n operation environment n operational activities n interfaces among system components Important to secure Completeness, Consistency and Correctness
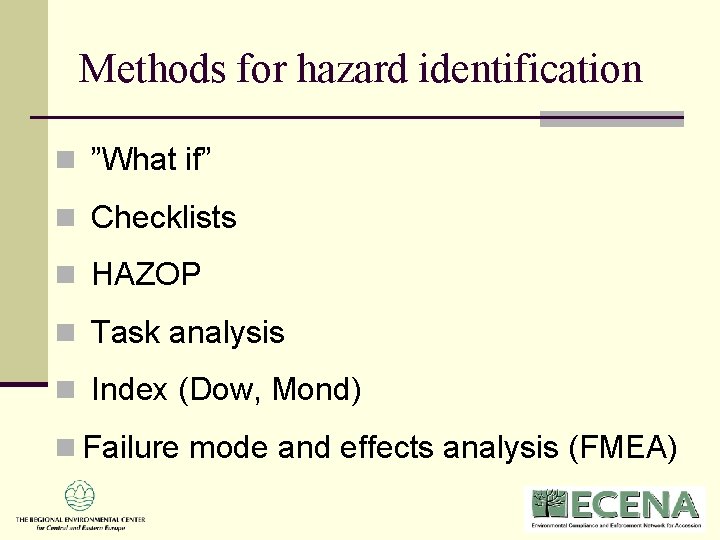
Methods for hazard identification n ”What if” n Checklists n HAZOP n Task analysis n Index (Dow, Mond) n Failure mode and effects analysis (FMEA)
The HAZOP Method n HAZOP analysis is a systematic technique for identifying hazards and operability problems throughout an entire facility. It is particularly useful to identify unwanted hazards designed into facilities due to lack of information, or introduced into existing facilities due to changes in process conditions or operating procedures. n The objectives of a HAZOP study are to detect any predictable deviation (undesirable event) in a process or a system. This purpose is achieved by a systematic study of the operations in each process phase.
The HAZOP Method n The system is divided into functional blocks n Every part of the process is examined for possible n n n deviations from the design intention Can the deviations cause any hazard or inconvenience? Every phase of the process Each system and person Questions formulated around guide words Each deviation is considered to decide how it could be caused and what the consequences would be For the hazards preventive/remedying actions are defined
HAZOP Study Consequence 1. 2. 3. 4. 5. Definition of the objectives and scope of the study, e. g. hazards having only off-site impact or only on-site impact, areas of the plant to be considered, etc. Assembly of a HAZOP study team. Collection of the required documentation, drawings and process description. Analysis of each major item of equipment, and all supporting equipment, piping and instrumentation Documentation of the consequences of any deviation from normal and highlights of those which are considered hazardous and credible.
HAZOP Study team n HAZOP studies are normally carried out by multi-disciplinary teams. There are two types of team members, namely those who will make a technical contribution and those play a supporting and structuring role.
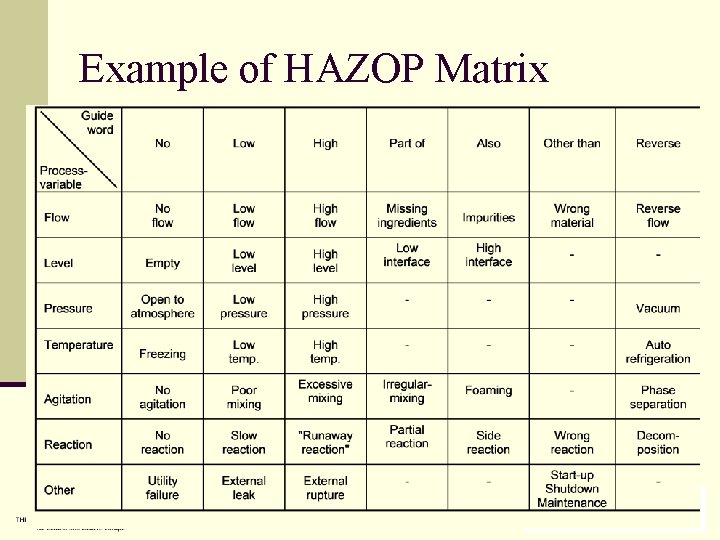
Example of HAZOP Matrix
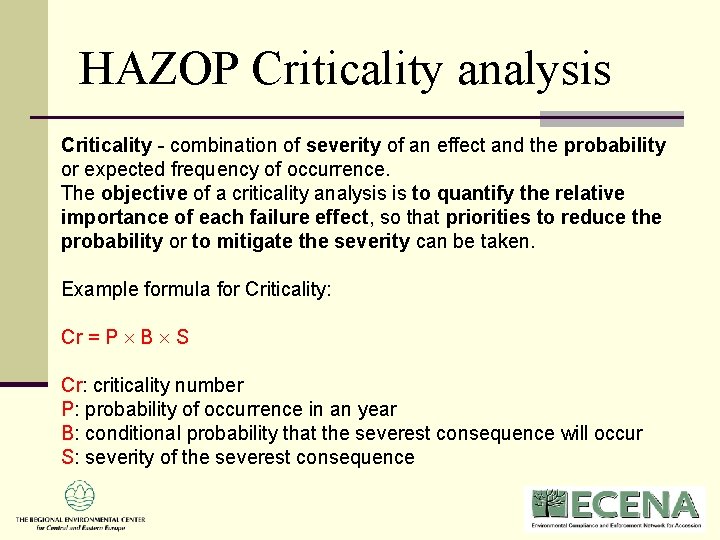
HAZOP Criticality analysis Criticality - combination of severity of an effect and the probability or expected frequency of occurrence. The objective of a criticality analysis is to quantify the relative importance of each failure effect, so that priorities to reduce the probability or to mitigate the severity can be taken. Example formula for Criticality: Cr = P B S Cr: criticality number P: probability of occurrence in an year B: conditional probability that the severest consequence will occur S: severity of the severest consequence
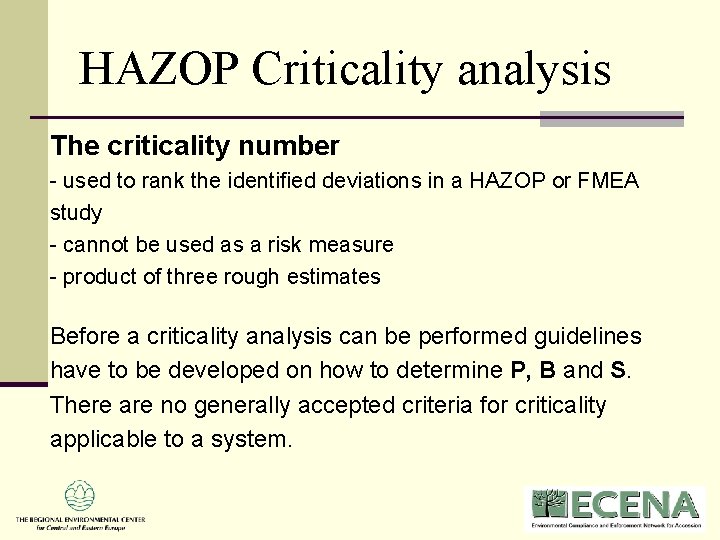
HAZOP Criticality analysis The criticality number - used to rank the identified deviations in a HAZOP or FMEA study - cannot be used as a risk measure - product of three rough estimates Before a criticality analysis can be performed guidelines have to be developed on how to determine P, B and S. There are no generally accepted criteria for criticality applicable to a system.
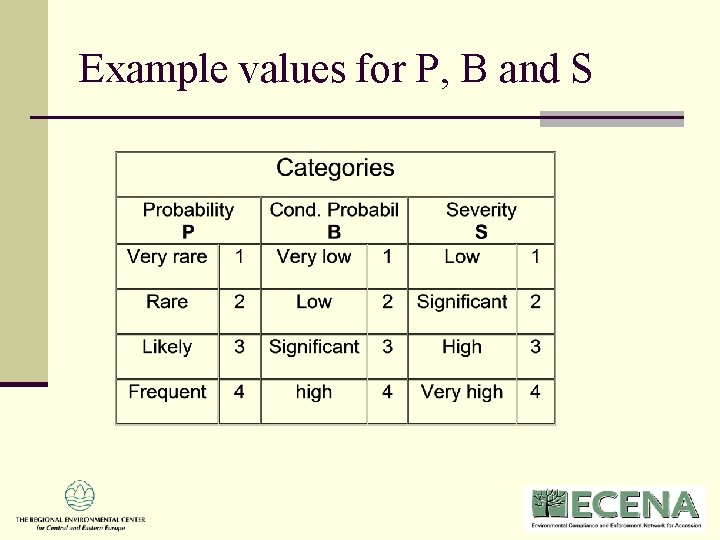
Example values for P, B and S
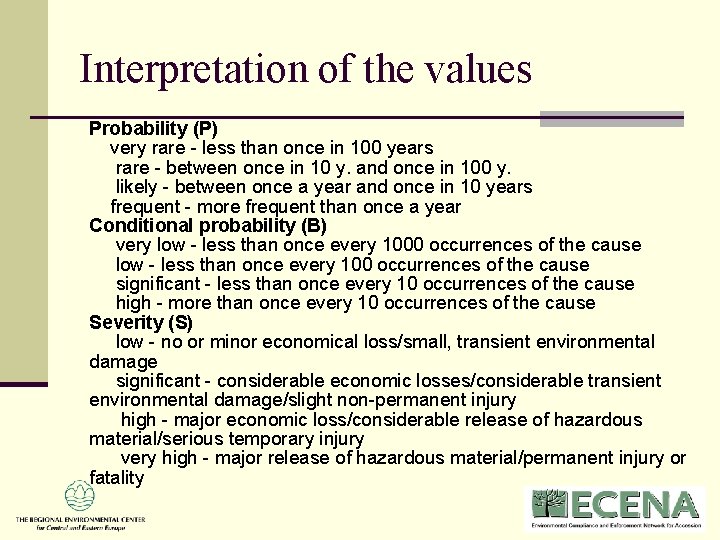
Interpretation of the values Probability (P) very rare - less than once in 100 years rare - between once in 10 y. and once in 100 y. likely - between once a year and once in 10 years frequent - more frequent than once a year Conditional probability (B) very low - less than once every 1000 occurrences of the cause low - less than once every 100 occurrences of the cause significant - less than once every 10 occurrences of the cause high - more than once every 10 occurrences of the cause Severity (S) low - no or minor economical loss/small, transient environmental damage significant - considerable economic losses/considerable transient environmental damage/slight non-permanent injury high - major economic loss/considerable release of hazardous material/serious temporary injury very high - major release of hazardous material/permanent injury or fatality
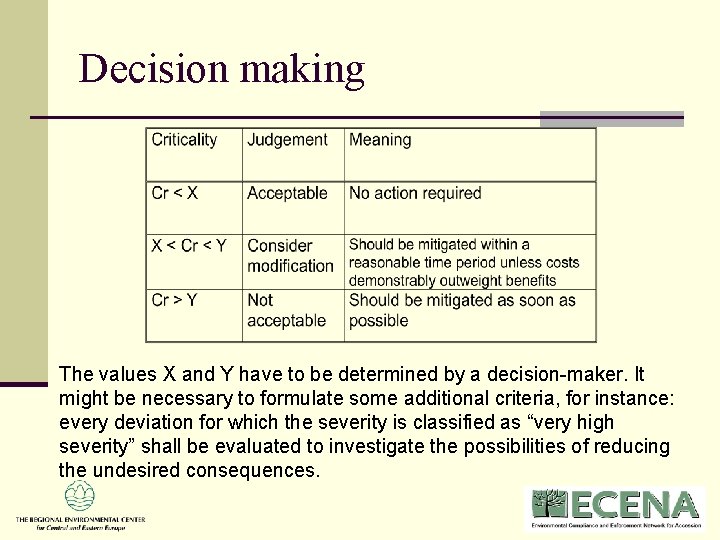
Decision making The values X and Y have to be determined by a decision-maker. It might be necessary to formulate some additional criteria, for instance: every deviation for which the severity is classified as “very high severity” shall be evaluated to investigate the possibilities of reducing the undesired consequences.
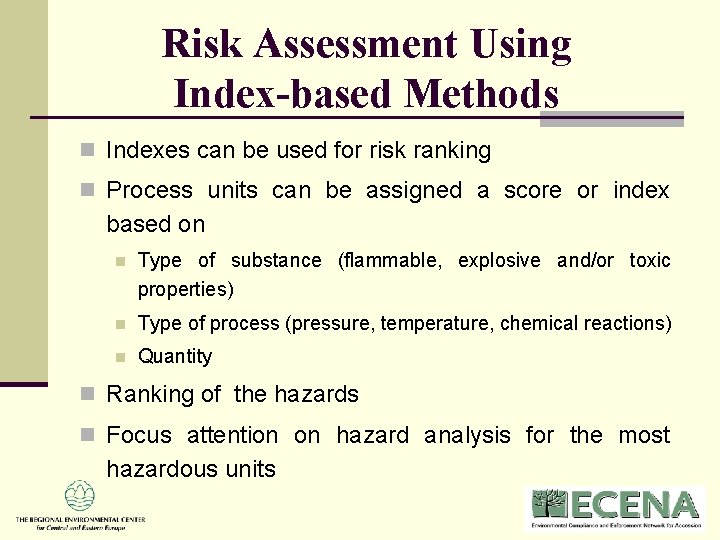
Risk Assessment Using Index-based Methods n Indexes can be used for risk ranking n Process units can be assigned a score or index based on n Type of substance (flammable, explosive and/or toxic properties) n Type of process (pressure, temperature, chemical reactions) n Quantity n Ranking of the hazards n Focus attention on hazard analysis for the most hazardous units
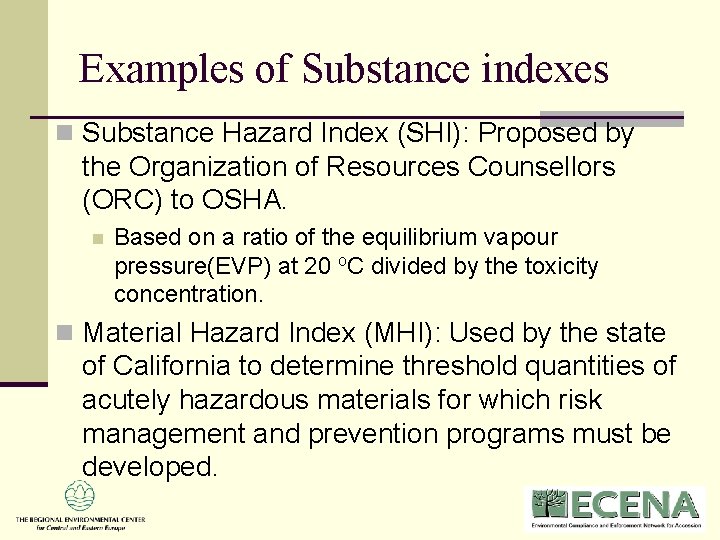
Examples of Substance indexes n Substance Hazard Index (SHI): Proposed by the Organization of Resources Counsellors (ORC) to OSHA. n Based on a ratio of the equilibrium vapour pressure(EVP) at 20 o. C divided by the toxicity concentration. n Material Hazard Index (MHI): Used by the state of California to determine threshold quantities of acutely hazardous materials for which risk management and prevention programs must be developed.
Substance and process indexes n Dow Fire and Explosion Index (F&EI): Evaluates fire and explosion hazards associated with discrete process units. n Mond Fire and Explosion Index: Developed by ICI’s Mond Division, an extension of the Dow F&EI. n These indices focus on fire and explosion hazards, e. g. Butane has a Dow Material Index of 21, and Ammonia 4.
Fault Tree Analysis n Graphical representation of the logical structure displaying the relationship between an undesired potential event (top event) and all its probable causes n n top-down approach to failure analysis starting with a potential undesirable event - top event determining all the ways in which it can occur mitigation measures can be developed to minimize the probability of the undesired event n Fault Tree can help to: n Quantifying probability of top event occurrence n Evaluating proposed system architecture attributes n Assessing design modifications and identify areas requiring attention n Complying with qualitative and quantitative safety/reliability objectives n Qualitatively illustrate failure condition classification of a toplevel event n Establishing maintenance tasks and intervals from safety/reliability assessments
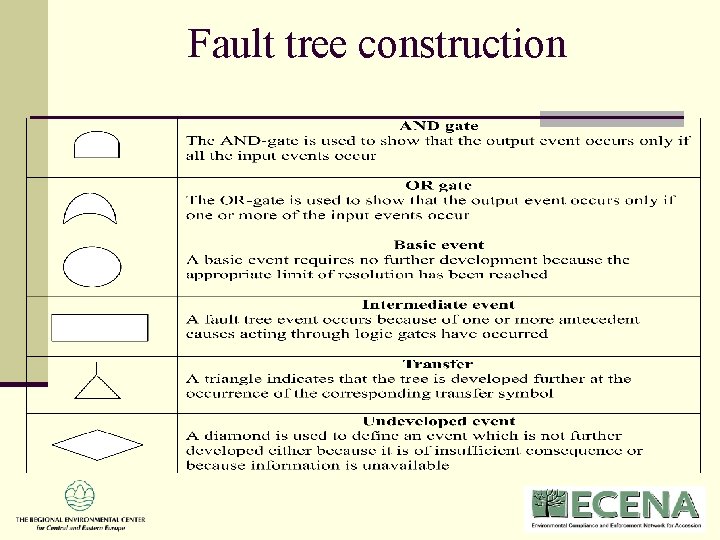
Fault tree construction
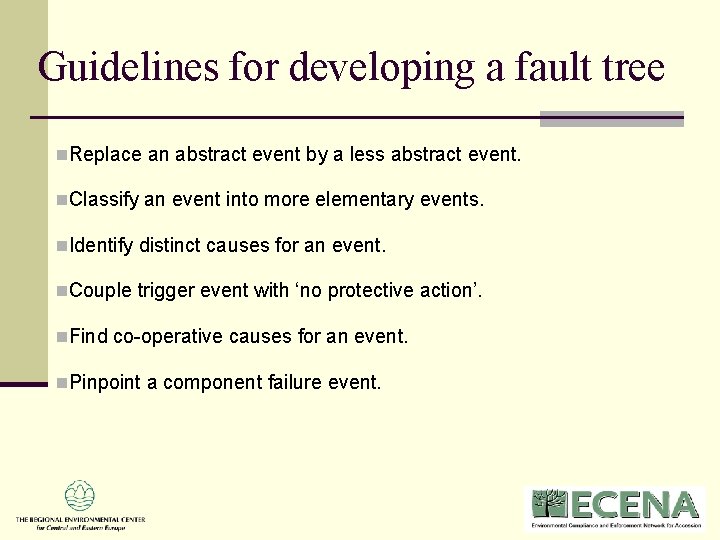
Guidelines for developing a fault tree n. Replace an abstract event by a less abstract event. n. Classify an event into more elementary events. n. Identify distinct causes for an event. n. Couple trigger event with ‘no protective action’. n. Find co-operative causes for an event. n. Pinpoint a component failure event.
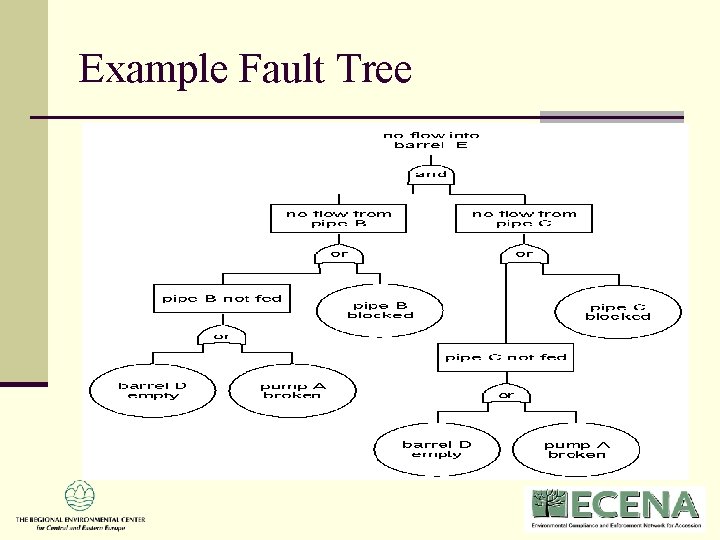
Example Fault Tree
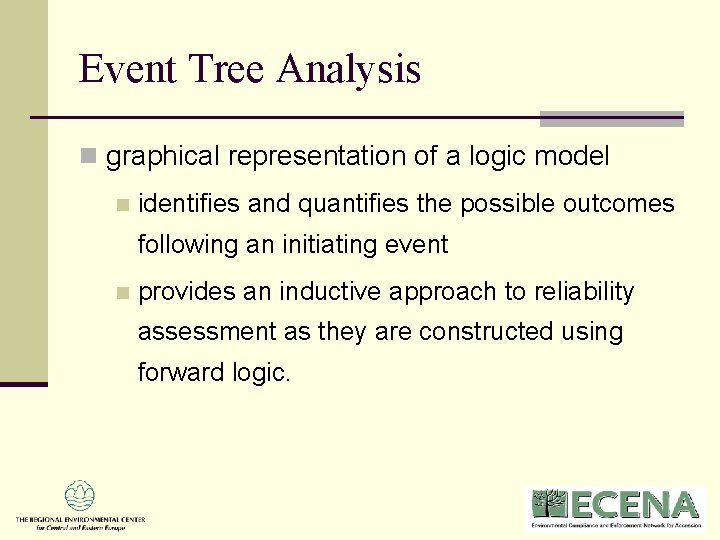
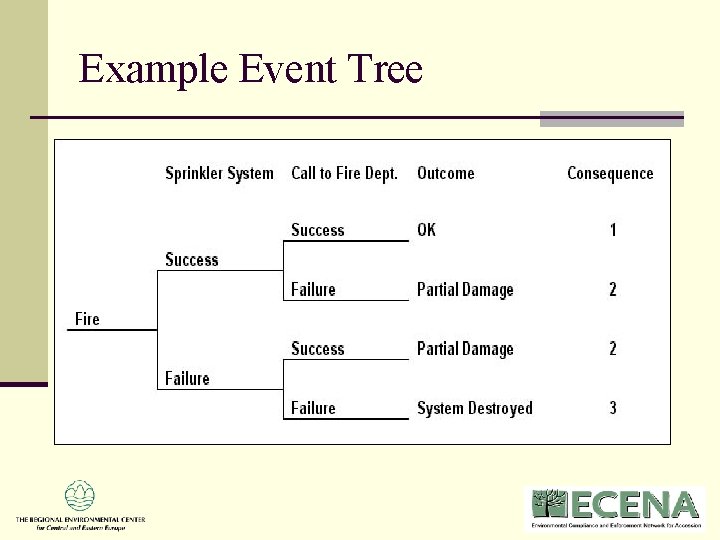
Event Tree Analysis n graphical representation of a logic model n identifies and quantifies the possible outcomes following an initiating event n provides an inductive approach to reliability assessment as they are constructed using forward logic.
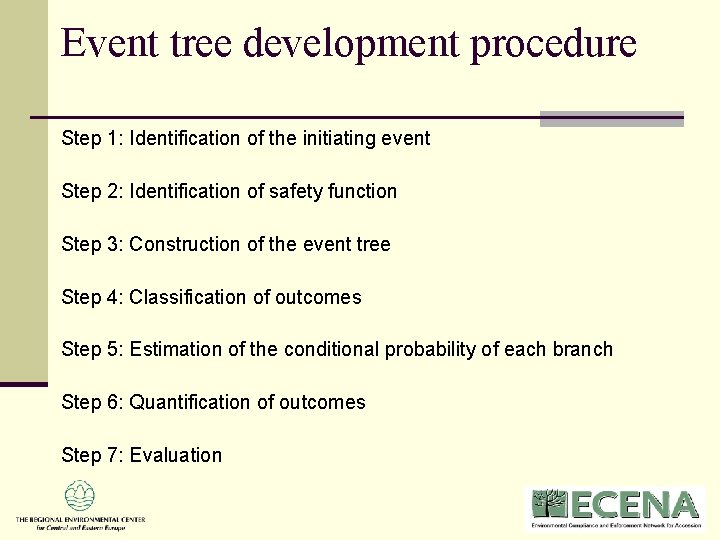
Event tree development procedure Step 1: Identification of the initiating event Step 2: Identification of safety function Step 3: Construction of the event tree Step 4: Classification of outcomes Step 5: Estimation of the conditional probability of each branch Step 6: Quantification of outcomes Step 7: Evaluation
Example Event Tree
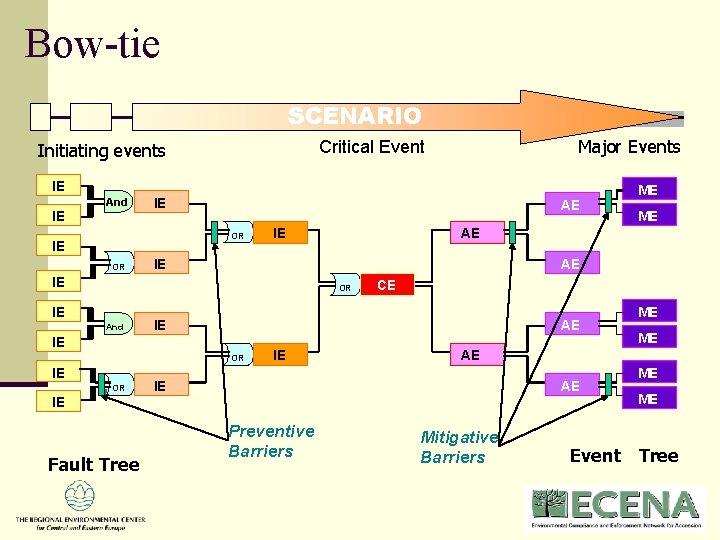
Bowtie Analysis n Synergistic adaptation of Fault Tree Analysis, Causal Factors Charting and Event Tree Analysis n n n n n highly effective for initial Process Hazard Analysis ensures identification of high probability-high consequence events combined application of a high-level fault/event trees representation of the causes of a hazardous scenario event, likely outcomes, and the measures in place to prevent, mitigate, or control hazards Existing safeguards (barriers) identified and evaluated Typical cause scenarios identified and depicted on the preevent side (left side) of the bow-tie diagram Credible consequences and scenario outcomes are depicted on the post-event side (right side) of the diagram associated barrier safeguards included the risks are readily understandable to all levels of operation and management.
Example Bowtie Tree SCENARIO UE 1 And UE 2 UE 3 UE 4 UE 5 DP OR OR IE SCE IE And CE IE OR OR IE DP ME ME SCE IE Prevention ME ME DP OR UE 6 UE 7 UE 8 IE Barriers Mitigation Fault Tree Event tree Unwanted Events (UE) / Initiating Events (IE) / Critical Events (CE) : Loss of Containment (LOC) or Loss of Physical Integrity (LPI) / Secondary Critical Events (SCE) / Dangerous Phenomena (DP) / Major Events (ME)
Consequence assessment n The consequence assessment is used to estimate: The extent or distance to which casualties or damage may occur as a consequence of an accident; n The conditional probability of loss of life or damage as a consequence of an accident; n
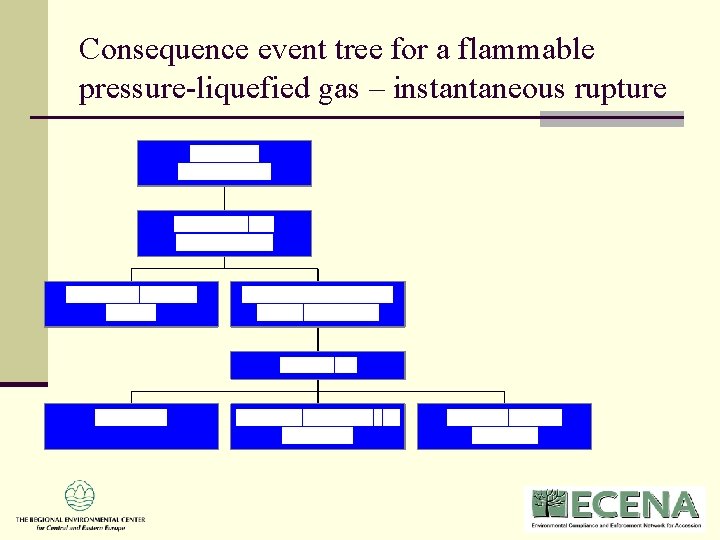
Consequence event tree for a flammable pressure-liquefied gas – instantaneous rupture
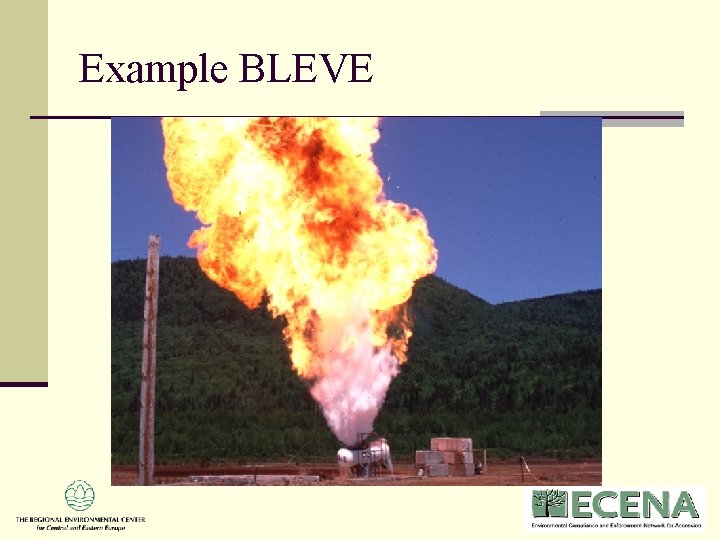
Example BLEVE
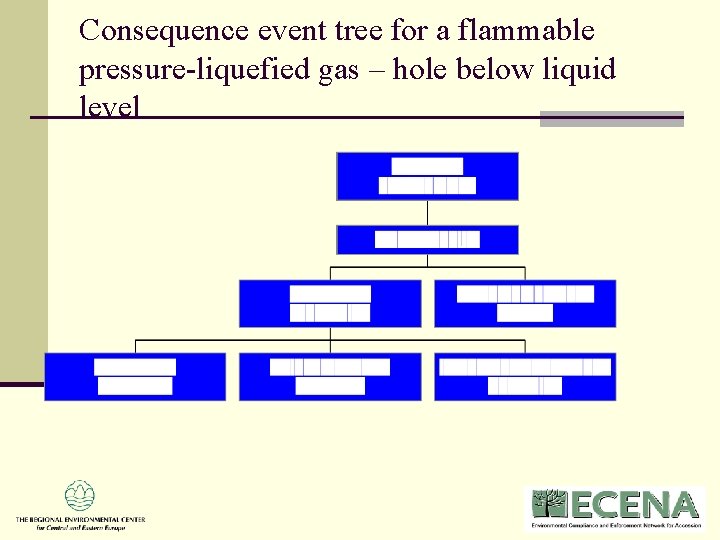
Consequence event tree for a flammable pressure-liquefied gas – hole below liquid level
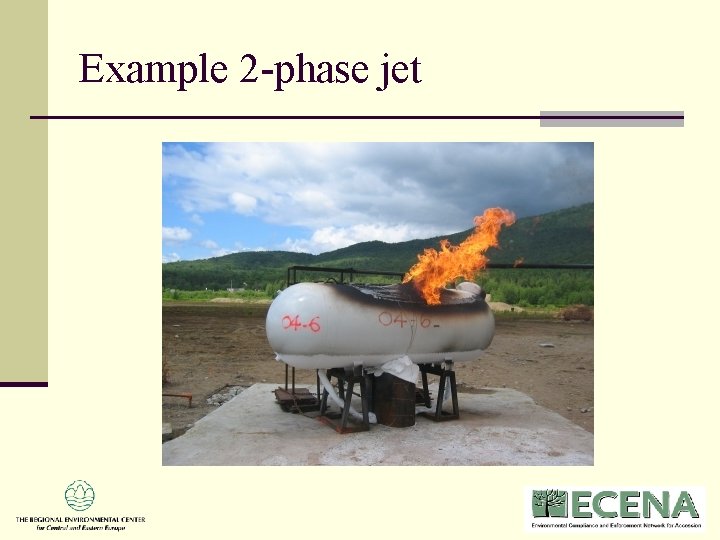
Example 2 -phase jet
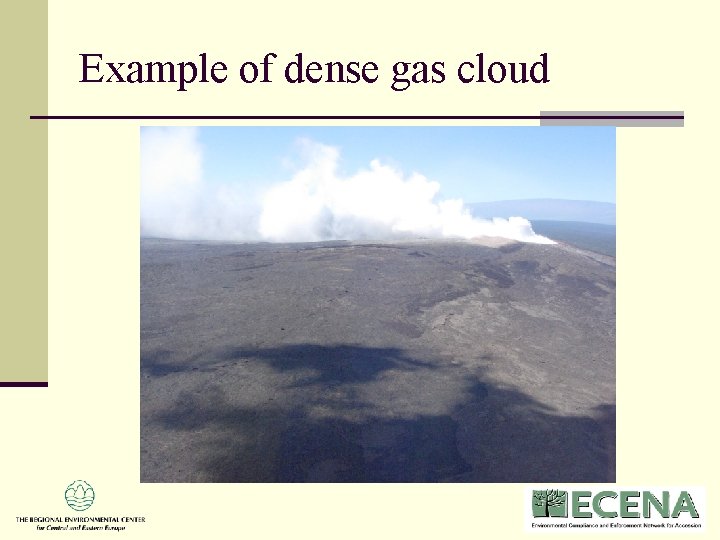
Different forms of dispersion in the atmosphere n Jet n High speed (high momentum), rapid mixing, single direction n Dense (= denser than air) clouds: n Dense gas ”slumps” in all directions (even against the wind) n Dense clouds are shallow n Density layering (stratification) reduces mixing n Buoyant (= lighter than air)plume n plume rise
Example of dense gas cloud
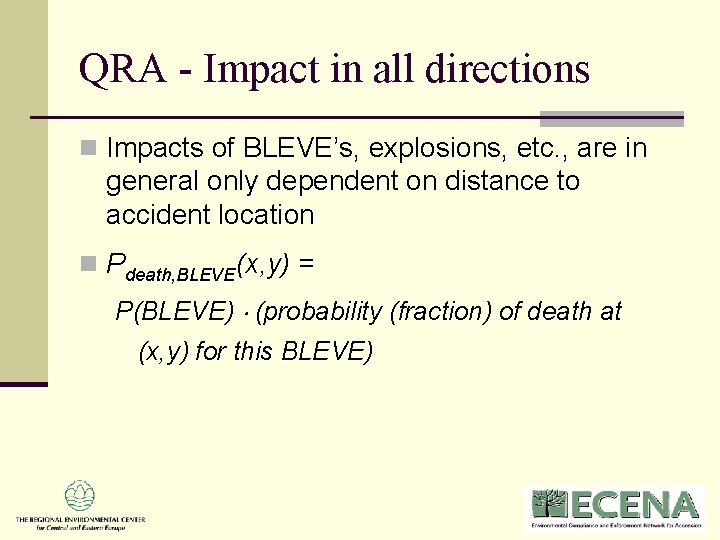
QRA - Impact in all directions n Impacts of BLEVE’s, explosions, etc. , are in general only dependent on distance to accident location n Pdeath, BLEVE(x, y) = P(BLEVE) (probability (fraction) of death at (x, y) for this BLEVE)
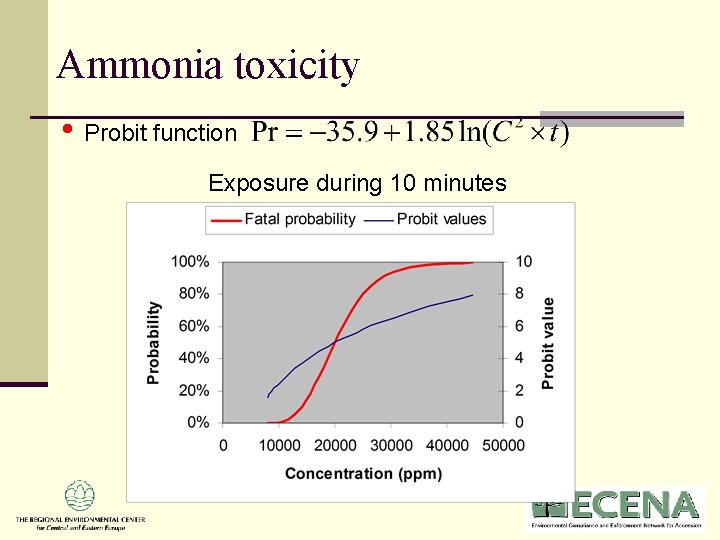
Ammonia toxicity • Probit function Exposure during 10 minutes
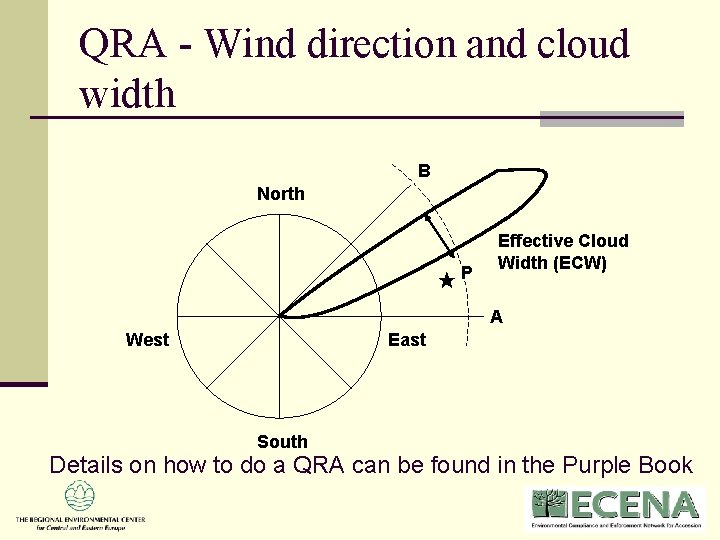
QRA - Wind direction and cloud width B North P Effective Cloud Width (ECW) A West East South Details on how to do a QRA can be found in the Purple Book
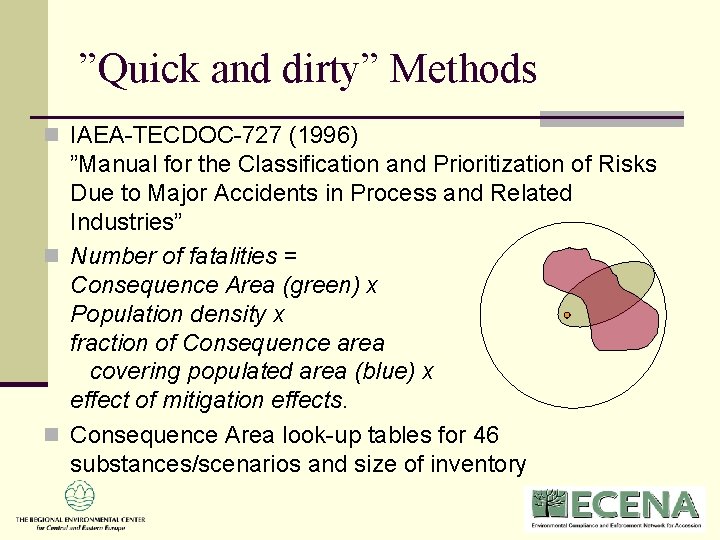
”Quick and dirty” Methods n IAEA-TECDOC-727 (1996) ”Manual for the Classification and Prioritization of Risks Due to Major Accidents in Process and Related Industries” n Number of fatalities = Consequence Area (green) x Population density x fraction of Consequence area covering populated area (blue) x effect of mitigation effects. n Consequence Area look-up tables for 46 substances/scenarios and size of inventory
Consequence assessment in practice n Consequence assessment is often an expert- activity (performed by consultants) n Most ”complete” consequence assessment software packages are propriatary and expensive n Some freeware is available for specific consequences (ARCHIE, ALOHA etc. ) n Some models are described in detail in handbooks (e. g. ”Yellow Book, TNO, Netherlands)
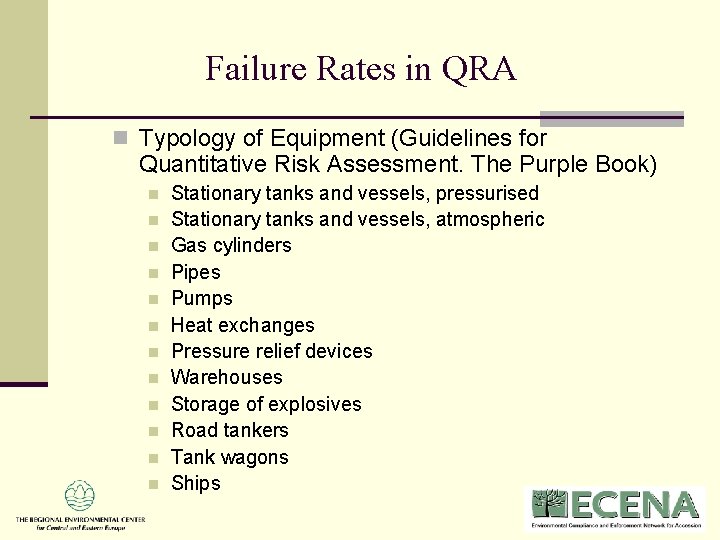
Failure Rates in QRA n Typology of Equipment (Guidelines for Quantitative Risk Assessment. The Purple Book) n n n Stationary tanks and vessels, pressurised Stationary tanks and vessels, atmospheric Gas cylinders Pipes Pumps Heat exchanges Pressure relief devices Warehouses Storage of explosives Road tankers Tank wagons Ships
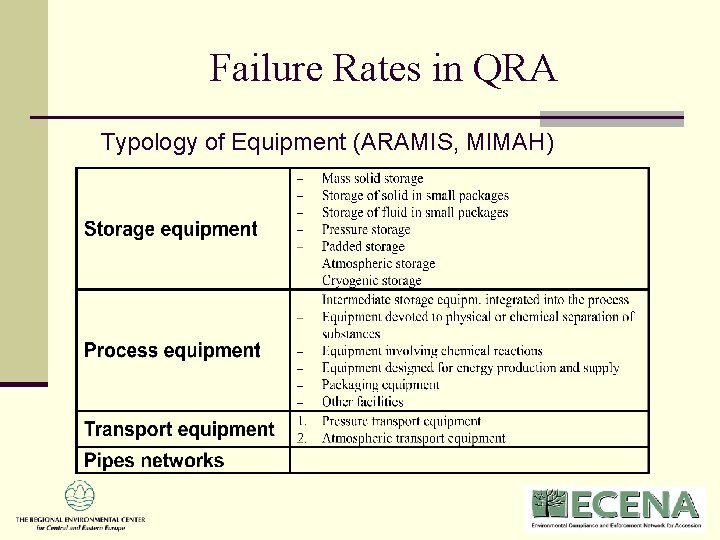
Failure Rates in QRA Typology of Equipment (ARAMIS, MIMAH)
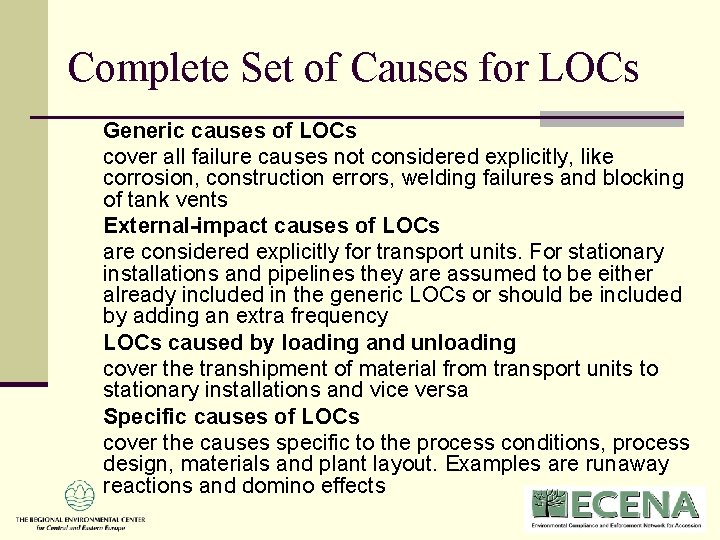
Complete Set of Causes for LOCs Generic causes of LOCs cover all failure causes not considered explicitly, like corrosion, construction errors, welding failures and blocking of tank vents External-impact causes of LOCs are considered explicitly for transport units. For stationary installations and pipelines they are assumed to be either already included in the generic LOCs or should be included by adding an extra frequency LOCs caused by loading and unloading cover the transhipment of material from transport units to stationary installations and vice versa Specific causes of LOCs cover the causes specific to the process conditions, process design, materials and plant layout. Examples are runaway reactions and domino effects
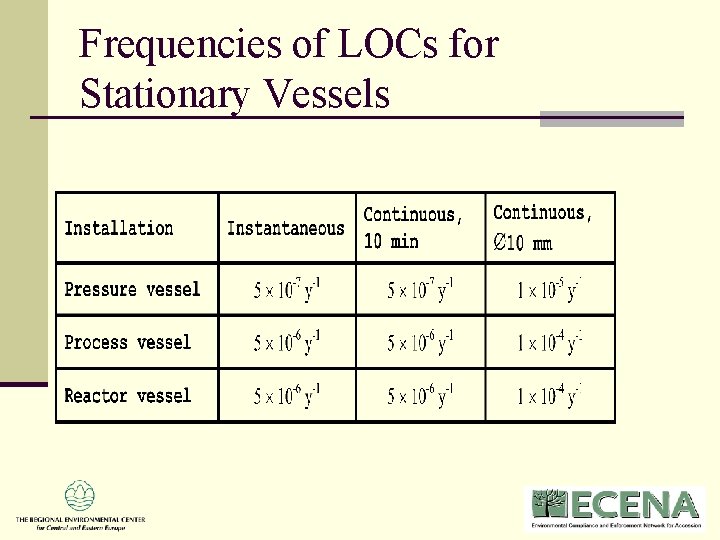
Frequencies of LOCs for Stationary Vessels
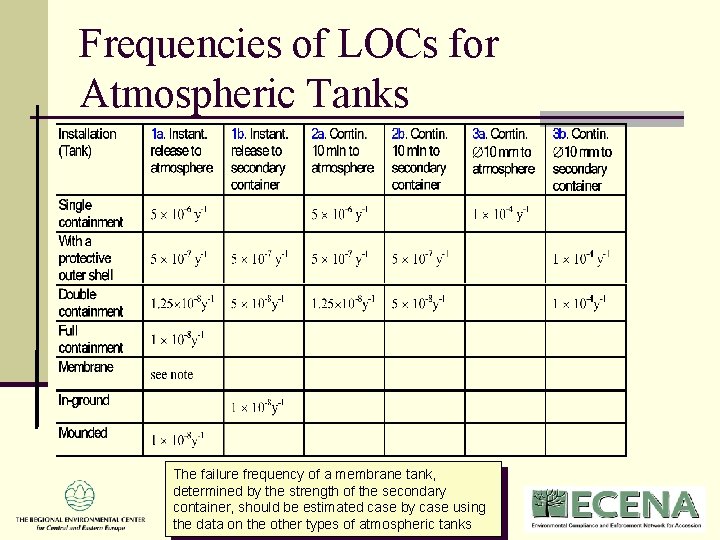
Frequencies of LOCs for Atmospheric Tanks The failure frequency of a membrane tank, determined by the strength of the secondary container, should be estimated case by case using the data on the other types of atmospheric tanks
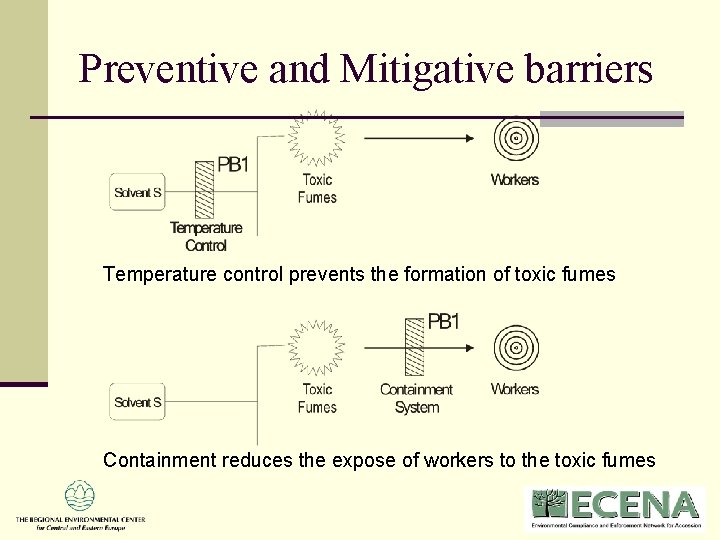
Preventive and Mitigative barriers Temperature control prevents the formation of toxic fumes Containment reduces the expose of workers to the toxic fumes
Bow-tie SCENARIO Major Events Critical Event Initiating events IE And IE IE AE OR And AE OR OR CE IE IE IE AE Preventive Barriers ME ME AE IE Fault Tree ME AE IE IE IE ME Mitigative Barriers ME ME Event Tree
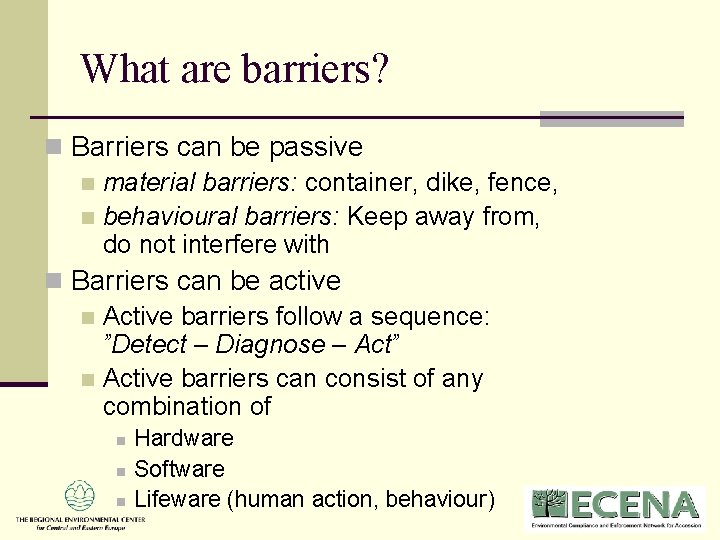
What are barriers? n Barriers can be passive n material barriers: container, dike, fence, n behavioural barriers: Keep away from, do not interfere with n Barriers can be active n Active barriers follow a sequence: ”Detect – Diagnose – Act” n Active barriers can consist of any combination of n n n Hardware Software Lifeware (human action, behaviour)
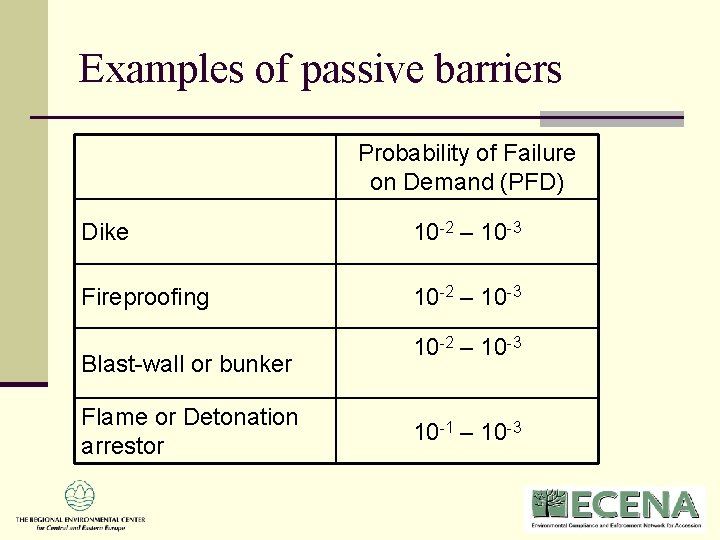
Examples of passive barriers Probability of Failure on Demand (PFD) Dike 10 -2 – 10 -3 Fireproofing 10 -2 – 10 -3 Blast-wall or bunker Flame or Detonation arrestor 10 -2 – 10 -3 10 -1 – 10 -3
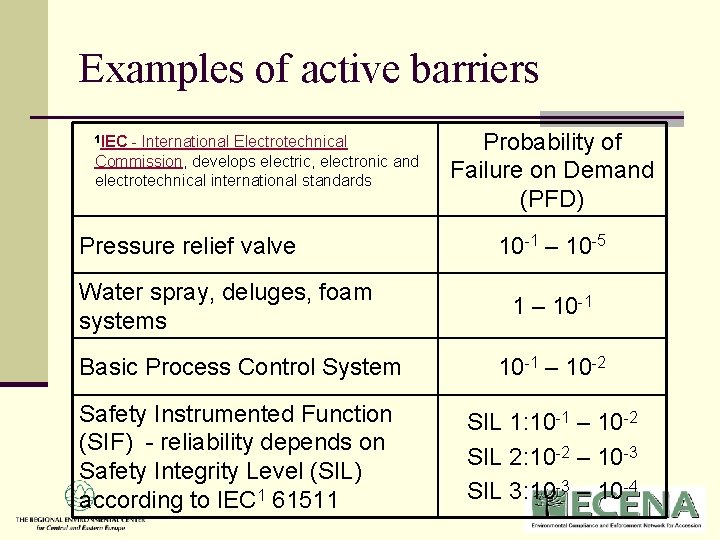
Examples of active barriers 1 IEC - International Electrotechnical Commission, develops electric, electronic and electrotechnical international standards Pressure relief valve Water spray, deluges, foam systems Probability of Failure on Demand (PFD) 10 -1 – 10 -5 1 – 10 -1 Basic Process Control System 10 -1 – 10 -2 Safety Instrumented Function (SIF) - reliability depends on Safety Integrity Level (SIL) according to IEC 1 61511 SIL 1: 10 -1 – 10 -2 SIL 2: 10 -2 – 10 -3 SIL 3: 10 -3 – 10 -4
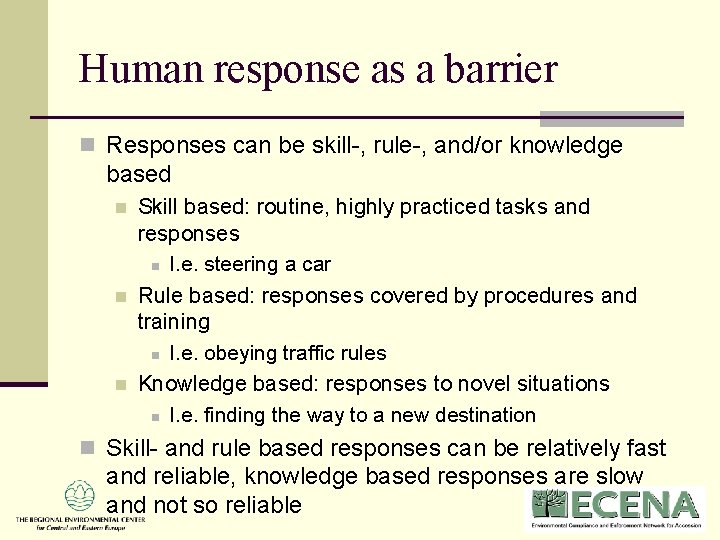
Human response as a barrier n Responses can be skill-, rule-, and/or knowledge based n n n Skill based: routine, highly practiced tasks and responses n I. e. steering a car Rule based: responses covered by procedures and training n I. e. obeying traffic rules Knowledge based: responses to novel situations n I. e. finding the way to a new destination n Skill- and rule based responses can be relatively fast and reliable, knowledge based responses are slow and not so reliable
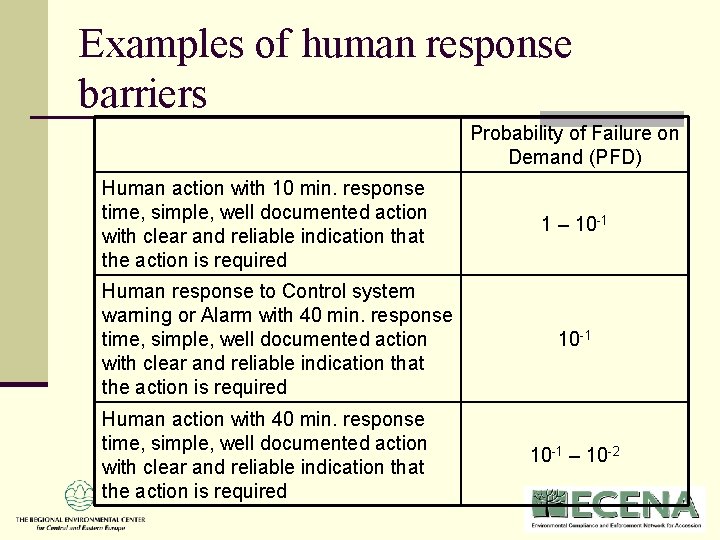
Examples of human response barriers Probability of Failure on Demand (PFD) Human action with 10 min. response time, simple, well documented action with clear and reliable indication that the action is required Human response to Control system warning or Alarm with 40 min. response time, simple, well documented action with clear and reliable indication that the action is required Human action with 40 min. response time, simple, well documented action with clear and reliable indication that the action is required 1 – 10 -1 – 10 -2
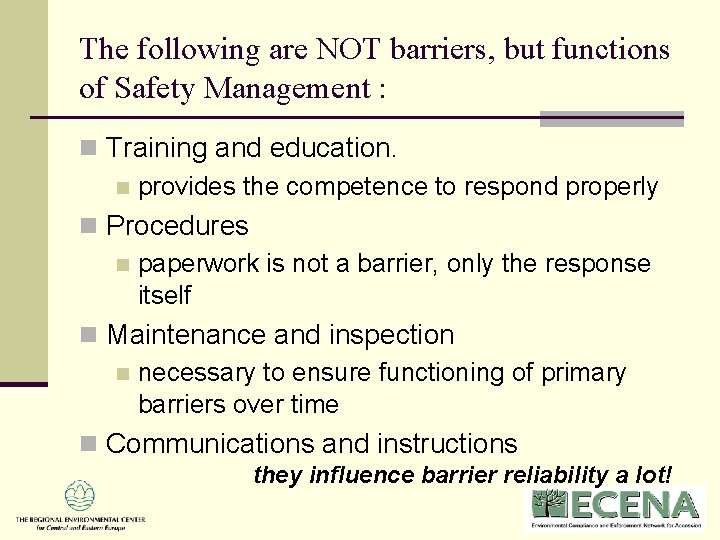
The following are NOT barriers, but functions of Safety Management : n Training and education. n provides the competence to respond properly n Procedures n paperwork is not a barrier, only the response itself n Maintenance and inspection n necessary to ensure functioning of primary barriers over time n Communications and instructions they influence barrier reliability a lot!
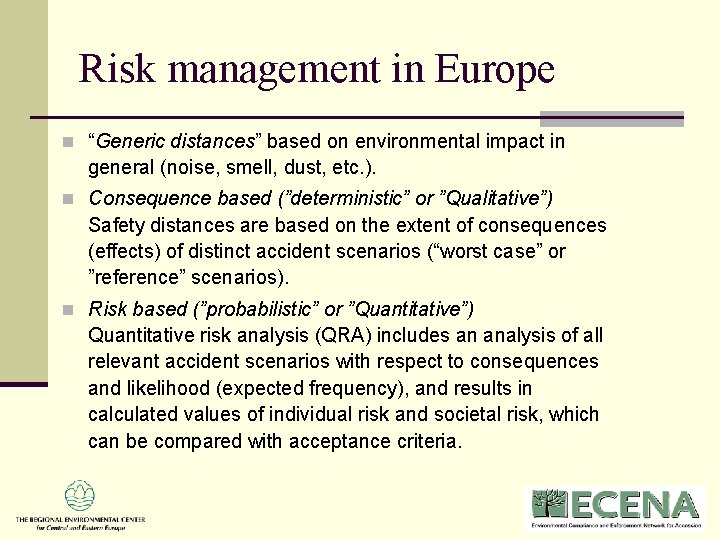
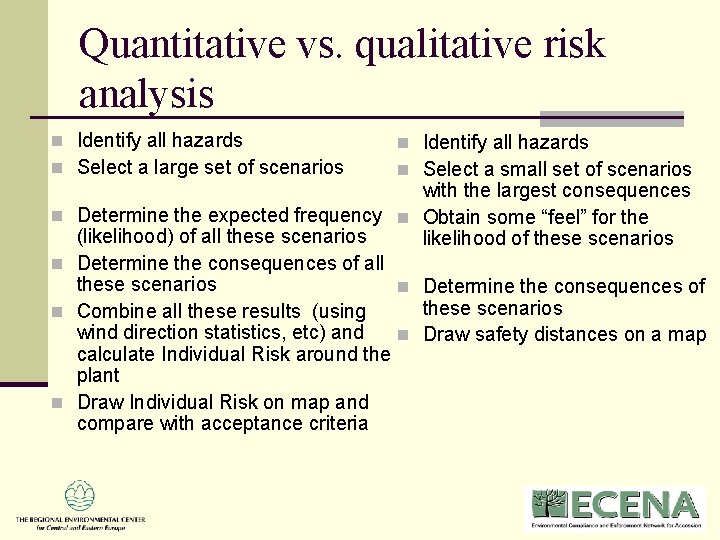
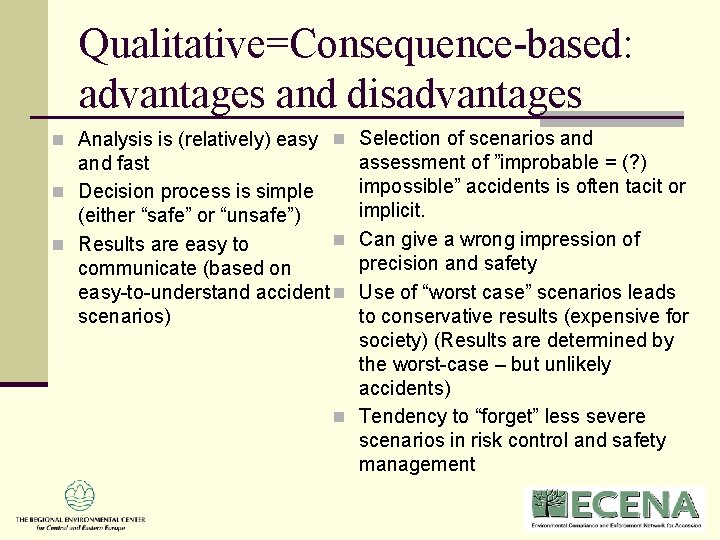
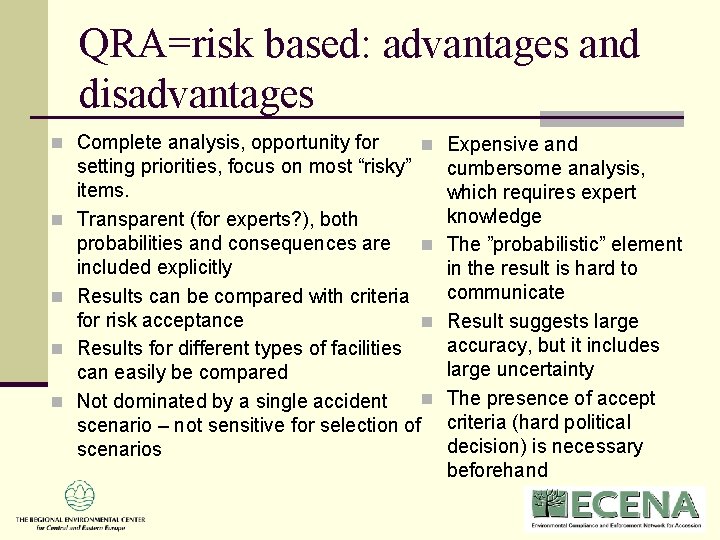
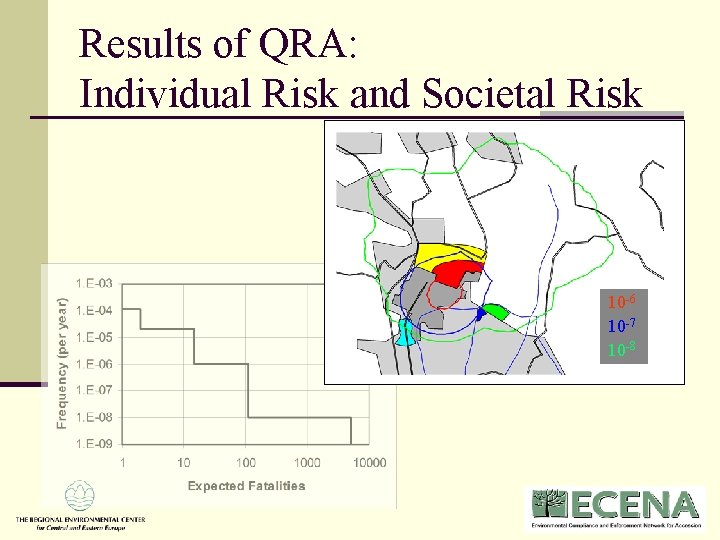
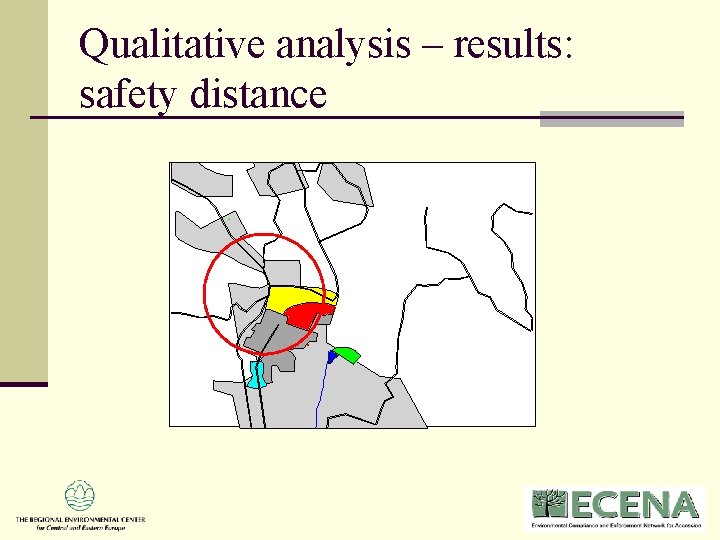
Risk management in Europe n “Generic distances” based on environmental impact in general (noise, smell, dust, etc. ). n Consequence based (”deterministic” or ”Qualitative”) Safety distances are based on the extent of consequences (effects) of distinct accident scenarios (“worst case” or ”reference” scenarios). n Risk based (”probabilistic” or ”Quantitative”) Quantitative risk analysis (QRA) includes an analysis of all relevant accident scenarios with respect to consequences and likelihood (expected frequency), and results in calculated values of individual risk and societal risk, which can be compared with acceptance criteria.
Quantitative vs. qualitative risk analysis n Identify all hazards n Select a large set of scenarios n n n Identify all hazards n Select a small set of scenarios with the largest consequences Determine the expected frequency n Obtain some “feel” for the (likelihood) of all these scenarios likelihood of these scenarios Determine the consequences of all these scenarios n Determine the consequences of these scenarios Combine all these results (using wind direction statistics, etc) and n Draw safety distances on a map calculate Individual Risk around the plant Draw Individual Risk on map and compare with acceptance criteria
Qualitative=Consequence-based: advantages and disadvantages n Analysis is (relatively) easy n Selection of scenarios and assessment of ”improbable = (? ) impossible” accidents is often tacit or implicit. Can give a wrong impression of precision and safety Use of “worst case” scenarios leads to conservative results (expensive for society) (Results are determined by the worst-case – but unlikely accidents) n Tendency to “forget” less severe scenarios in risk control and safety management and fast n Decision process is simple (either “safe” or “unsafe”) n n Results are easy to communicate (based on easy-to-understand accident n scenarios)
QRA=risk based: advantages and disadvantages n Complete analysis, opportunity for n n n Expensive and setting priorities, focus on most “risky” items. Transparent (for experts? ), both probabilities and consequences are n included explicitly Results can be compared with criteria for risk acceptance n Results for different types of facilities can easily be compared n Not dominated by a single accident scenario – not sensitive for selection of scenarios cumbersome analysis, which requires expert knowledge The ”probabilistic” element in the result is hard to communicate Result suggests large accuracy, but it includes large uncertainty The presence of accept criteria (hard political decision) is necessary beforehand
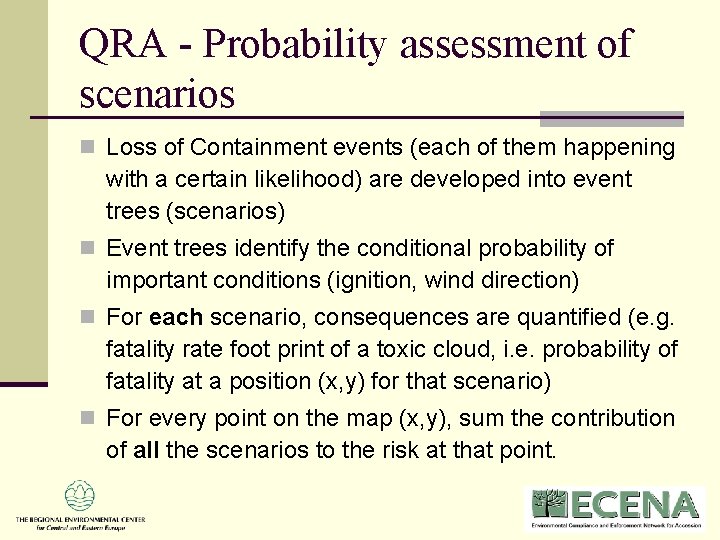
QRA - Probability assessment of scenarios n Loss of Containment events (each of them happening with a certain likelihood) are developed into event trees (scenarios) n Event trees identify the conditional probability of important conditions (ignition, wind direction) n For each scenario, consequences are quantified (e. g. fatality rate foot print of a toxic cloud, i. e. probability of fatality at a position (x, y) for that scenario) n For every point on the map (x, y), sum the contribution of all the scenarios to the risk at that point.
Results of QRA: Individual Risk and Societal Risk 10 -6 10 -7 10 -8
Qualitative analysis – results: safety distance
Qualitative analysis – results: risk matrix Scenarios for consequence analysis are typically in the yellow zone But don’t forget to manage the scenarios in the green zone!
Is there a difference? n Kirchsteiger (1999) concludes: ”… that there is neither a strictly deterministic nor a strictly probabilistic approach to risk analysis. Each probabilistic approach to risk analysis involves deterministic arguments, each deterministic approach includes quantitative arguments which decide how the likelihood of events is going to be addressed. ”
Risk acceptance n For society’s acceptance the following factors play a role: n Risk aversion n “Cost/benefit” and ALARA principle n The source of the risk: fatality risk in apartments is a factor 150 less acceptable than in traffic (Swedish study) n Existing risk criteria are founded on comparison with general fatality risk (ca. 10 -4 per year for young people) and the costs, society is willing to pay for saving a human life
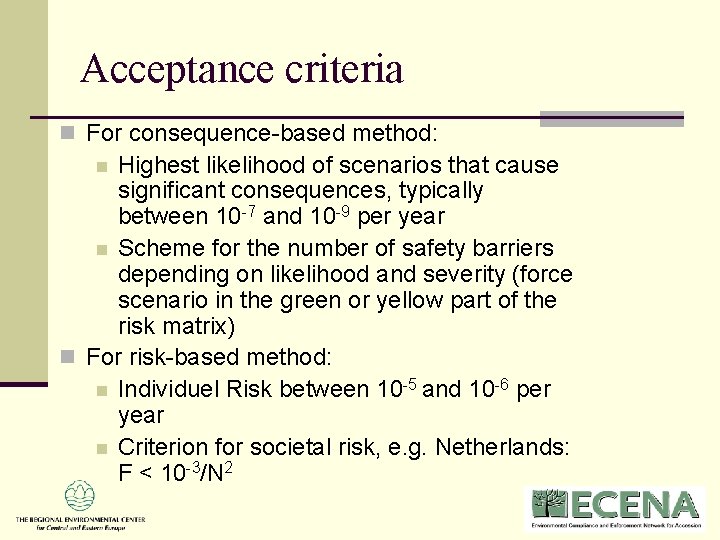
Acceptance criteria n For consequence-based method: Highest likelihood of scenarios that cause significant consequences, typically between 10 -7 and 10 -9 per year n Scheme for the number of safety barriers depending on likelihood and severity (force scenario in the green or yellow part of the risk matrix) n For risk-based method: n Individuel Risk between 10 -5 and 10 -6 per year n Criterion for societal risk, e. g. Netherlands: F < 10 -3/N 2 n
Risk acceptance – final consideration n Report on the inquiry of the Flixborough accident states: “… for what is or is not acceptable depends in the end upon current social tolerance and what is regarded as tolerable at one time may well be regarded as intolerable at another. ”