A REPORT FROM THE LENFEST FORAGE FISH TASK










- Slides: 39
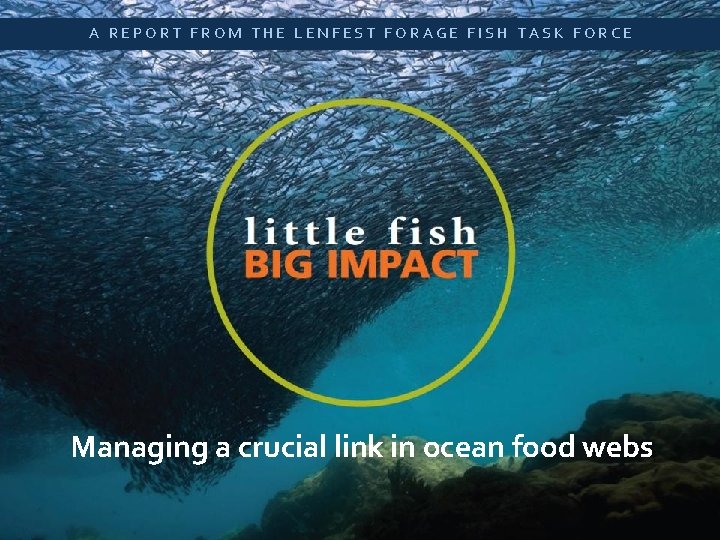
A REPORT FROM THE LENFEST FORAGE FISH TASK FORCE Little Fish, Big Impact A SUMMARY OF NEW SCIENTIFIC ANALYSIS Managing a crucial link in ocean food webs
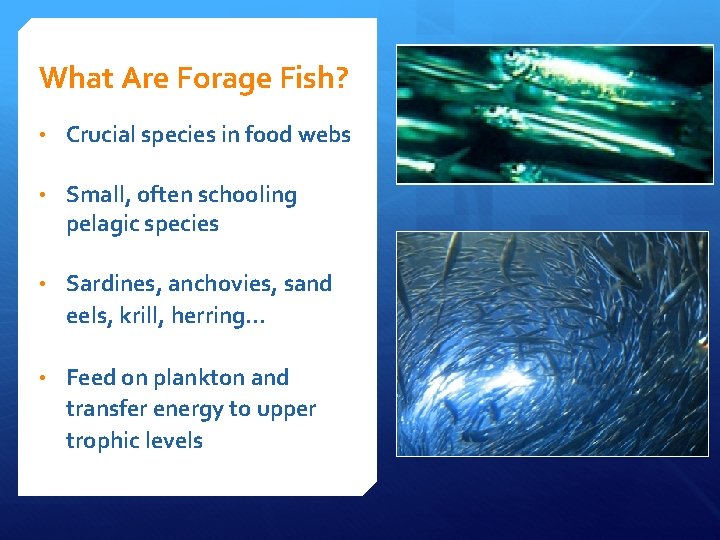
What Are Forage Fish? • Crucial species in food webs • Small, often schooling pelagic species • Sardines, anchovies, sand eels, krill, herring… • Feed on plankton and transfer energy to upper trophic levels
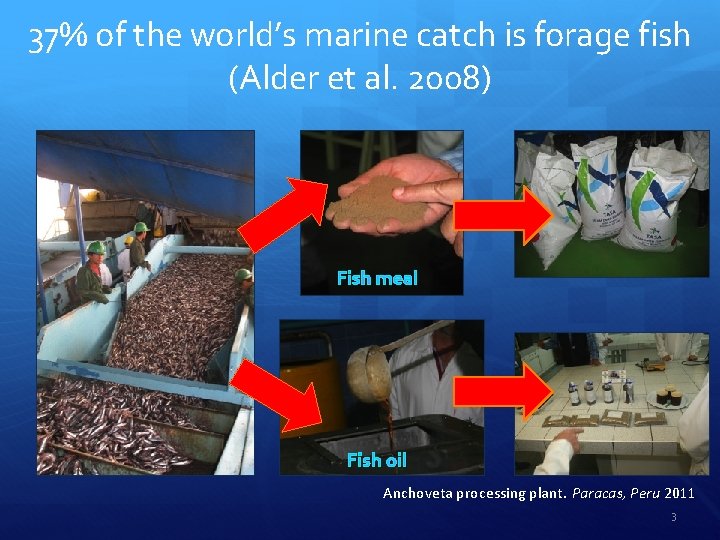
37% of the world’s marine catch is forage fish (Alder et al. 2008) Fish meal Fish oil Anchoveta processing plant. Paracas, Peru 2011 3
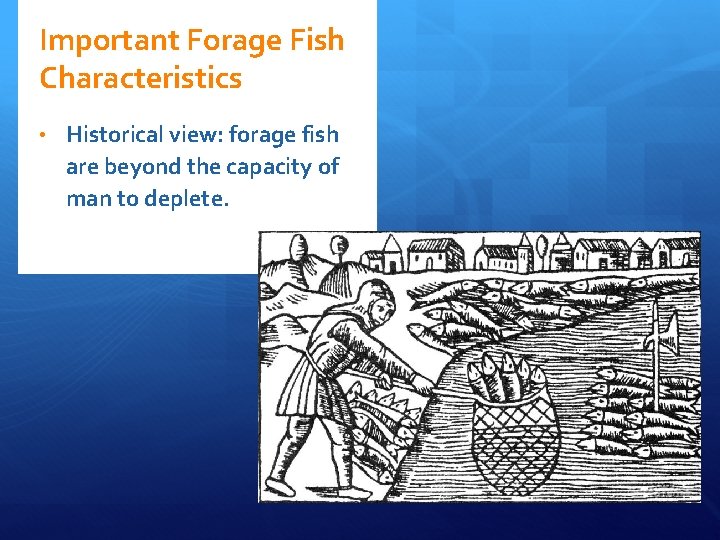
Important Forage Fish Characteristics • Historical view: forage fish are beyond the capacity of man to deplete.
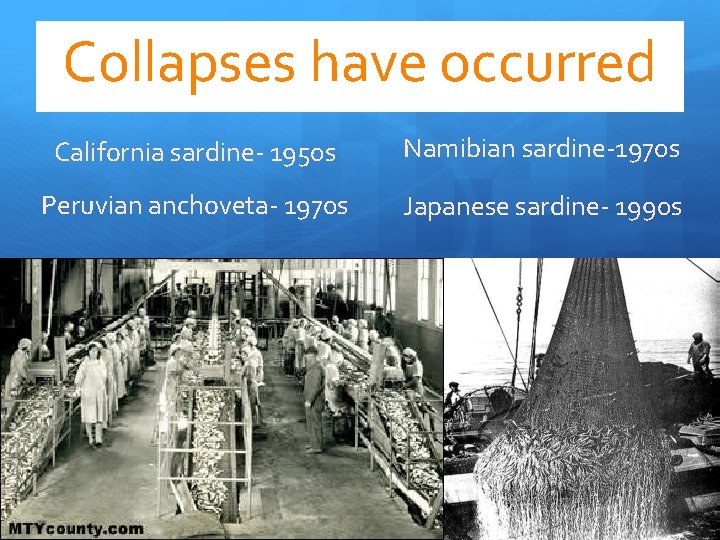
Collapses have occurred California sardine- 1950 s Namibian sardine-1970 s Peruvian anchoveta- 1970 s Japanese sardine- 1990 s
Task Force Members Objective: Develop consensus recommendations on sustainable management of forage fish which accounts for their vital role in ocean ecosystems. Dr. Ellen K. Pikitch, Chair Dr. Tim Essington Dr. Daniel Pauly Dr. P. Dee Boersma Dr. Selina S. Heppell Dr. Éva Plagányi Dr. Ian L. Boyd Dr. Edward D. Houde Dr. Keith Sainsbury Dr. David O. Conover Dr. Marc Mangel Dr. Robert S. Steneck Dr. Philippe Cury
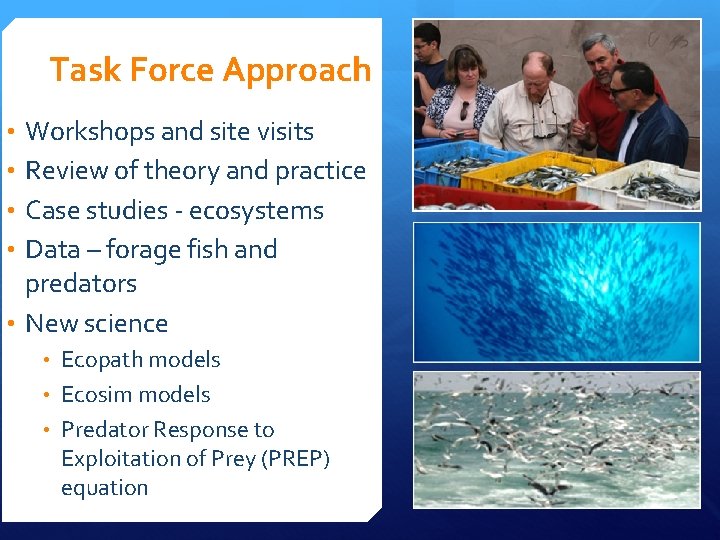
Task Force Approach • Workshops and site visits • Review of theory and practice • Case studies - ecosystems • Data – forage fish and predators • New science • Ecopath models • Ecosim models • Predator Response to Exploitation of Prey (PREP) equation
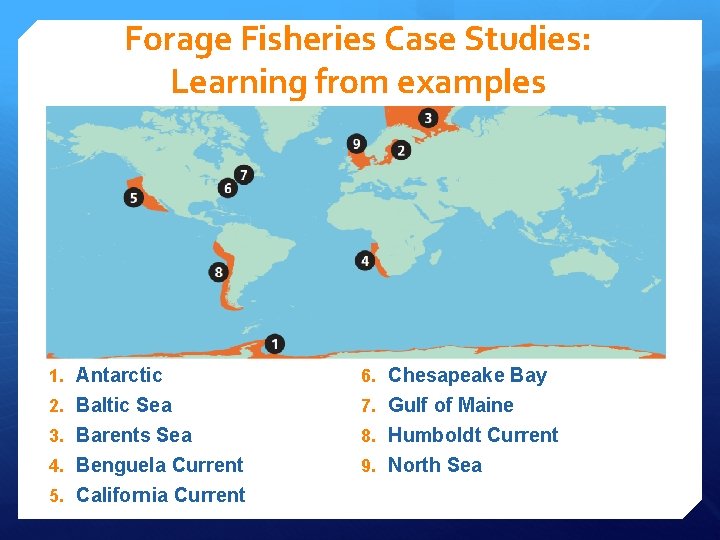
Forage Fisheries Case Studies: Learning from examples 1. Antarctic 6. Chesapeake Bay 2. Baltic Sea 7. Gulf of Maine 3. Barents Sea 8. Humboldt Current 4. Benguela Current 9. North Sea 5. California Current
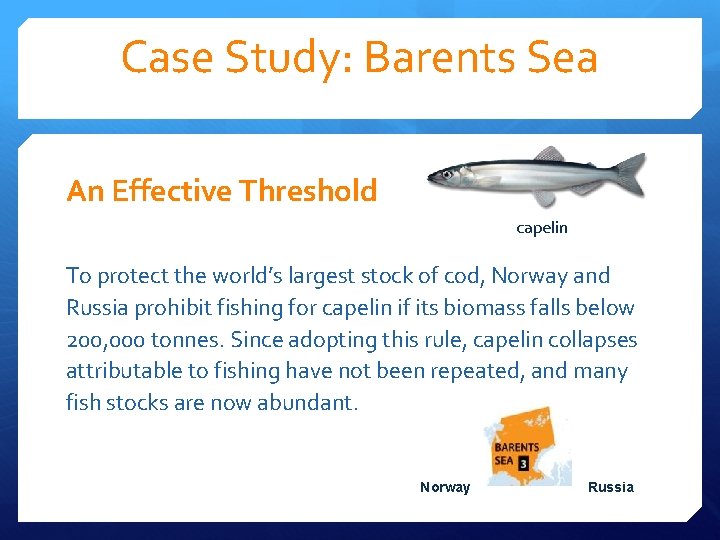
Case Study: Barents Sea An Effective Threshold capelin To protect the world’s largest stock of cod, Norway and Russia prohibit fishing for capelin if its biomass falls below 200, 000 tonnes. Since adopting this rule, capelin collapses attributable to fishing have not been repeated, and many fish stocks are now abundant. Norway Russia
Foraging Distance & Magellanic Penguins Foraging-trip distance predicted Magellanic penguin reproductive success in Punta Tombo, Argentina. (Boersma and Rebstock 2009)
Cury, Boyd et al 2011, Science
Cury et al. Science 2011; 334: 1703 -1706
Metaanalysis: one third for the birds 7 marine ecosystems 14 seabird species 438 years of observation
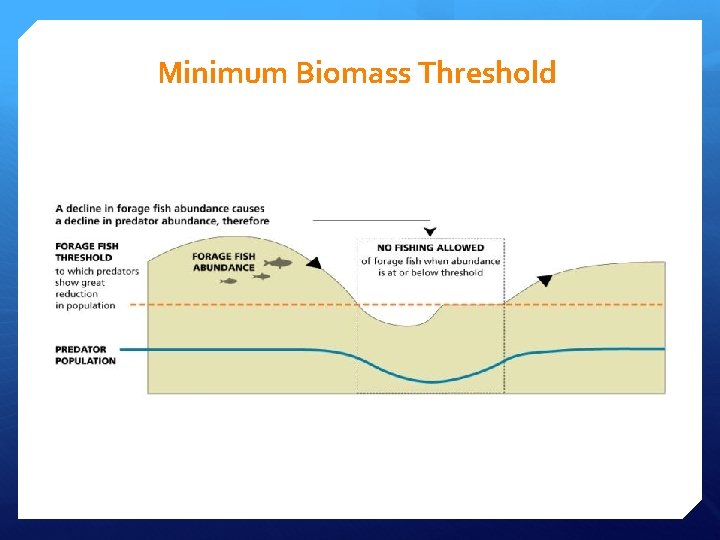
Minimum Biomass Threshold
Approximate locations of the 72 Ecopath models used in this analysis Pikitch, Rountos et al. 2012, Fish and Fisheries
Ecological Importance Seabirds 95% 39% Pinnipeds Cetaceans 10% 33% 62% Mackerel 83% Chondrichthyans 3% 15% Horse Mackerel Forage Fish Jumbo squid 29% Other large pelagics 22% Sea robin Hake 3% 28% Medium demersals Medium sciaenids 12% 46% Benthic elasmobranchs Flatfishes 16
Ecological Importance of Forage Species The Task Force found that 75% of the ecosystems studied have at least one highly or extremely dependent predator.
Economic Importance Mackerel Chondrichthyans Horse Mackerel Jumbo squid Forage Fish Hake Other large pelagics Medium demersals Medium sciaenids Benthic elasmobranchs Flatfishes
Economic Value of Forage Fish Direct value of commercial catch = $5. 6 billion Supportive commercial value = $11. 3 billion Total global commercial value = $16. 9 billion Value in 2006 dollars First ever estimate of total value of forage fish to all fisheries FORAGE FISH DIRECT VALUE FORAGE FISH SUPPORTIVE VALUE
Ecosim modeling approach • Ecosystem Modeling Setup • Ecosim with MSE Batch Module: Allows for examination of implementation error and a wide variety of harvest strategies • 10 Ecosystem models • 2 upwelling (N. Humboldt & Northern California) • 1 Semi Enclosed Sea (Baltic Sea) • 3 Non-Upwelling Coastal (Gulf of Mexico, North Sea, Western English Channel) • 3 Arctic-High Latitude (Aleutian Islands, Go. A, Barents) • 1 Estuaries/ Bay (Chesapeake Bay)
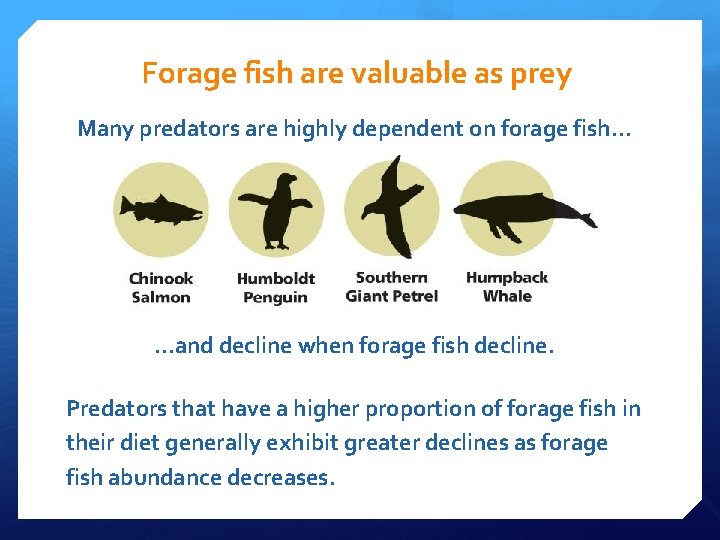
Forage fish are valuable as prey Many predators are highly dependent on forage fish. . . …and decline when forage fish decline. Predators that have a higher proportion of forage fish in their diet generally exhibit greater declines as forage fish abundance decreases.
Minimum Biomass Threshold
Results: Critical biomass levels Critical forage fish biomass needed to avoid a 50% decline in predators. Predator Diet (% forage fish) 25% 50% 75% Max Biomass needed (proportion of B 0) for 95% confidence of success All Seabirds groups 0. 79 0. 85 0. 88 0. 90 0. 74 0. 88 0. 90 0. 91 Results from PREP Equation (Predator Response to Exploitation of Prey): R = Predator Decline (as %); D = Diet Dependency (as a fraction of the total diet); B = Forage Fish Biomass
Comparing Fishing Strategies Six fishing strategies were compared using simulation models. Here we compare the most precautionary strategy with conventional management.
Only Precautionary Management Protects Predators and Fisheries
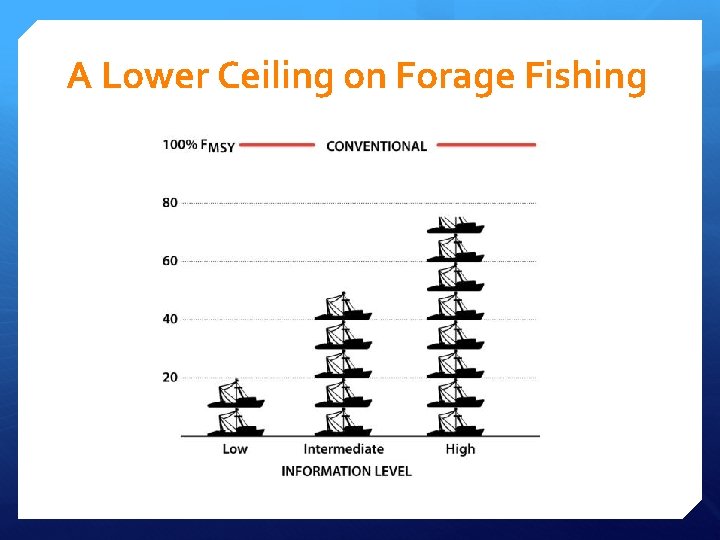
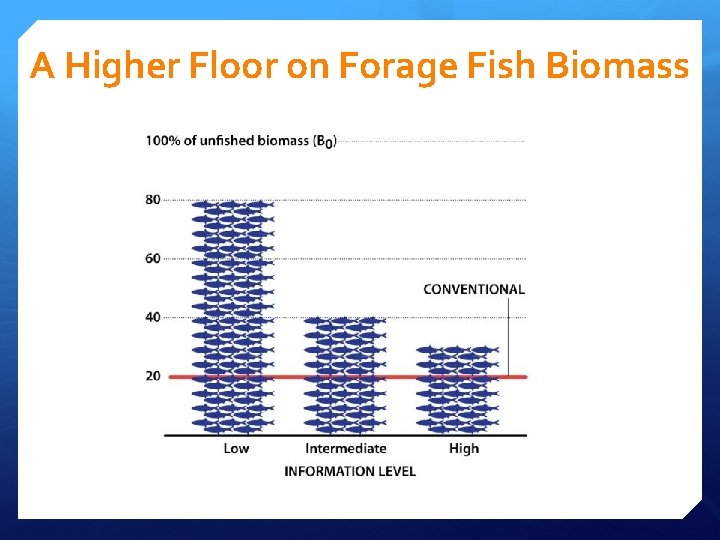
Key Recommendations Focus on predators Consider spatial & temporal management Cut forage fishing in half and leave twice as much fish in the ocean compared with conventional management in many ecosystems. Tailor management to available information
A Lower Ceiling on Forage Fishing
A Higher Floor on Forage Fish Biomass
Scope of Management Strategies Time and spacebased management fireflyafrica. blogspot. com Credit: themaxfiles. blogspot. com
Concluding Remarks Step toward ecosystem-based management Benefits both the ecosystem and fisheries Maintains ecological roles and support services Reduces risk of forage fishery collapse May increase catch of commercially valuable fish Positive incentives for increasing knowledge
Special Thanks To: Task Force Members Christine Santora, Project Director Konstantine Rountos Kristin Broms Tess Geers Natasha Gownaris Steve Munch David Conover Jesse Bruschini Shaily Rahman Joel Rice
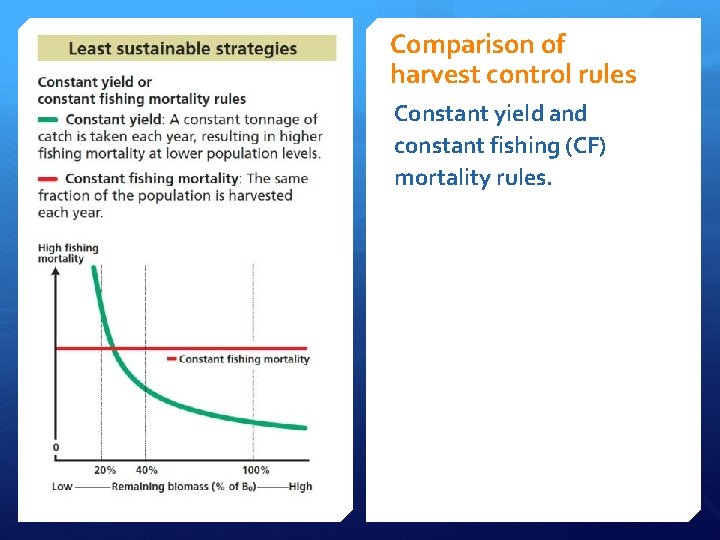
Comparison of harvest control rules Constant yield and constant fishing (CF) mortality rules.
Comparison of harvest control rules Biomass limit rules.
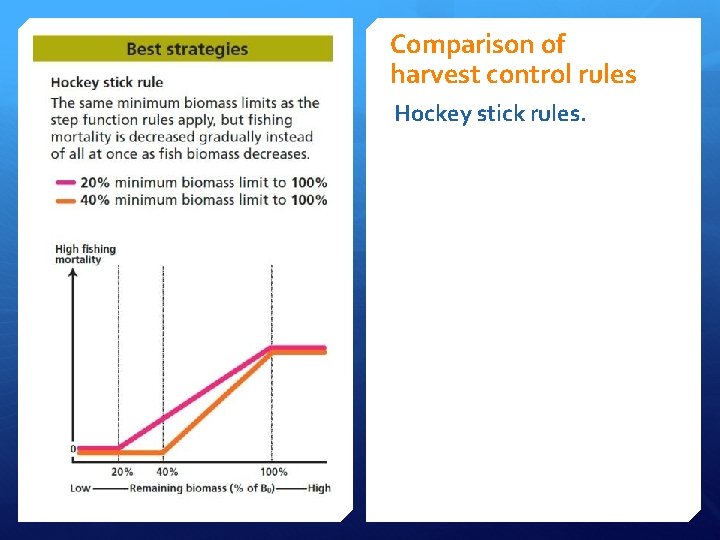
Comparison of harvest control rules Hockey stick rules.
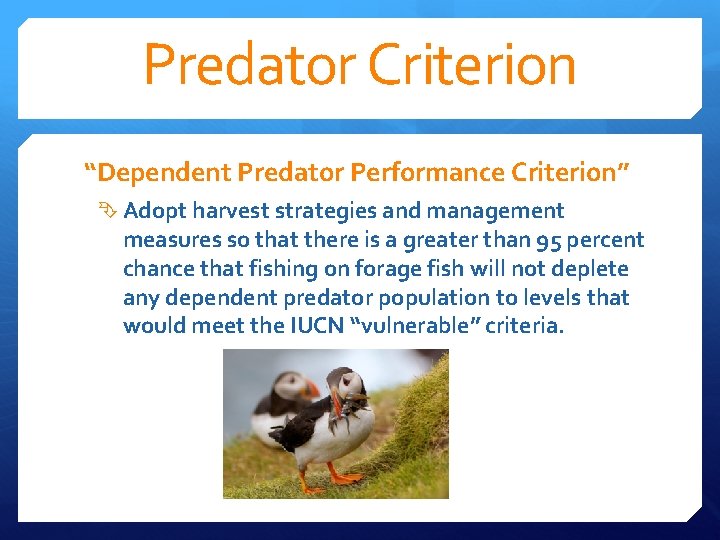
Predator Criterion “Dependent Predator Performance Criterion” Adopt harvest strategies and management measures so that there is a greater than 95 percent chance that fishing on forage fish will not deplete any dependent predator population to levels that would meet the IUCN “vulnerable” criteria.