2004 Training Seminars DSC Understanding DSC 1 Agenda


 (All DSC’s) • Temperature Calibration (All DSC’s) •")
 • Heat Flow Calibration of Differential Scanning • •")

 (All DSC’s) • Temperature Calibration (All DSC’s) •")

 (All DSC’s) • Temperature Calibration (All DSC’s) •")
 • Required to measure the absolute value of")

")

 • Get data table from UA • Calculate Cp constant @")
 • Type new value into calibration table")


 • Pan & lid weighs ~23 mg, bottom of pan")
 • Crimped pans are available in: ØAluminum - up to")
 • Pan & Lid weigh ~55 mg, bottom of pan is")
 • Hermetic Pans are available in: ØAluminum – <600°C; <3 atm")


 1 - If 100% crystalline and amorphous material is")


 2. For polymers, enthalpy values for 100% crystalline and")


- Slides: 86
2004 Training Seminars DSC Understanding DSC 1
Agenda • • • What does a DSC measure? How does a DSC make that measurement? How is a Tzero™ DSC different? Tzero Calibration Tzero Results Advanced Tzero
What Does a DSC Measure? A DSC measures the difference in heat flow rate (m. W = m. J/sec) between a sample and inert reference as a function of time and temperature
Endothermic Heat Flow • Heat Flow Ø Endothermic: heat flows into the sample as a result of either heat capacity (heating) or some endothermic process (glass transition, melting, evaporation, etc. )
Exothermic Heat Flow • Heat Flow Ø Exothermic: heat flows out of the sample as a result of either heat capacity (cooling) or some exothermic process (crystallization, cure, oxidation, etc. )
Temperature • What temperature is being measured and displayed by the DSC? ØSensor Temp: used by most DSCs. It is measured at the sample platform with a thermocouple, thermopile or PRT.
Temperature • What temperature is being measured and displayed by the DSC? ØPan Temp: calculated by TA Q 1000 based on pan material and shape § Uses weight of pan, resistance of pan, & thermoconductivity of purge gas ØWhat about sample temperature? § The actual temperature of the sample is never measured by DSC
Temperature • What other temperatures are not typically being displayed. ØProgram Temp: the set-point temperature is usually not recorded. It is used to control furnace temperature ØFurnace Temp: usually not recorded. It creates the temperature environment of the sample and reference
Understanding DSC Signals Heat Flow • Relative Heat Flow: measured by all DSCs except TA Q 1000. The absolute value of the signal is not relevant, only absolute changes are used. • Absolute Heat Flow: used by Q 1000. Dividing the signal by the measured heating rate converts the heat flow signal into a heat capacity signal
DSC Heat Flow
Tzero Heat Flow Equation Heat Flow Sensor Model Besides the three temperatures (Ts, Tr, T 0); what other values do we need to calculate Heat Flow? How do we calculate these?
Measuring the C’s & R’s • Tzero™ Calibration calculates the C’s & R’s • Calibration is a misnomer, THIS IS NOT A • CALIBRATION, but rather a measurement of the Capacitance (C) and Resistance (R) of each DSC cell After determination of these values, they can be used in the Four Term Heat Flow Equation showed previously
Measuring the C’s & R’s • Preformed using Tzero™ Calibration Wizard 1. Run Empty Cell 2. Run Sapphire on both Sample & Reference side
Measuring the C’s & R’s Empty DSC constant heating rate Assume: Heat balance equations give sensor time constants
Measuring the C’s & R’s Repeat first experiment with sapphire disks on sample and reference (no pans) Assume: Use time constants to calculate heat capacities
Measuring the C’s & R’s Use time constants and heat capacities to calculate thermal resistances
A few words about the Cs and Rs • The curves should be smooth and continuous, • • • without evidence of noise or artifacts Capacitance values should increase with temperature (with a decreasing slope) Resistance values should decrease with temperature (also with a decreasing slope) It is not unusual for there to be a difference between the two sides, although often they are very close to identical
Good Tzero™ Calibration Run
Bad Tzero™ Calibration Run Can see that it is bad during Tzero™ cal run
Before Running Tzero™ Calibration • System should be dry • Dry the cell and the cooler heat exchanger using the cell/cooler conditioning template and the default conditions (2 hrs at 75°C) with the cooler off ØPreferably enable the secondary purge ØDo not exceed 75°C cell temperature with the cooler off, although the time can be extended indefinitely
Stabilization before Calibration • System must be stable before Tzero™ • • Calibration Stabilization is achieved by cycling the baseline over the same temperature range and using the same heating rate as will be used for the subsequent calibration Typical systems will stabilize after 3 -4 cycles, 8 cycles recommended to ensure that the system has stabilized
Tzero™ Calibration Conditions • Normally, Heat Only calibration is all that is • • necessary Heating Rate should be 20°C/min Temperature Limits based on cooler type Ø RCS; – 90 to 400°C Ø LNCS; – 180 to 300°C • Use Diagnostic signals to improve troubleshooting capability
Enable and Select Diagnostic Signals Check this box!
Enable and Select Diagnostic Signals Select 1 -8 for an RCS or all of them for an LNCS More on Diagnostic Signals later
Example of Typical Results Characteristics of thermal resistances and heat capacities: Both curves should be smooth, with no steps, spikes or inflection points. Thermal resistances should always have negative slope that gradually decreases. Heat capacities should always have positive slope that gradually decreases. This cell is very well balanced. It is acceptable and usual to have larger differences between sample and reference.
Tzero™ vs Conventional Baseline
Indium with Q Series Heat Flow Signals Q 1000 Q 10
2004 Training Seminars DSC How to Get Better DSC Results 2
Agenda • • Keeping your DSC cell clean Calibration Sample Preparation Thermal Method
Agenda • • Keeping your DSC cell clean Calibration Sample Preparation Thermal Method
Keeping the DSC Cell Clean • One of the first steps to ensuring good data is to • keep the DSC cell clean How do DSC cells get dirty? ØDecomposing samples during DSC runs ØSamples spilling out of the pan ØTransfer from bottom of pan to sensor
How do we keep DSC cells clean? • DO NOT DECOMPOSE SAMPLES IN THE DSC CELL!!! • Run TGA to determine the decomposition • • • temperature ØStay below that temperature! Make sure bottom of pans stay clean Use lids Use hermetic pans if necessary
TGA Gives Decomposition Temperature
Cleaning Cell • If the cell gets dirty ØClean w/ brush § Brush gently both sensors and cell if necessary § Be careful with the Tzero™ thermocouple § Blow out any remaining particles
Brushing the Sample Sensor
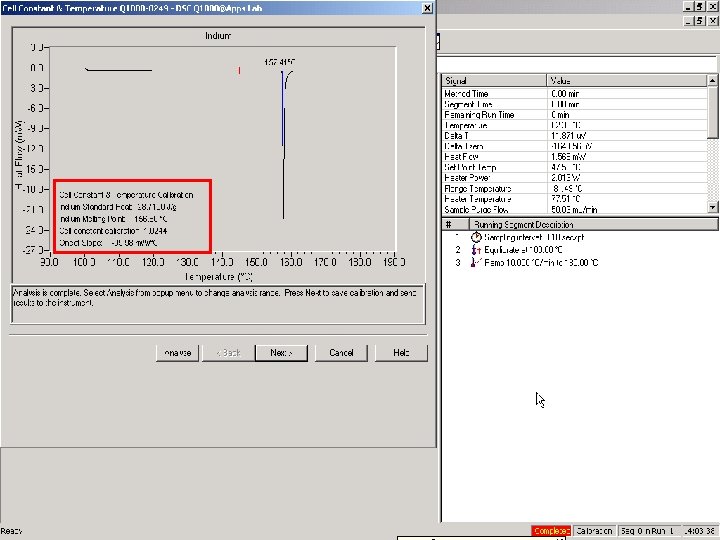
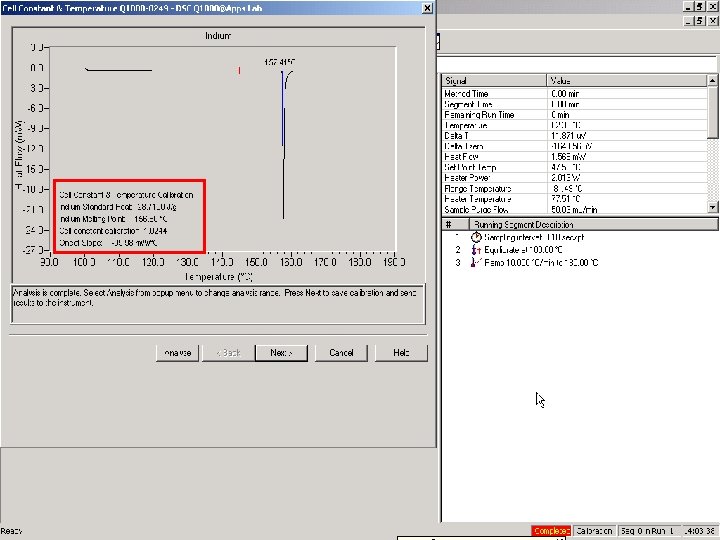
Calibration • Heat Flow (Cell Constant) (All DSC’s) • Temperature Calibration (All DSC’s) • Direct Cp (Q 1000)
Heat Flow Calibration (Cell Constant) • Heat Flow Calibration of Differential Scanning • • • Calorimeters – ASTM E-968 Enthalpy Calibration Performed using Calibration Wizard One Run ØIndium metal § § Sample Weight 1 -5 mg Pre-melt sample the first time you run it Heating rate of 10°C/min Dependent upon purge gas
Cell Constant • The cell constant is calculated as the ratio of theoretical heat of fusion of a standard material, to the measured heat of fusion • Cell Constant should be 0. 95 -1. 20 in N 2
Calibration • Heat Flow (Cell Constant) (All DSC’s) • Temperature Calibration (All DSC’s) • Direct Cp (Q 1000)
Temperature Calibration • Temperature Calibration of Differential • • • Scanning Calorimeters – ASTM E-967 Performed using Calibration Wizard Indium Cell constant run also performs temperature calibration Can do up to 5 standards ØPure metals typically used - In, Sn, Zn, Pb ØWe’ve found that on the Q series DSC’s one temperature calibration point is all that is usually needed
Calibration • Heat Flow (Cell Constant) (All DSC’s) • Temperature Calibration (All DSC’s) • Direct Cp (Q 1000)
Direct Cp Calibration (Q 1000 Only) • Required to measure the absolute value of Heat • • Capacity (Cp) with a single run Reset previous calibration value to 1. 0 Run standard material (sapphire) in standard mode, @ 10 -20°C/min Set to 1. 0
Direct Cp Calibration • The heat capacity calibration constant, K, is calculated as the ratio of theoretical heat capacity of a standard material, to the measured heat capacity of the material
Use sapphire encapsulated in pan Setup to do Cp Constant (Direct)
Direct Cp Calibration
Cp Constant (Direct) • Get data table from UA • Calculate Cp constant @ a single point or average values (see below)
Cp Constant (Direct) • Type new value into calibration table
Agenda • • Keeping your DSC cell clean Calibration Sample Preparation Thermal Method
Sample Pans • Type of pan depends onØSample form ØVolatilization ØTemperature range • Use lightest, flattest pan possible • Always use reference pan of the same type as sample pan
Standard DSC Pans (Crimped) • Pan & lid weighs ~23 mg, bottom of pan is flat • Used for solid non-volatile samples • Always use lid (see exceptions) ØLid improves thermal contact ØKeeps sample from moving • Exceptions to using a lid ØRunning oxidative experiment ØRunning PCA experiment
Standard DSC Pans (Crimped) • Crimped pans are available in: ØAluminum - up to 600°C ØCopper - up to 725°C (in N 2) ØGold - up to 725°C • Standard Pans without lids ØGraphite - up to 725°C (in N 2) ØPlatinum - up to 725°C
Hermetic Pans (Sealed) • Pan & Lid weigh ~55 mg, bottom of pan is not as • • • flat as std pans Used for liquid samples and samples with volatiles Always use lid (same exceptions as before) After sealing pans, should form dome
Hermetic Pans (Sealed) • Hermetic Pans are available in: ØAluminum – <600°C; <3 atm (300 k. Pa gage) ØAlodined Aluminum - <600°C; <3 atm (300 k. Pa gage) § (For aqueous samples) ØGold – <725°C, <6 atm (600 k. Pa gage) • Specialized Sealed Pans ØHigh Volume - 100µL; <250°C; 600 psig(4. 1 MPa) ØHigh Pressure - 35µL; <300°C; 1450 psig(10 MPa) • Note: 3 atm is approximately 44 psig
It Does Matter What Pan you use Monohydrate Pharmaceutical sample
Sample Shape • Keep sample thin • Cover as much as the bottom of pan as possible
Sample Shape • Cut sample to make thin, don’t crush • If pellet, cut cross section
Sample Shape • Cut sample to make thin, don’t crush • If pellet, cut cross section • If powder, spread evenly over the bottom of the pan
Using Sample Press • When using crimped pans, don’t over crimp • Bottom of pan should remain flat after crimping Crimped Pans Hermetic Pans Good Not Sealed Bad • When using Hermetic pans, a little more • pressure is needed Hermetic pans are sealed by forming a cold wield on the Aluminum pans
Sample Size • Larger samples will increase sensitivity • but……………. Larger samples will decrease resolution • Goal is to have heat flow of 0. 1 -10 m. W going through a transition
Sample Size • Sample size depends on what you are measuring ØIf running an extremely reactive sample (like an explosive) run very small samples (<1 mg) ØPure organic materials, pharmaceuticals (1 -5 mg) ØPolymers - ~10 mg ØComposites – 15 -20 mg
Effect of Sample Size on Indium Melt
Agenda • • Keeping your DSC cell clean Calibration Sample Preparation Thermal Method
Purge Gas • Purge gas should always be used during DSC • experiments ØProvides dry, inert atmosphere ØEnsures even heating ØHelps sweep away any off gases that might be released Nitrogen ØMost common ØIncreases Sensitivity ØTypical flow rate of 50 ml/min
Purge Gas • Helium ØMust be used with LNCS ØHigh Thermo-conductivity ØIncreases Resolution ØUpper temp limited to 350°C ØTypical flow rate of 25 ml/min • Air or Oxygen ØUsed to view oxidative effects ØTypical flow rate of 50 ml/min
Sample Temperature Range • Rule of Thumb ØHave 2 -3 minutes of baseline before and after transitions of interest - if possible § DO NOT DECOMPOSE SAMPLES IN DSC CELL ØTemperature range can affect choice of pans ØJust because the instrument has a temperature range of – 90°C to 550°C (with RCS) doesn’t mean you need to heat every sample to 550°!
Start-up Hook
Heating Rate • Faster heating rates increase sensitivity • but……………. Faster heating rates decrease resolution • Good starting point is 10°C/min
Effect of Heating Rate PMMA 10. 04 mg
Thermal History • The thermal history of a sample can and will • affect the results The cooling rate that the sample undergoes can affect : Ø Crystallinity of semi-crystalline materials Ø Enthalpic recovery at the glass transition • Run Heat-Cool Heat experiments to see effect of & eliminate thermal history Ø Heat at 10°C/min Ø Cool at 10°C/min Ø Heat at 10°C/min
Heat-Cool-Heat of PET
2004 Training Seminars DSC Calculating % Crystallinity from the Latent Heat of Fusion 6
Calculating % Crystallinity Background • DSC or MDSC® measure the energy required (latent heat of fusion) to convert crystalline structure to amorphous structure at that temperature. • The heat of fusion is temperature dependent; i. e. , it takes more heat to melt crystalline structure at higher temperatures. • The increase in the heat of fusion with temperature is due to the difference in the heat capacity curves for amorphous and crystalline material. • In order to correctly calculate % crystallinity from the heat of fusion requires a knowledge of how the heat of fusion changes with temperature.
Calculating % Crystallinity (cont. ) 1 - If 100% crystalline and amorphous material is available, create Cp and enthalpy plots from measured heat flow Ø Enthalpy plots are obtained by measuring the absolute integral of a Cp plot over some temperature range Ø All enthalpy plots are normalized to the same value (J/g) at a convenient temperature above the melting point where all samples should theoretically be the same because all have the same liquid structure (mobile amorphous) Ø See Figures 1 -3
Enthalpy Plots Are Integrals of Heat Capacity Plots Integrals of 100% Crystalline and 100% Amorphous Heat Capacity Curves Can Be Used to Create an Enthalpy Plot Figure 1 Drug 3. 75 mg MDSC®. 159/60/1
Figure 2 Effect of the Temperature-Dependence of the Heat of Fusion on Crystallization and Melting Peak Areas for a Drug
The Enthalpy Plot Can Be Used to Calculate % Crystallinity Illustrating the Temperature Dependence of the Heat of Fusion on the Monohydrate Form of the Drug Figure 3
Calculating % Crystallinity (cont. ) 2. For polymers, enthalpy values for 100% crystalline and 3. 100% amorphous structure available from ATHAS Databank as a function of temperature Ø See ATHAS Figures Calculate % Crystallinity by dividing measured heat of fusion by the difference (*) in enthalpy for 100% crystalline and 100% amorphous structure at that temperature (Fig. 4) % Crystallinity = 37/113* 33 b % @ 160ºC *113 J/g = Heat of Fusion = (88323 a – 66589 a) J/mole 192 a g/mole a = values obtained from ATHAS Databank note b; use of 140 J/g for H = 26% Crystallinity
ATHAS – Page 1
ATHAS - Page 2 These are the Major Polymer Categories for ATHAS
ATHAS – Page 3 Each Polymer Category has a Sub-listing
ATHAS – Page 4
ATHAS – Page 5 ----------- Calculate g/mole from molecular structure which equals 192 g/mole for PET Convert ºK to ºC Specific Heat Capacity Absolute Enthalpy
ATHAS – Page 6 -----------
Figure 4; % Crystallinity of PET @160 °C Use of ATHAS Databank to Calculate % Crystallinity on 12. 64 mg Sample of Quench Cooled PET after Cold Crystallization 20°C/min