
2004 Training Seminars DSC MDSC What its all


- Slides: 37
2004 Training Seminars DSC MDSC® What it’s all about & how to get better results 5
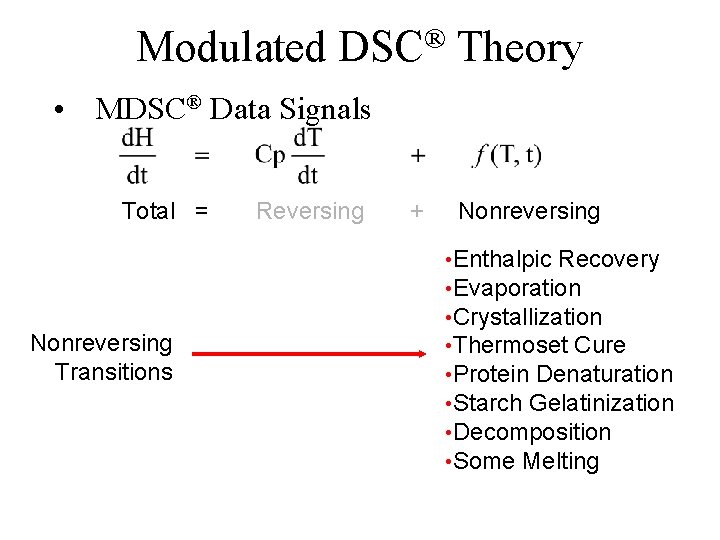
What Does MDSC® Measure? • MDSC separates the Total heat flow of DSC into two parts based on the heat flow that does and does not respond to a changing heating rate • MDSC applies a changing heating rate on top of a linear heating rate in order measure the heat flow that responds to the changing heating rate • In general, only heat capacity and melting respond to the changing heating rate. • The Reversing and Nonreversing signals of MDSC should never be interpreted as the measurement of reversible and nonreversible properties
Modulated ® DSC Theory • MDSC® uses two simultaneous heating rates – Average Heating Rate • This gives Total Heat Flow data which is equivalent to standard DSC @ same average heating rate – Modulated Heating Rate • Purpose is to obtain heat capacity information at the same time as heat flow
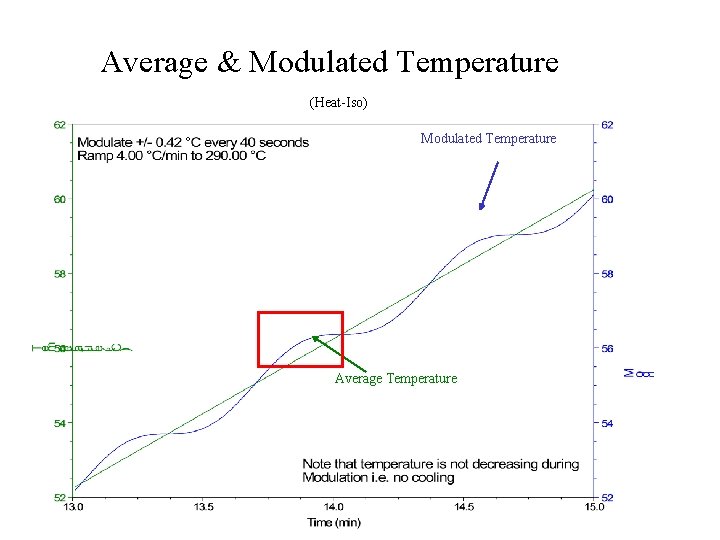
Average & Modulated Temperature (Heat-Iso) Modulated Temperature Average Temperature
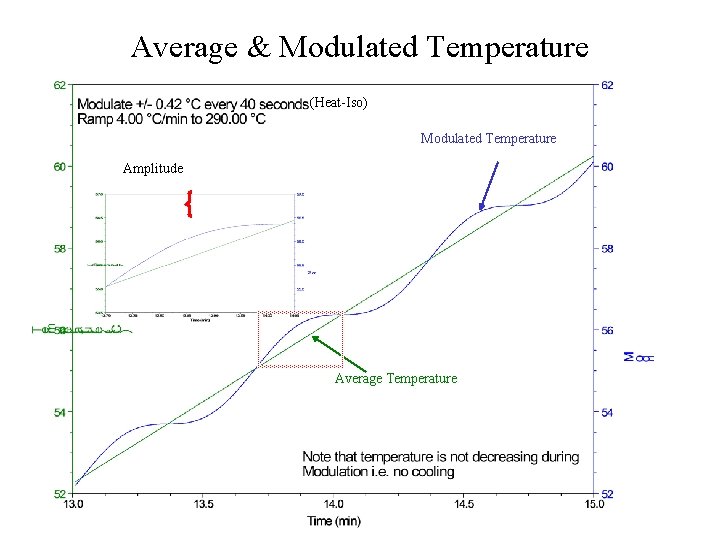
Average & Modulated Temperature (Heat-Iso) Modulated Temperature Amplitude Average Temperature
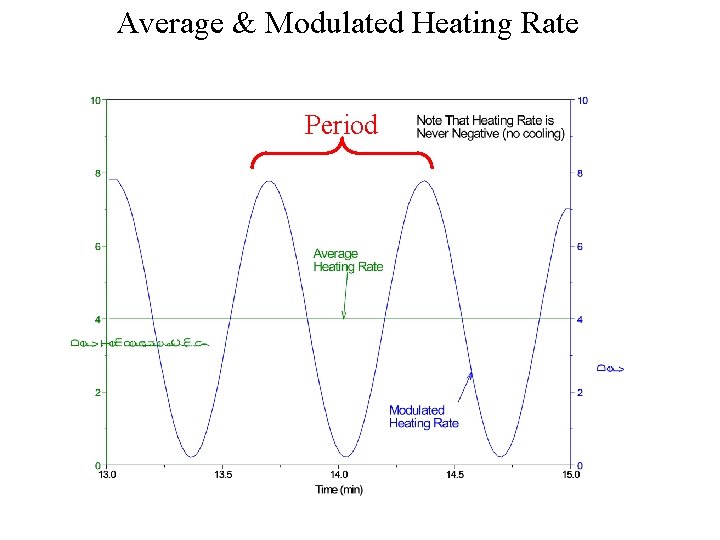
Average & Modulated Heating Rate Period
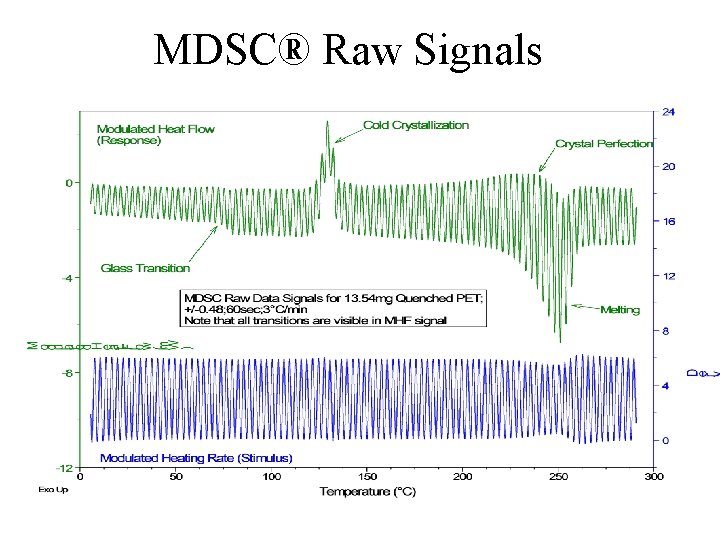
MDSC® Raw Signals
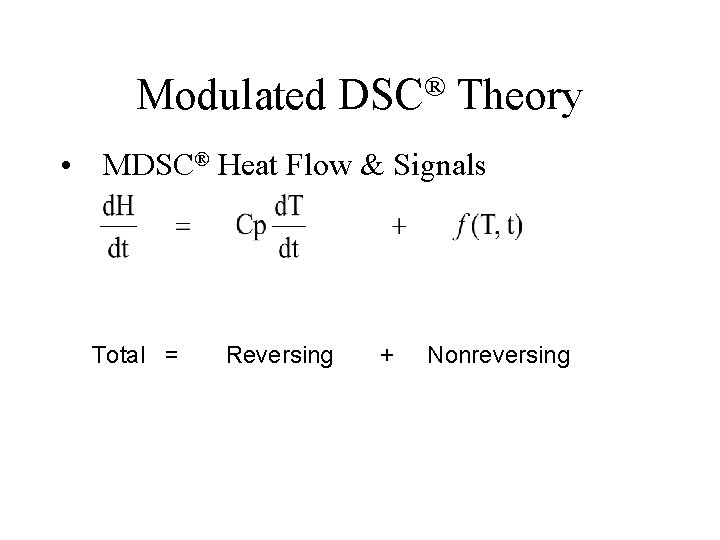
Modulated ® DSC Theory • MDSC® Heat Flow & Signals Total = Reversing + Nonreversing
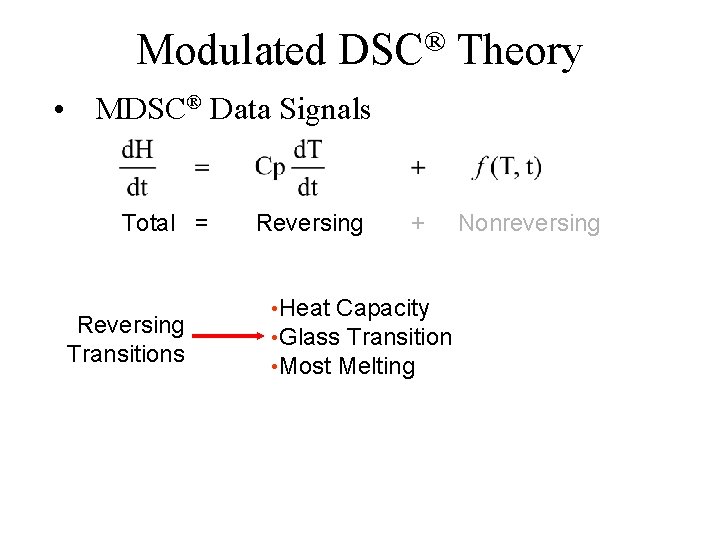
Modulated ® DSC Theory • MDSC® Data Signals Total = Reversing Transitions Reversing + • Heat Capacity • Glass Transition • Most Melting Nonreversing
Modulated ® DSC Theory • MDSC® Data Signals Total = Nonreversing Transitions Reversing + Nonreversing • Enthalpic Recovery • Evaporation • Crystallization • Thermoset Cure • Protein Denaturation • Starch Gelatinization • Decomposition • Some Melting
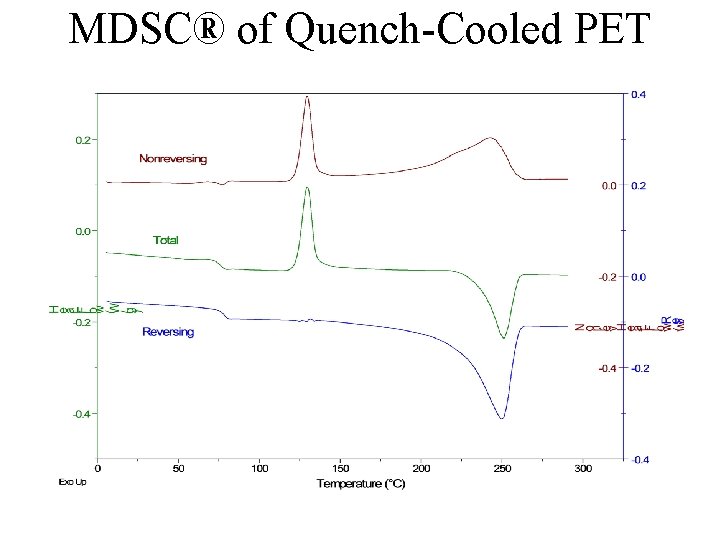
MDSC® of Quench-Cooled PET
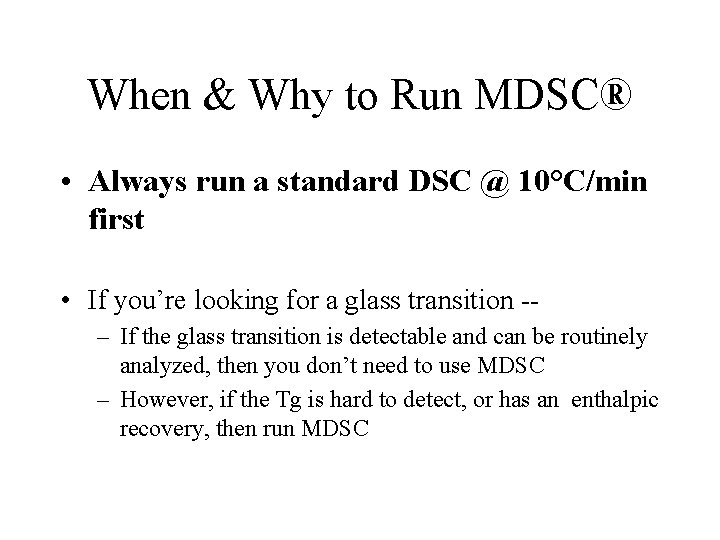
When & Why to Run MDSC® • Always run a standard DSC @ 10°C/min first • If you’re looking for a glass transition -– If the glass transition is detectable and can be routinely analyzed, then you don’t need to use MDSC – However, if the Tg is hard to detect, or has an enthalpic recovery, then run MDSC
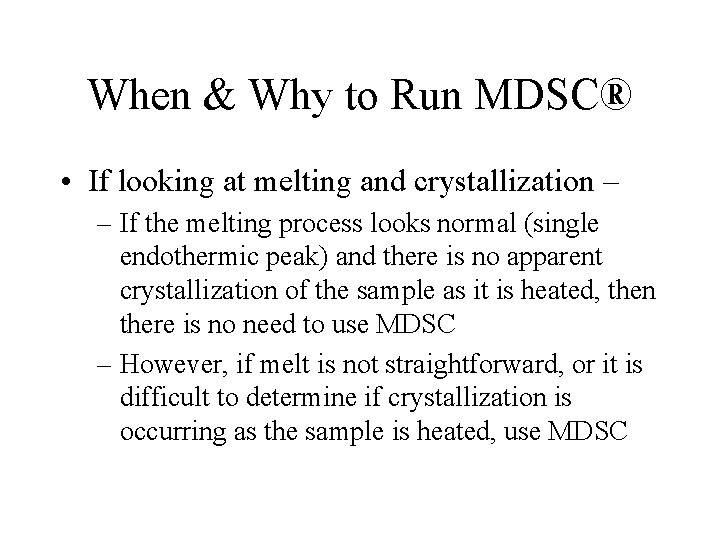
When & Why to Run MDSC® • If looking at melting and crystallization – – If the melting process looks normal (single endothermic peak) and there is no apparent crystallization of the sample as it is heated, then there is no need to use MDSC – However, if melt is not straightforward, or it is difficult to determine if crystallization is occurring as the sample is heated, use MDSC
When & Why to Run MDSC® • If you want heat capacity (Cp) – run MDSC – To get Cp by normal DSC (Q 1000 is an exception due to Direct Cp) • Use High heating rates, >10°C/min • Three experiments required – Baseline – Reference (sapphire) – Sample
The Natural Limitations of DSC • The next several slides discuss some of the natural limitations of DSC & how they are solved by MDSC®. This is by no means a complete list, just some of the more significant limitations.
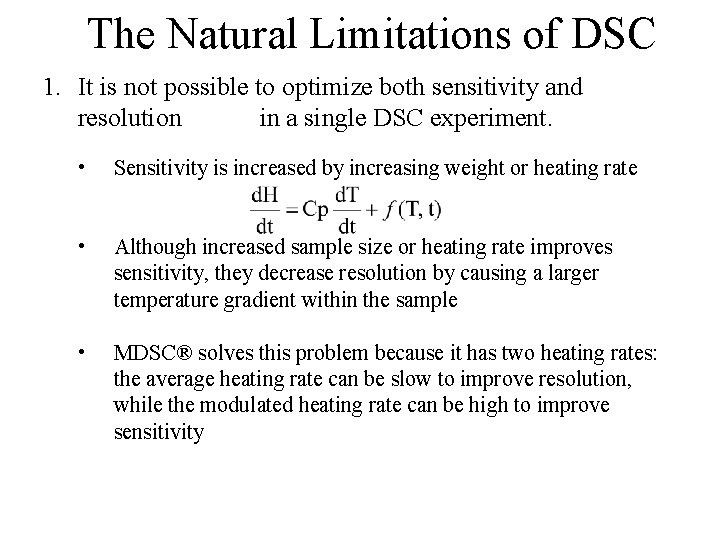
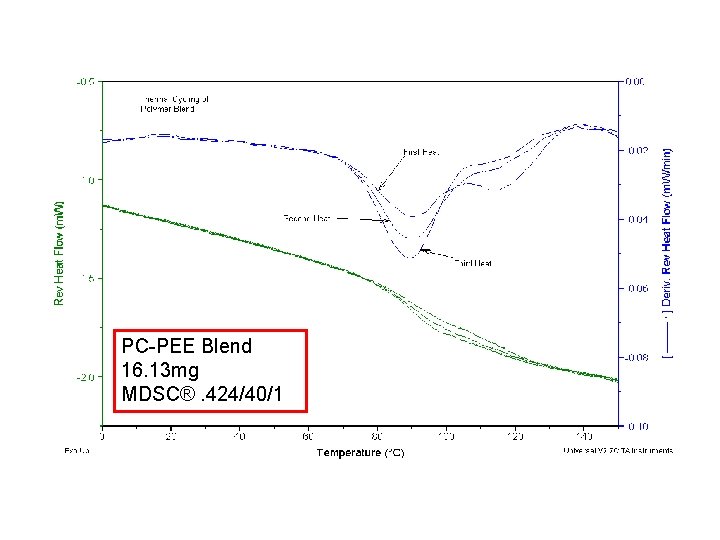
The Natural Limitations of DSC 1. It is not possible to optimize both sensitivity and resolution in a single DSC experiment. • Sensitivity is increased by increasing weight or heating rate • Although increased sample size or heating rate improves sensitivity, they decrease resolution by causing a larger temperature gradient within the sample • MDSC® solves this problem because it has two heating rates: the average heating rate can be slow to improve resolution, while the modulated heating rate can be high to improve sensitivity
Sensitivity & Resolution PC-PEE Blend 16. 13 mg MDSC®. 424/40/1
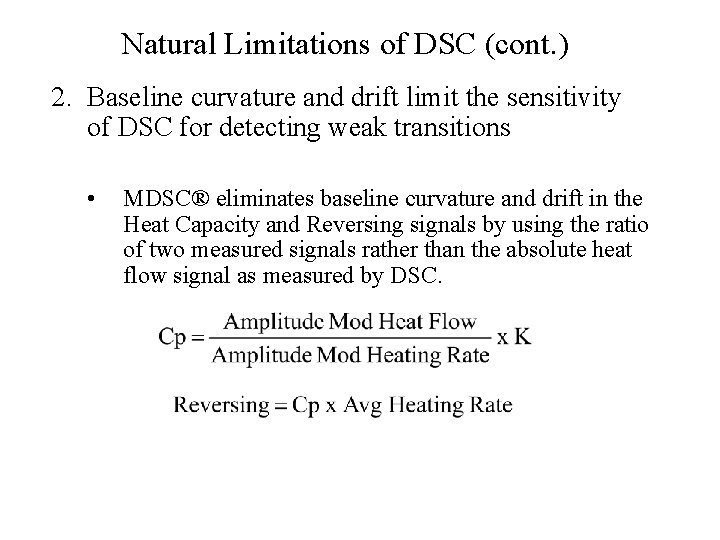
Natural Limitations of DSC (cont. ) 2. Baseline curvature and drift limit the sensitivity of DSC for detecting weak transitions • MDSC® eliminates baseline curvature and drift in the Heat Capacity and Reversing signals by using the ratio of two measured signals rather than the absolute heat flow signal as measured by DSC.
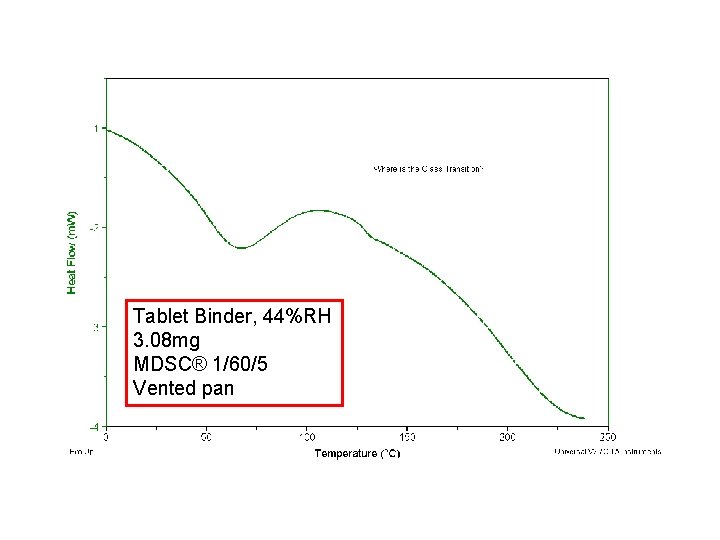
Where’s the Tg? Tablet Binder, 44%RH 3. 08 mg MDSC® 1/60/5 Vented pan
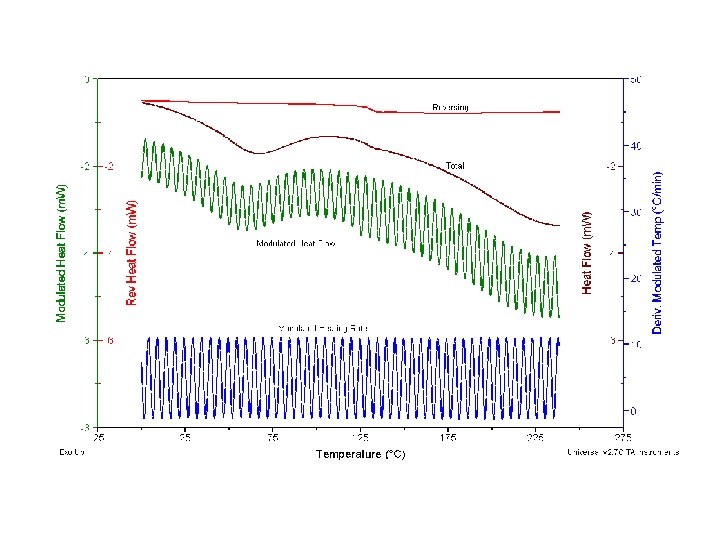
Here’s the Tg!
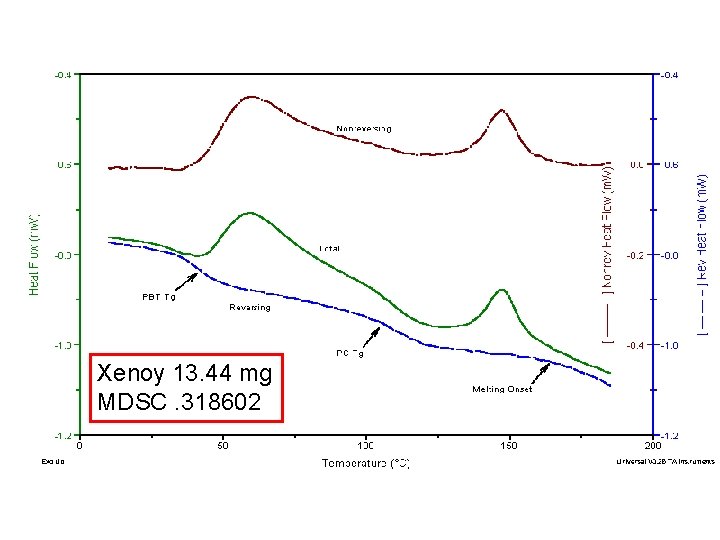
Natural Limitations of DSC (cont. ) 3. Transitions are often difficult to interpret because DSC can only measure the Sum of Heat Flow within the Calorimeter • MDSC® minimizes this problem by providing not only the Total Heat Flow signal but also the heat capacity and kinetic components of it
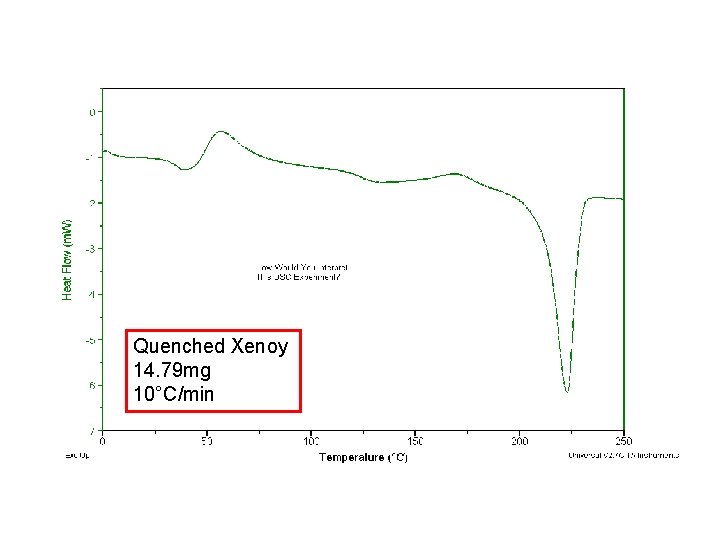
Complicated Example Quenched Xenoy 14. 79 mg 10°C/min
® MDSC Xenoy 13. 44 mg MDSC. 318602 Aids Interpretation
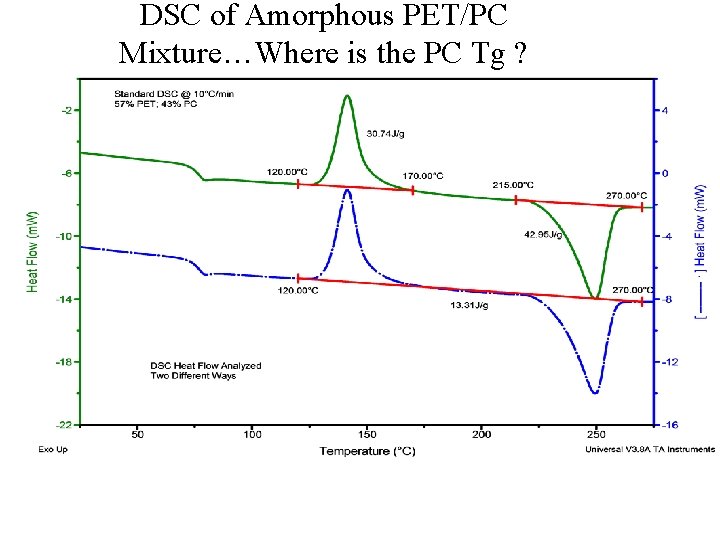
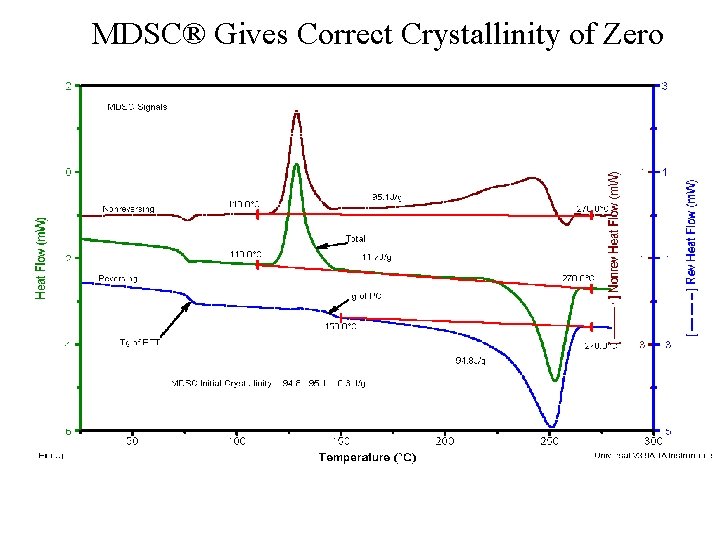
Natural Limitations of DSC (cont. ) 4. It is often difficult to accurately measure the crystallinity of polymers by DSC because the crystallinity increases as the sample is being heated in the DSC cell. – To measure the correct crystallinity requires the ability to: • determine the true heat capacity (no transitions) baseline • quantitatively measure how much crystallinity developed during the heating process
DSC of Amorphous PET/PC Mixture…Where is the PC Tg ?
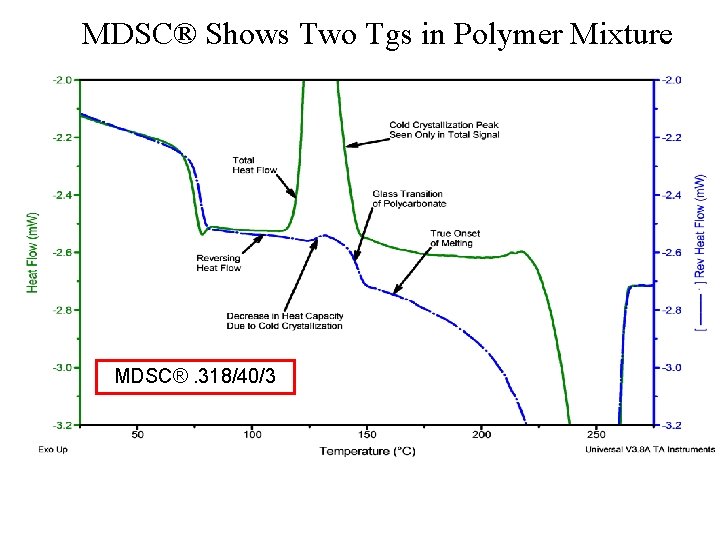
MDSC® Shows Two Tgs in Polymer Mixture MDSC®. 318/40/3
MDSC® Gives Correct Crystallinity of Zero
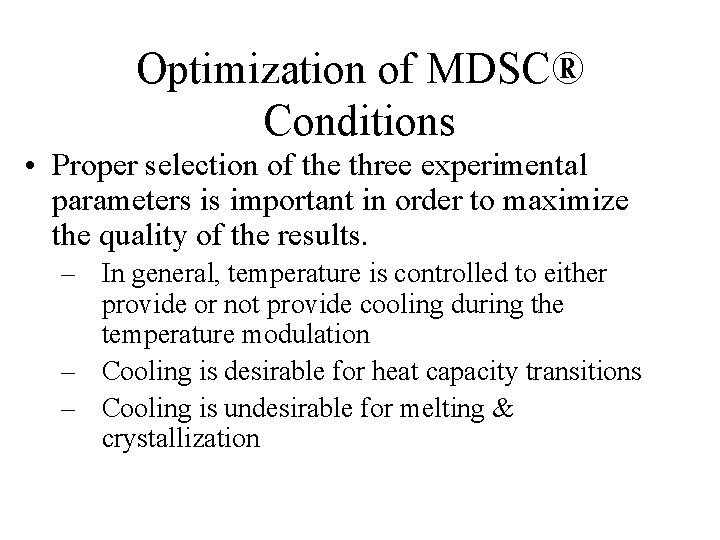
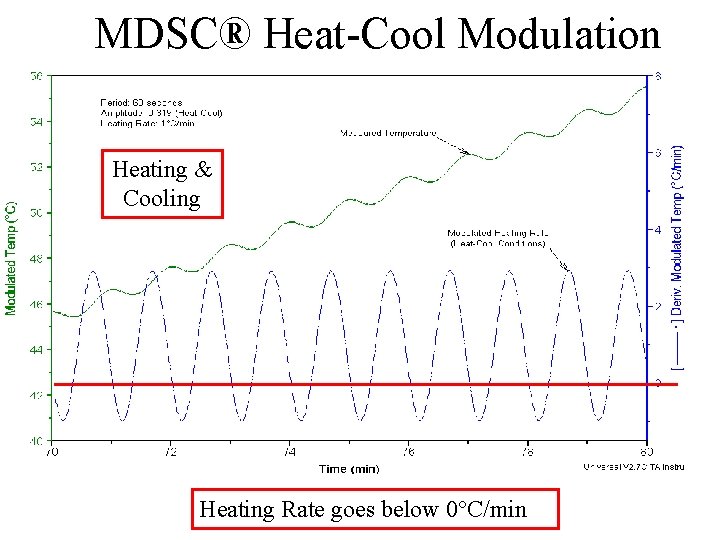
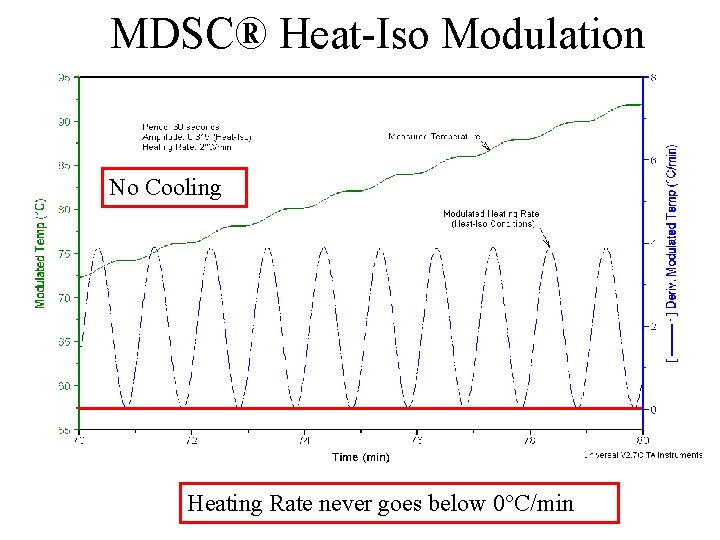
Optimization of MDSC® Conditions • Proper selection of the three experimental parameters is important in order to maximize the quality of the results. – In general, temperature is controlled to either provide or not provide cooling during the temperature modulation – Cooling is desirable for heat capacity transitions – Cooling is undesirable for melting & crystallization
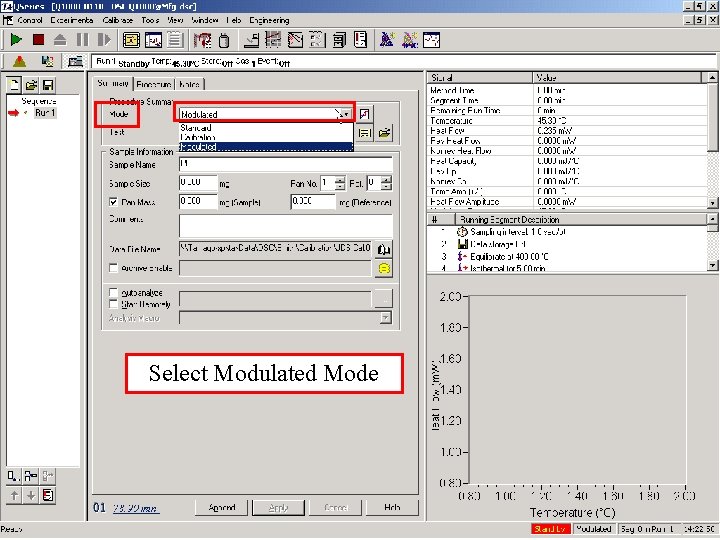
Select Modulated Mode
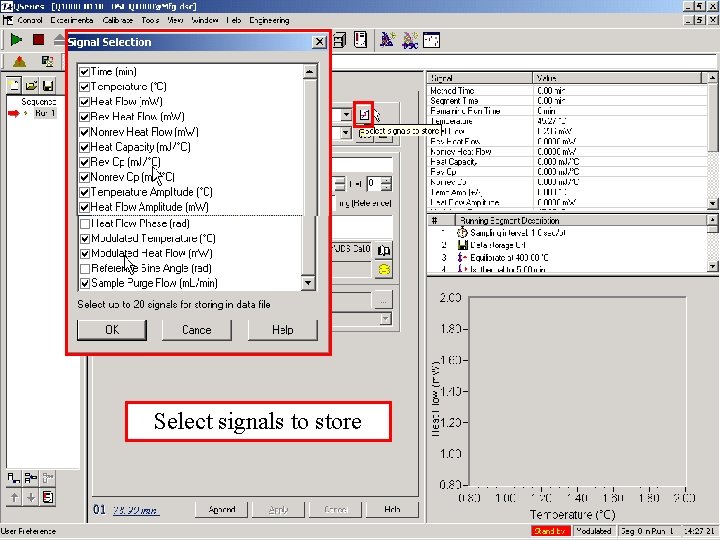
Select signals to store
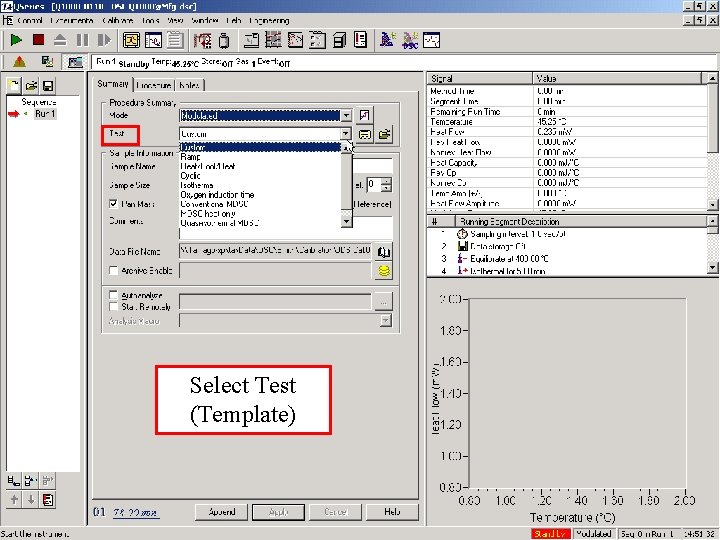
Select Test (Template)
MDSC® Heat-Cool Modulation Heating & Cooling Heating Rate goes below 0°C/min
MDSC® Heat-Iso Modulation No Cooling Heating Rate never goes below 0°C/min
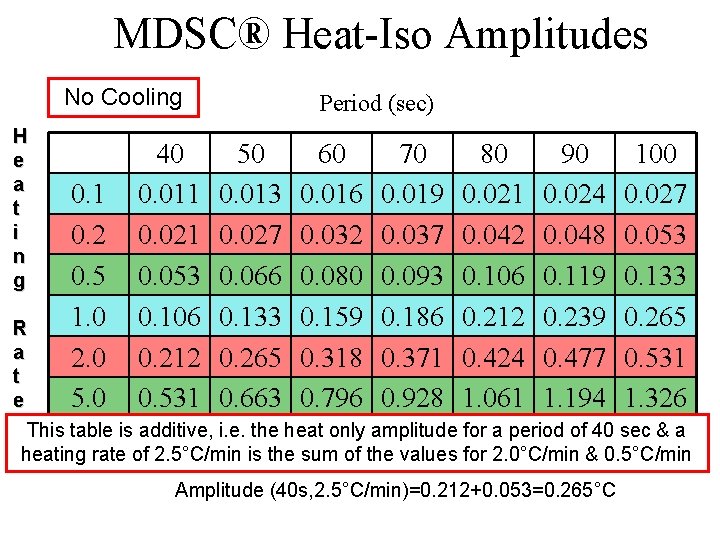
MDSC® Heat-Iso Amplitudes No Cooling H e a t i n g 0. 1 0. 2 0. 5 1. 0 2. 0 5. 0 40 0. 011 0. 021 0. 053 0. 106 0. 212 0. 531 Period (sec) 50 0. 013 0. 027 0. 066 0. 133 0. 265 0. 663 60 0. 016 0. 032 0. 080 0. 159 0. 318 0. 796 70 0. 019 0. 037 0. 093 0. 186 0. 371 0. 928 80 0. 021 0. 042 0. 106 0. 212 0. 424 1. 061 90 0. 024 0. 048 0. 119 0. 239 0. 477 1. 194 100 0. 027 0. 053 0. 133 0. 265 0. 531 1. 326 R a t e This table is additive, i. e. the heat only amplitude for a period of 40 sec & a heating rate of 2. 5°C/min is the sum of the values for 2. 0°C/min & 0. 5°C/min Amplitude (40 s, 2. 5°C/min)=0. 212+0. 053=0. 265°C
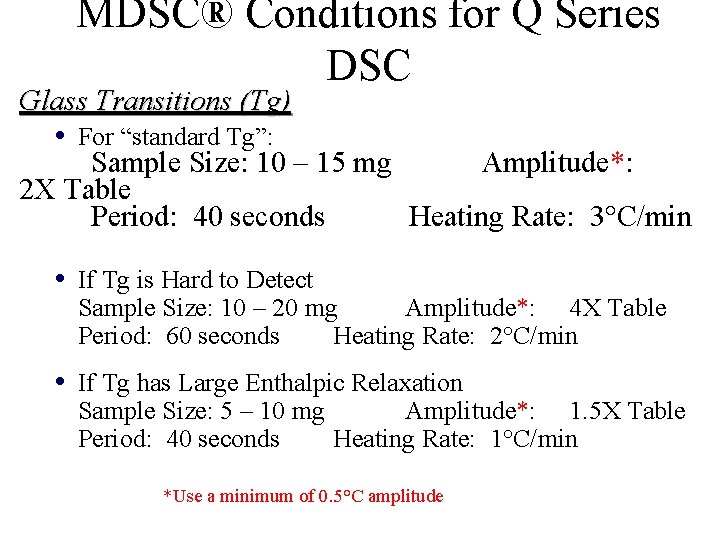
MDSC® Conditions for Q Series DSC Glass Transitions (Tg) • For “standard Tg”: Sample Size: 10 – 15 mg Amplitude*: 2 X Table Period: 40 seconds Heating Rate: 3°C/min • If Tg is Hard to Detect Sample Size: 10 – 20 mg Amplitude*: 4 X Table Period: 60 seconds Heating Rate: 2°C/min • If Tg has Large Enthalpic Relaxation Sample Size: 5 – 10 mg Amplitude*: 1. 5 X Table Period: 40 seconds Heating Rate: 1°C/min *Use a minimum of 0. 5°C amplitude
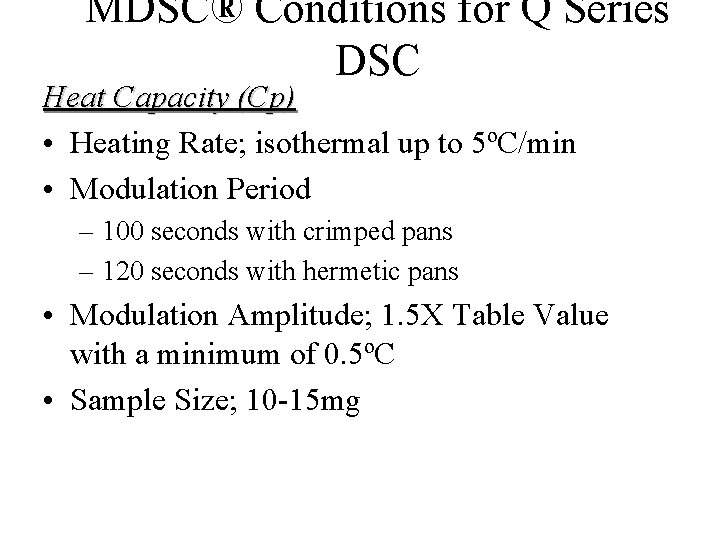
MDSC® Conditions for Q Series DSC Heat Capacity (Cp) • Heating Rate; isothermal up to 5ºC/min • Modulation Period – 100 seconds with crimped pans – 120 seconds with hermetic pans • Modulation Amplitude; 1. 5 X Table Value with a minimum of 0. 5ºC • Sample Size; 10 -15 mg
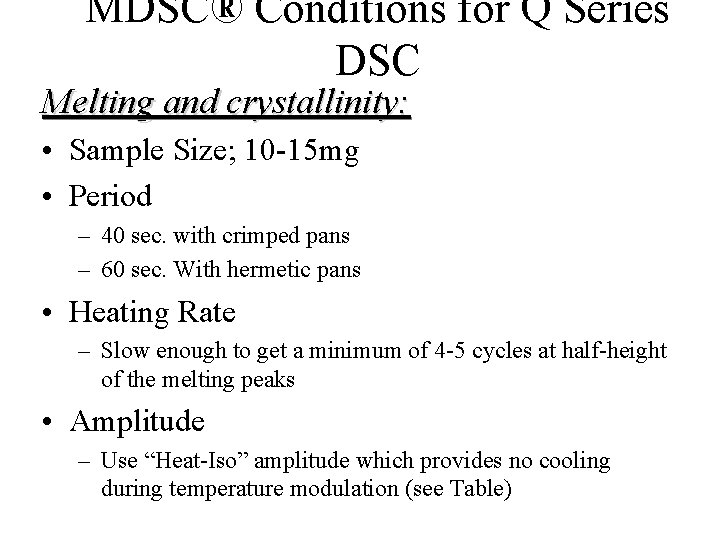
MDSC® Conditions for Q Series DSC Melting and crystallinity: • Sample Size; 10 -15 mg • Period – 40 sec. with crimped pans – 60 sec. With hermetic pans • Heating Rate – Slow enough to get a minimum of 4 -5 cycles at half-height of the melting peaks • Amplitude – Use “Heat-Iso” amplitude which provides no cooling during temperature modulation (see Table)