Thermal Analysis Differential Scanning Calorimetry DSC Measure heat
 – Measure heat absorbed or liberated during heating")
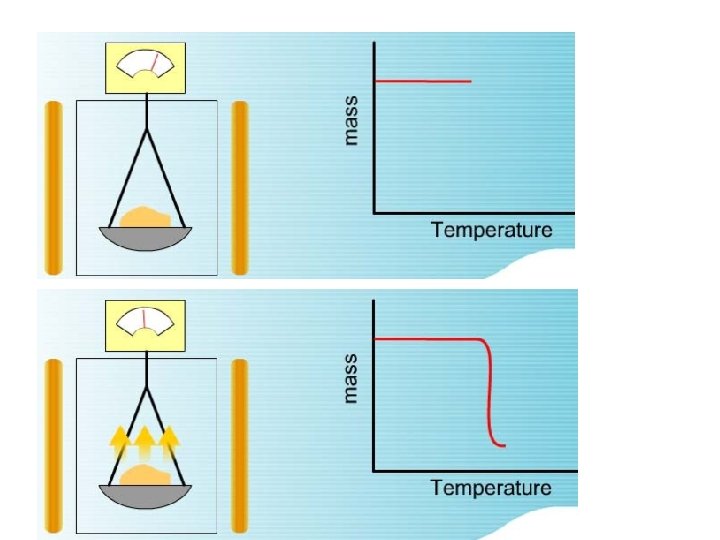
 Monitor change in mass of sample")


 » Measure sample temperature relative to a reference, for the")


 Differential scanning calorimetry or DSC is a thermoanalytical technique in")
- Slides: 11
Thermal Analysis Differential Scanning Calorimetry (DSC) – Measure heat absorbed or liberated during heating or cooling Differential Thermal analysis (DTA) - Measure temperature difference between the sample and reference. Thermal Gravimetric Analysis (TGA) – Measure change in weight during heating or cooling
Thermogravimetric analysis (TGA) Monitor change in mass of sample
Sample: can be both solid &liquid; 2 -25 mg Gas atmosphere: Ca. CO 3 →Ca. O + CO 2 In vacuum, decompose at ~500ºC In air, decompose at ~700ºC In CO 2, ~900ºC
Draw tangents of the curve to find the onset and the offset points
Thermal profiles for some common polymers
Differential Thermal analysis (DTA) » Measure sample temperature relative to a reference, for the same heat transferred Thermal events: Exothermic event and endothermic event Reaction/decomposition, Melting, Crystallization, Change in crystal structure Glass transition
DTA Combined with TGA * The area under a DTA peak is the enthalpy change Lowering heating rate; Reducing sample weight sharper peaks with improved resolution
It is clear that ABS degrades in two steps. The first step initiates at 180 ºC and ends at 480 ºC and the second step from 480 until 620 ºC. From the DTA curve, at least three peaks can be observed overlapping each other for the first degradation step, this means that the first degradation is not a simple chemical reaction but several reactions occurring simultaneously. Suzuki et al. applied thermogravimetry/Fourier transform infrared (TGA/FTIR) to investigate the degradation of ABS and they found that the evolution of butadiene commenced at 340 ºC and styrene at 350 ºC, while the evolution of monomeric acrylonitrile began at 400 ºC.
Differential scanning calorimetric (DSC) Differential scanning calorimetry or DSC is a thermoanalytical technique in which the difference in the amount of heat required to increase the temperature of a sample and reference are measured as a function of temperature. DTA DSC