Value at Risk Modelling for Energy Commodities using






- Slides: 58
Value at Risk Modelling for Energy Commodities using Volatility Adjusted Quantile Regression Energy Finance Conference Essen Thursday 10 th October 2013 Sjur Westgaard Email: sjur. westgaard@iot. ntnu. no Tel: 73593183 / 91897096 Web: www. iot. ntnu. no/users/sjurw Department of Industrial Economics Norwegian University of Science and Technology 1
Professor Sjur Westgaard Department of Industrial Economics and Technology Management, Norwegian University of Science and Technology (NTNU) Alfred Getz vei 3, NO-7491 Trondheim, Norway www. ntnu. no/iot Mail: sjur. westgaard@iot. ntnu. no Web: www. iot. ntnu. no/users/sjurw Phone: +47 73598183 or +47 91897096 Sjur Westgaard is MSc and Phd in Industrial Economics from Norwegian University of Science and Technology and a MSc in Finance from Norwegian School of Business and Economics. He has worked as an investment portfolio manager for an insurance company, a project risk manager for a consultant company and as a credit analyst for an international bank. His is now a Professor at the Norwegian University of Science and Technology and an Adjunct Professor at the Norwegian Center of Commodity Market Analysis UMB Business School. His teaching involves corporate finance, derivatives and real options, empirical finance and commodity markets. His main research interests is within risk modelling of energy markets and he has been a project manager for two energy research projects involving power companies and the Norwegian Research Consil. He has also an own consultancy company running executive courses and software implementations for energy companies. Part of this work is done jointly with Montel. 2
Trondheim 3
www. montelpowernews. com 4
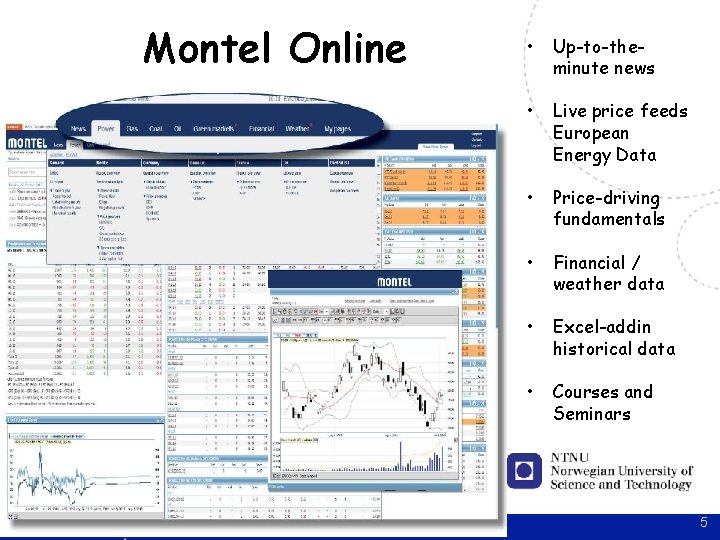
Montel Online • Up-to-theminute news • Live price feeds European Energy Data • Price-driving fundamentals • Financial / weather data • Excel-addin historical data • Courses and Seminars 5
Why Value at Risk Modelling for Energy Commodities using Volatility Adjusted Quantile Regression? • From Burger et al. (2008)*: – Liberalisation of energy markets (oil, gas, coal, el, carbon) has fundamentally changed the way power companies do business – Competition has created both strong incentives for improving operational efficiency and as well as the need for effective financial risk management * Burger, M. , Graeber B. , Schindlmayr, G. 2008, Managing energy risk – An integrated view on power and other energy markets, Wiley. 6 6
Why Value at Risk Modelling for Energy Commodities using Volatility Adjusted Quantile Regression? • More volatile energy markets and complex trading/hedging portfolios (long and short positions) has increased the need for measuring risk at • Individual contract level • Portfolio of contracts level • Enterprise level • Understanding the dynamics and determinants of volatility and risk (e. g. Value at Risk and Expected Shortfall) for energy commodities are therefore crucial. • We therefore need to correctly model and forecast the return distribution for energy futures markets 7 7
Why Value at Risk Modelling for Energy Commodities using Volatility Adjusted Quantile Regression? • Oil/Gas. Oil/Natural Gas/Coal/Carbon/Electricity from ICE, EEX, Nasdaq OMX shows: • Conditional return distributions various across energy commodities • Conditional return distributions for energy commodities varies over time • This makes risk modelling of energy futures markets very challenging! 8
Why Value at Risk Modelling for Energy Commodities using Volatility Adjusted Quantile Regression? • The problems with existing “standard” risk model (that many energy companies have adopted from the bank industry) are: • Riskmetrics. TM Va. R capture time varying volatility but not the conditional return distribution • Historical Simulation Va. R capture the return distribution but not the time varying volatility • Alternatives: • GARCH with T, Skew T, or GED • Ca. Via. R type models • Although these models works fine according to several studies, there is a problem of calibrating these non-linear models and therefore they are only used to a very limited extent in practice 9
Why Value at Risk Modelling for Energy Commodities using Volatility Adjusted Quantile Regression? • In this paper we propose a robust and “easy to implement” approach for Value at Risk estimation based on; • First running an exponential weighted moving average volatility model (similar to the adjustment done in Riskmetrics. TM) and then • Run a linear quantile regression model based on this conditional volatility as input/explanatory variable • The model is easy to implement (can be done in a spreadsheet) • This model also shows an excellent fit when backtesting Va. R 10
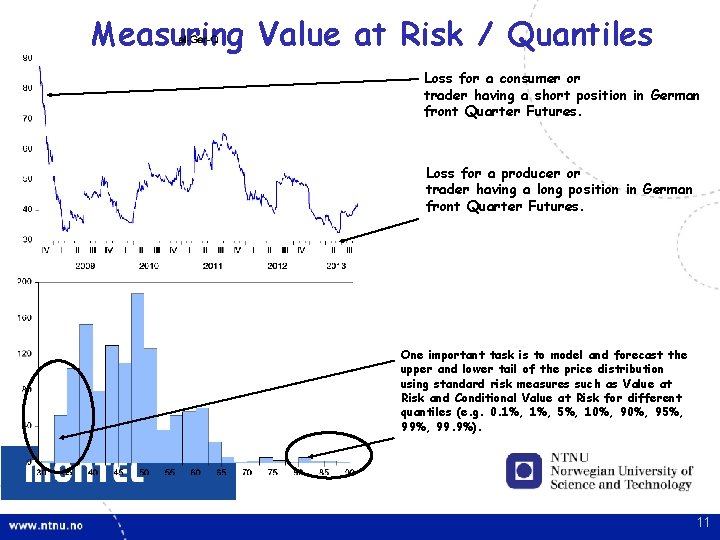
Measuring Value at Risk / Quantiles Loss for a consumer or trader having a short position in German front Quarter Futures. Loss for a producer or trader having a long position in German front Quarter Futures. Oil prices ($/Ton) One important task is to model and forecast the upper and lower tail of the price distribution using standard risk measures such as Value at Risk and Conditional Value at Risk for different quantiles (e. g. 0. 1%, 5%, 10%, 95%, 99. 9%). 11
Layout for the presentation • Previous work/literature of risk modelling of (energy) commodities • European Energy Futures Markets (crude oil, gas oil, natural gas, coal, carbon, and electricity) and Data/Descriptive Statistics • ICE-ENDEX • EEX • Nasdaq OMX Commodities • Volatility Adjusted Quantile Regression • Comparing / Backtesting Value at Risk analysis for Energy Commodities • Risk. Metrics. TM • Historical Simulation • Volatility Adjusted Quantile Regression • Conclusions and further work 12
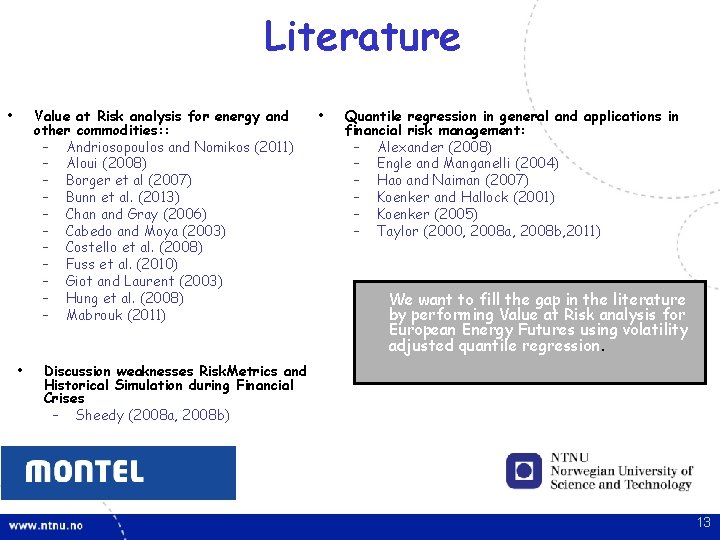
Literature • Value at Risk analysis for energy and other commodities: : – Andriosopoulos and Nomikos (2011) – Aloui (2008) – Borger et al (2007) – Bunn et al. (2013) – Chan and Gray (2006) – Cabedo and Moya (2003) – Costello et al. (2008) – Fuss et al. (2010) – Giot and Laurent (2003) – Hung et al. (2008) – Mabrouk (2011) • • Quantile regression in general and applications in financial risk management: – Alexander (2008) – Engle and Manganelli (2004) – Hao and Naiman (2007) – Koenker and Hallock (2001) – Koenker (2005) – Taylor (2000, 2008 a, 2008 b, 2011) We want to fill the gap in the literature by performing Value at Risk analysis for European Energy Futures using volatility adjusted quantile regression. Discussion weaknesses Risk. Metrics and Historical Simulation during Financial Crises – Sheedy (2008 a, 2008 b) 13
Literature TEXTBOOKS ENERGY MARKET MODELLING • Bunn D. , 2004, Modelling Prices in Competitive Electricity Markets , Wiley • Burger, M. , Graeber B. , Schindlmayr, G. 2008, Managing energy risk – An integrated view on power and other energy markets, Wiley. • Eydeland A. and Wolyniec K. , 2003, Energy and power risk management, Wiley • Geman H. , 2005, Commoditites and commodity derivatives – Modelling and pricing for agriculturas, metals and energy, Wiley • Geman H. , 2008, Risk Management in commodity markets – From shipping to agriculturas and energy, Wiley • Kaminski V. , 2005, Managing Energy Price Risk – The New Challenges and Solutions, Risk Books • Kaminski V. , 2005, Energy Modelling, Risk Books • Kaminski V. , 2013, Energy Morkets, Risk Books • Pilipovic D. , 2007, Energy risk – Valuation and managing energy derivatives, Mc. Graw. Hill • Serletis A. , 2007. Quantitative and empirical analysis of energy markets, Word Scientific • Weron R. , 2006, Modeling and Forecasting Electricity Loads and Prices: A Statistical Approach, Wiley 14
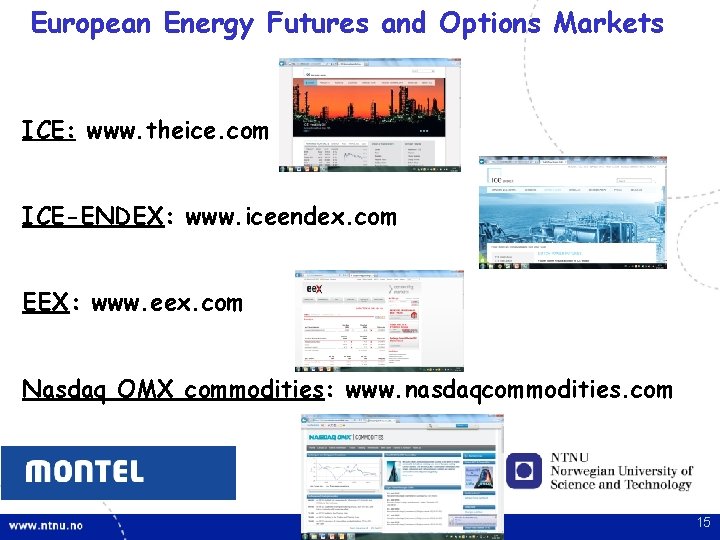
European Energy Futures and Options Markets ICE: www. theice. com ICE-ENDEX: www. iceendex. com EEX: www. eex. com Nasdaq OMX commodities: www. nasdaqcommodities. com 15
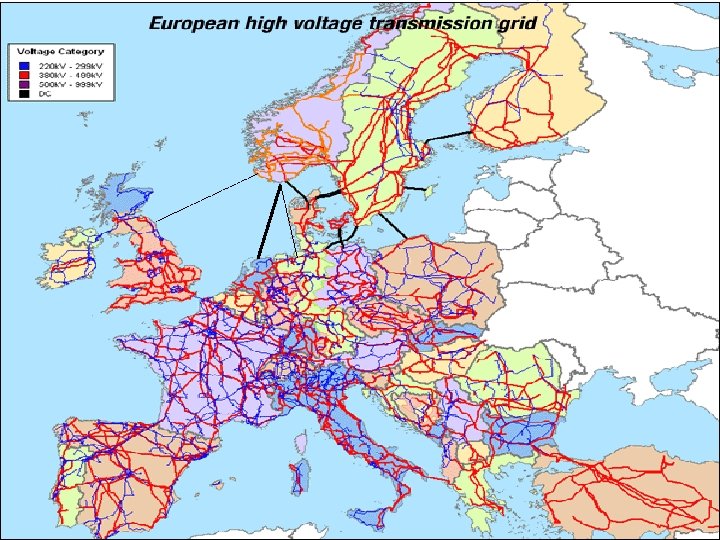
16
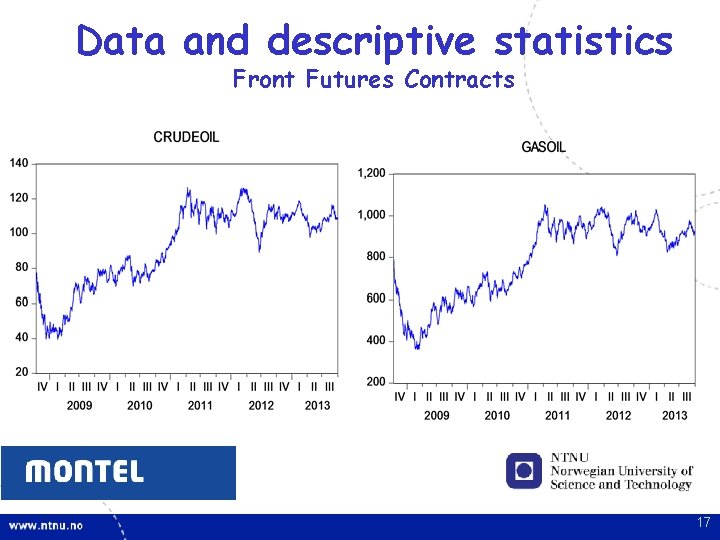
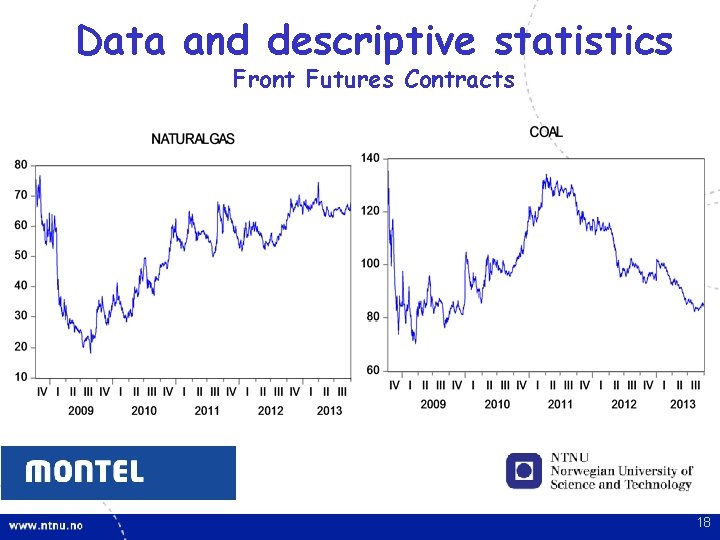
Data and descriptive statistics Front Futures Contracts 17
Data and descriptive statistics Front Futures Contracts 18
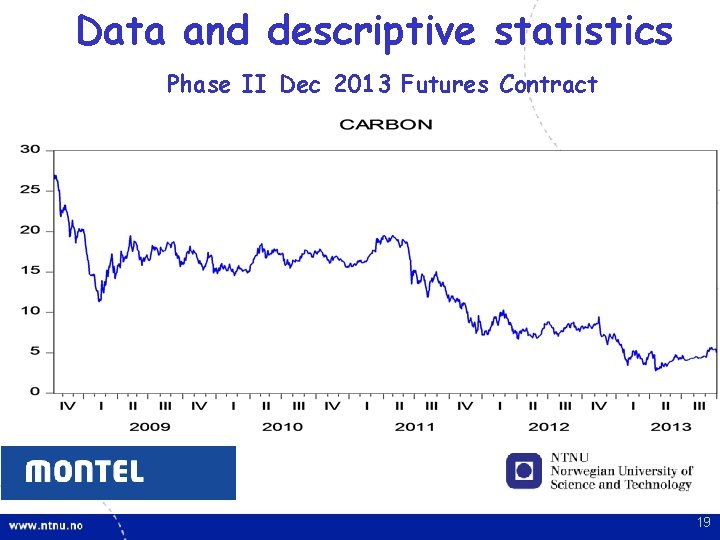
Data and descriptive statistics Phase II Dec 2013 Futures Contract 19
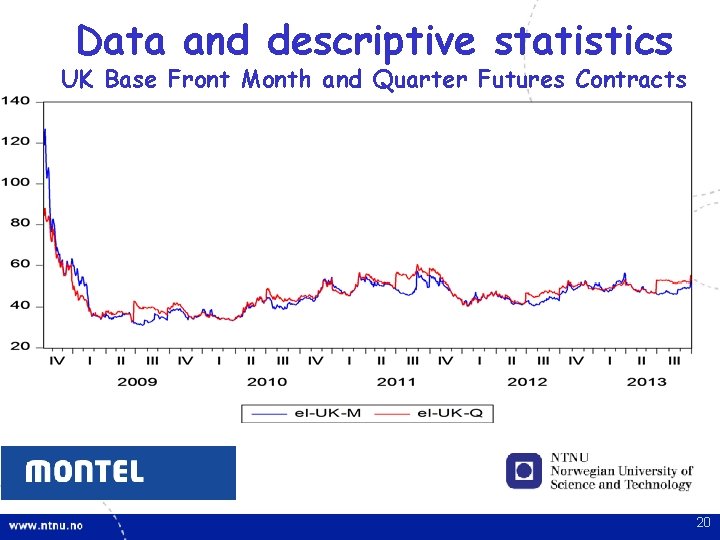
Data and descriptive statistics UK Base Front Month and Quarter Futures Contracts 20
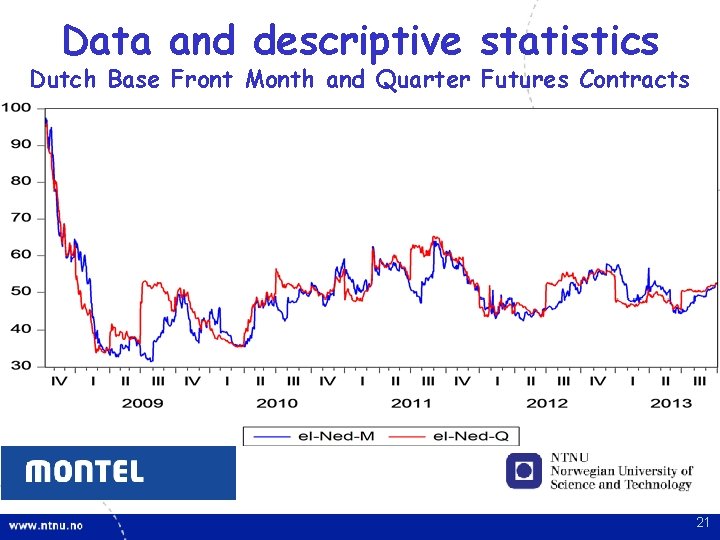
Data and descriptive statistics Dutch Base Front Month and Quarter Futures Contracts 21
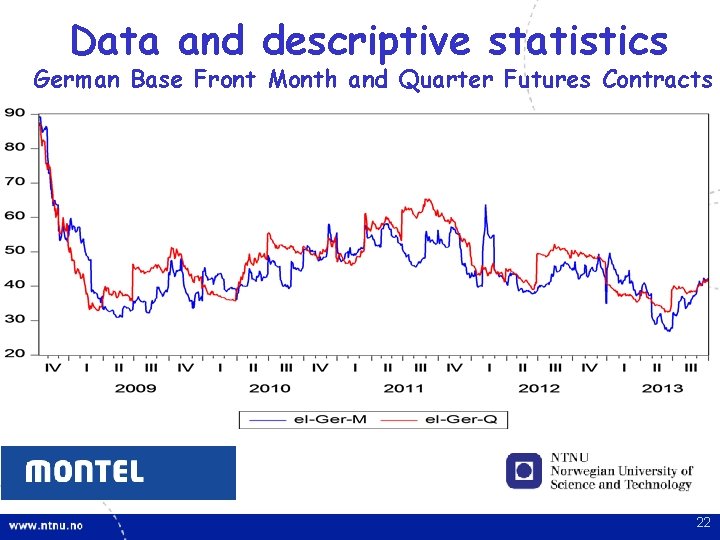
Data and descriptive statistics German Base Front Month and Quarter Futures Contracts 22
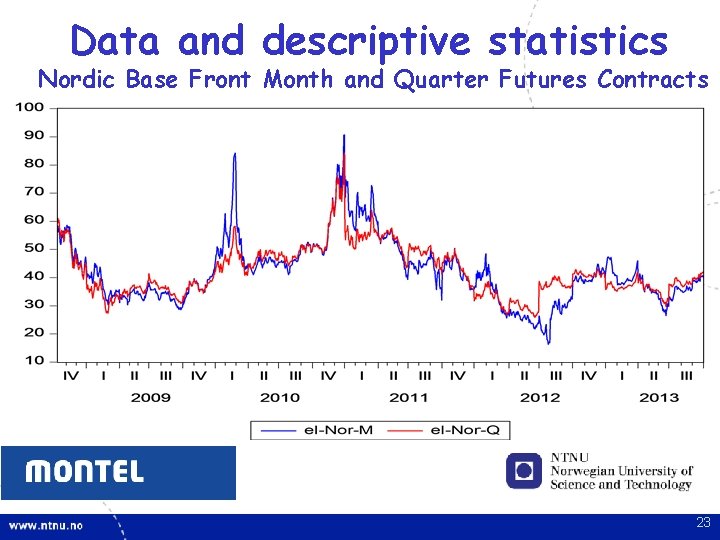
Data and descriptive statistics Nordic Base Front Month and Quarter Futures Contracts 23
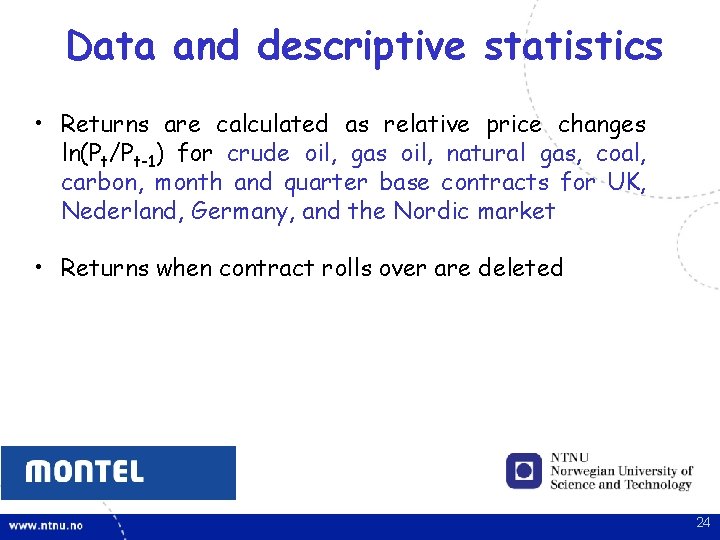
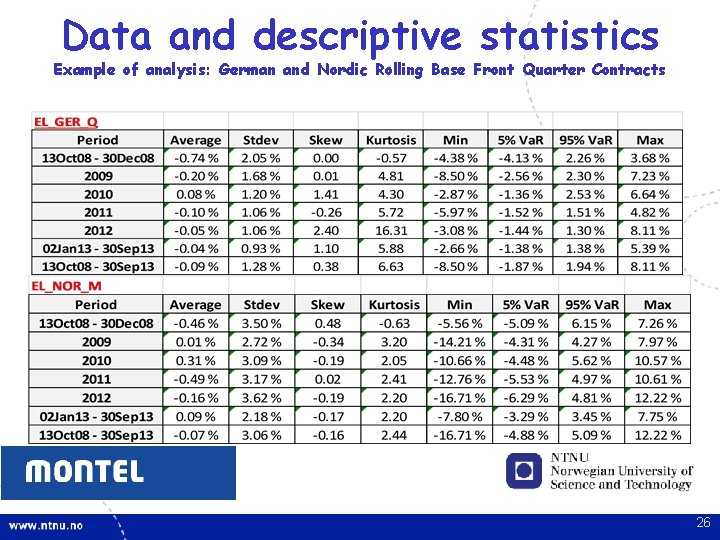
Data and descriptive statistics • Returns are calculated as relative price changes ln(Pt/Pt-1) for crude oil, gas oil, natural gas, coal, carbon, month and quarter base contracts for UK, Nederland, Germany, and the Nordic market • Returns when contract rolls over are deleted 24
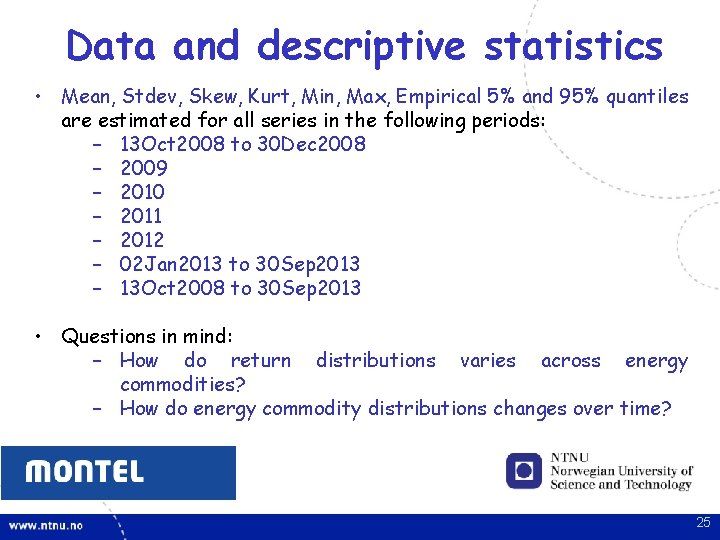
Data and descriptive statistics • Mean, Stdev, Skew, Kurt, Min, Max, Empirical 5% and 95% quantiles are estimated for all series in the following periods: – 13 Oct 2008 to 30 Dec 2008 – 2009 – 2010 – 2011 – 2012 – 02 Jan 2013 to 30 Sep 2013 – 13 Oct 2008 to 30 Sep 2013 • Questions in mind: – How do return distributions varies across energy commodities? – How do energy commodity distributions changes over time? 25
Data and descriptive statistics Example of analysis: German and Nordic Rolling Base Front Quarter Contracts 26
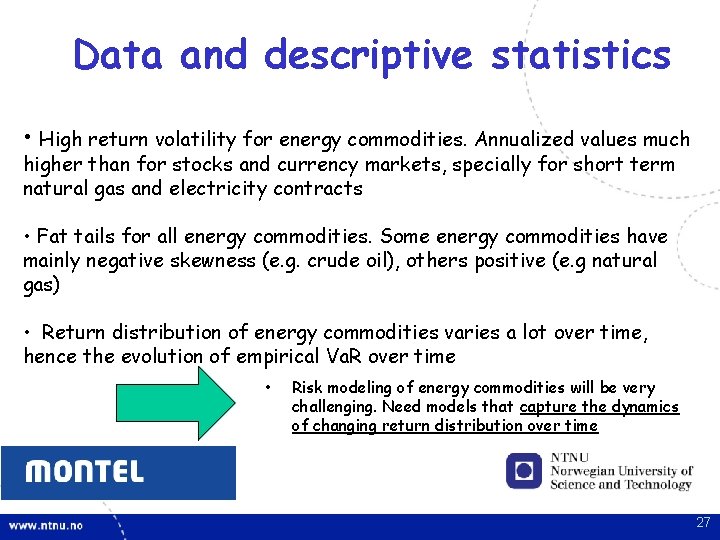
Data and descriptive statistics • High return volatility for energy commodities. Annualized values much higher than for stocks and currency markets, specially for short term natural gas and electricity contracts • Fat tails for all energy commodities. Some energy commodities have mainly negative skewness (e. g. crude oil), others positive (e. g natural gas) • Return distribution of energy commodities varies a lot over time, hence the evolution of empirical Va. R over time • Risk modeling of energy commodities will be very challenging. Need models that capture the dynamics of changing return distribution over time 27
Quantile regression • Quantile regression was introduced by a paper in Econometrica with Koenker and Bassett (1978) and is fully described in books by Koenker (2005) and Hao and Naiman (2007) • Applications in financial risk management (stocks / currency markets) can be found by Engle and Manganelli (2004), Alexander (2008), Taylor (2008) 28 28
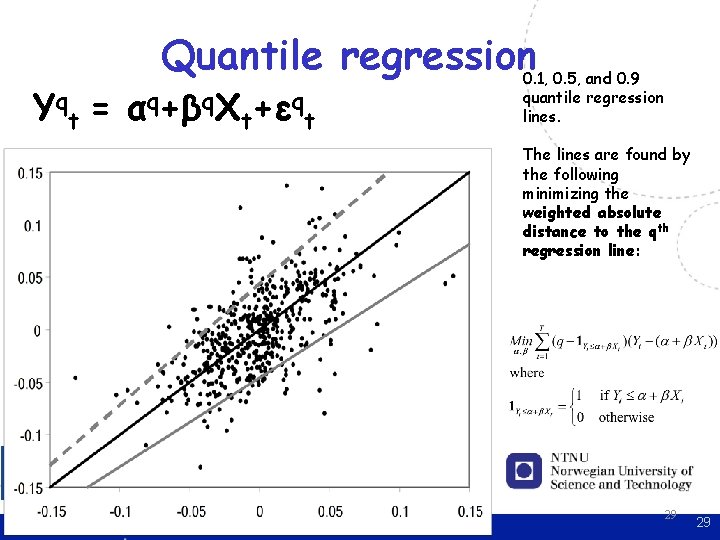
Quantile regression Yqt = αq+βq. Xt+εqt 0. 1, 0. 5, and 0. 9 quantile regression lines. The lines are found by the following minimizing the weighted absolute distance to the qth regression line: 29 29
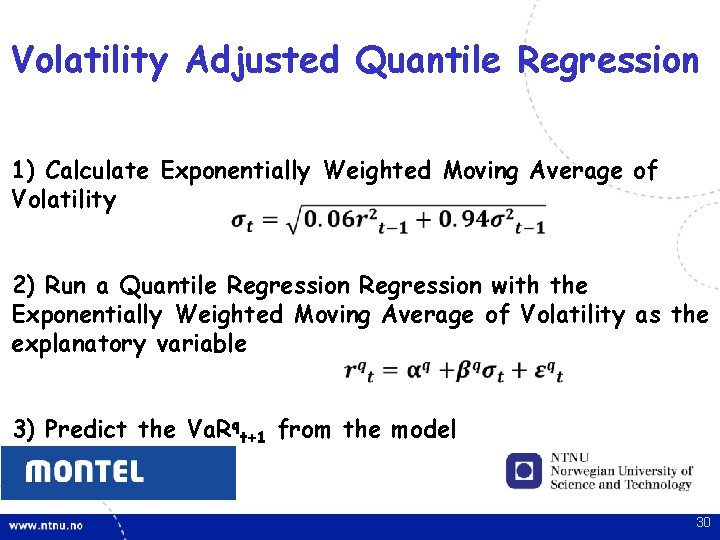
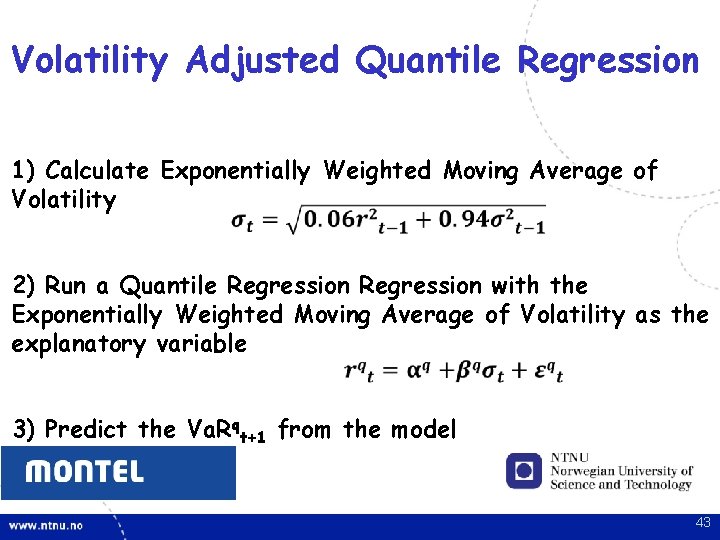
Volatility Adjusted Quantile Regression 1) Calculate Exponentially Weighted Moving Average of Volatility 2) Run a Quantile Regression with the Exponentially Weighted Moving Average of Volatility as the explanatory variable 3) Predict the Va. Rqt+1 from the model 30
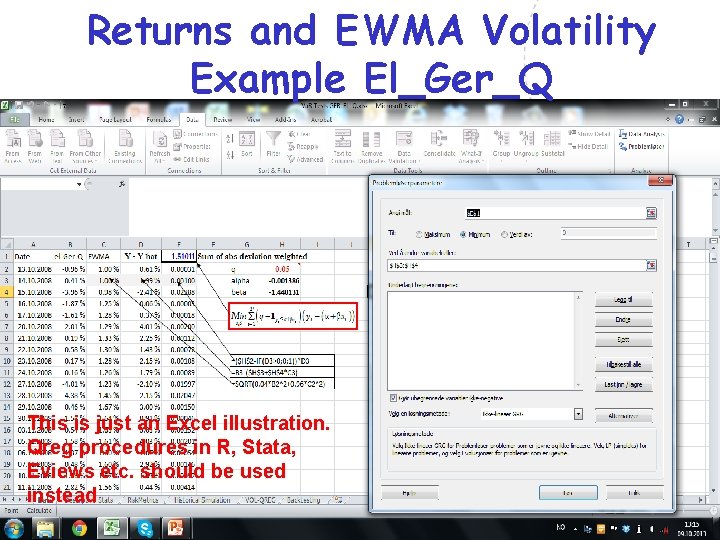
Returns and EWMA Volatility Example El_Ger_Q This is just an Excel illustration. Qreg procedures in R, Stata, Eviews etc. should be used instead 31 31
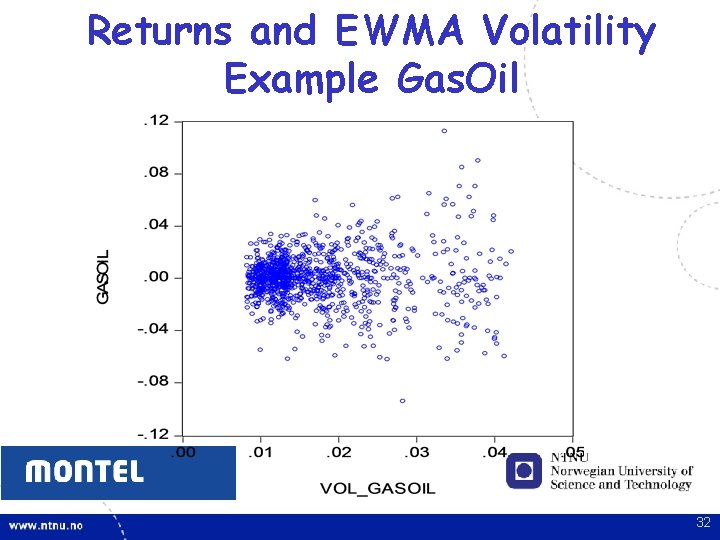
Returns and EWMA Volatility Example Gas. Oil 32
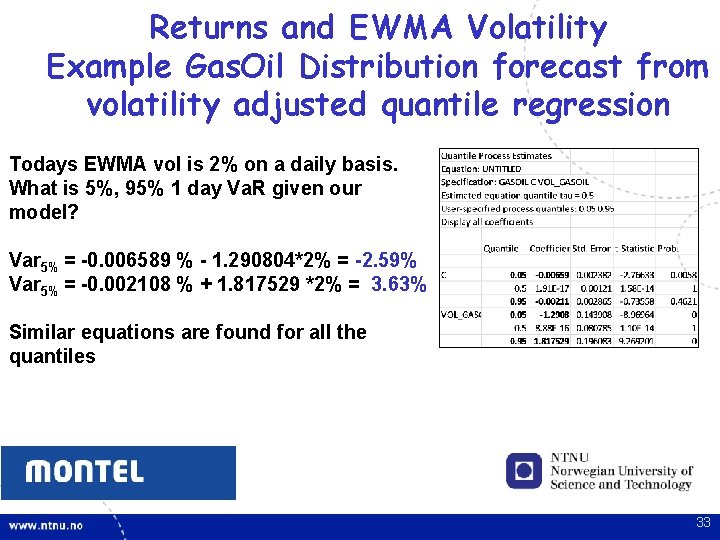
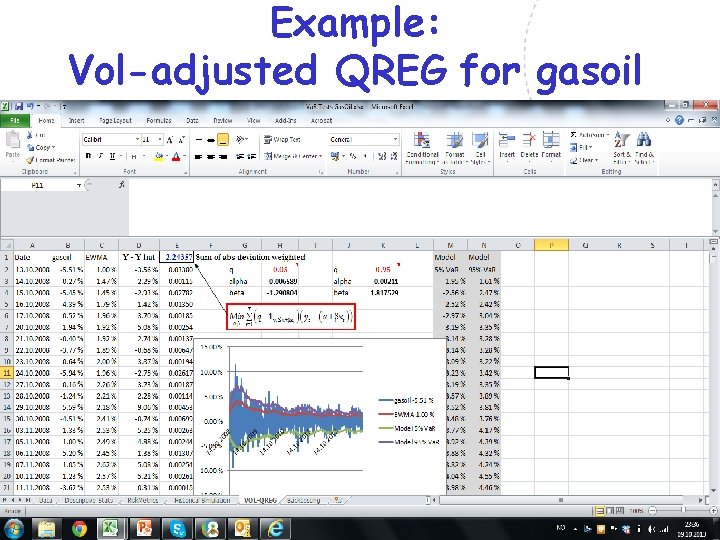
Returns and EWMA Volatility Example Gas. Oil Distribution forecast from volatility adjusted quantile regression Todays EWMA vol is 2% on a daily basis. What is 5%, 95% 1 day Va. R given our model? Var 5% = -0. 006589 % - 1. 290804*2% = -2. 59% Var 5% = -0. 002108 % + 1. 817529 *2% = 3. 63% Similar equations are found for all the quantiles 33
Comparing Value at Risk models for energy commodities • Va. R Models • Risk. Metrics. TM • Historical Simulation • Volatility Adjusted Quantile Regression • Backtesting Value at Risk Models • Kupiec Test • Christoffersen Test 34
Comparing Value at Risk models for energy commodities • It is easy to estimate Va. R once we have the return distribution • The only difference between the Va. R models are due to the manner in which this distribution is constructed 35
Comparing Value at Risk models for energy commodities – Risk. Metrics. TM • Analytically tractable, adjustment for timevarying volatility, but assumption of normally distributed returns for energy commodities is not suitable 36
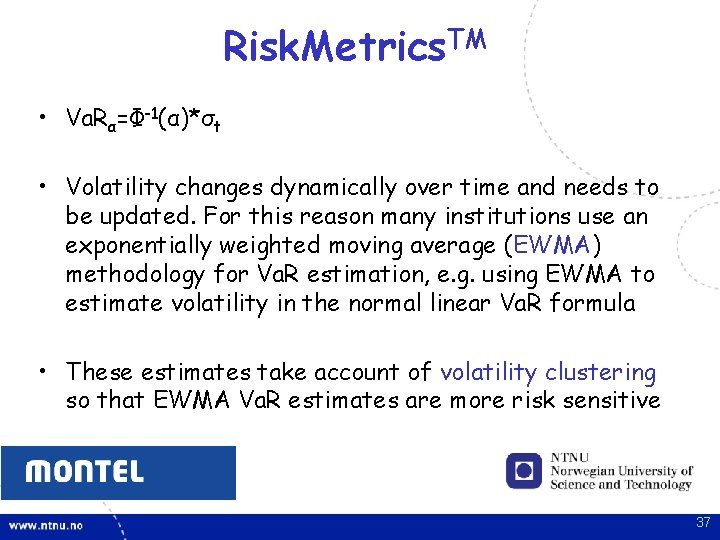
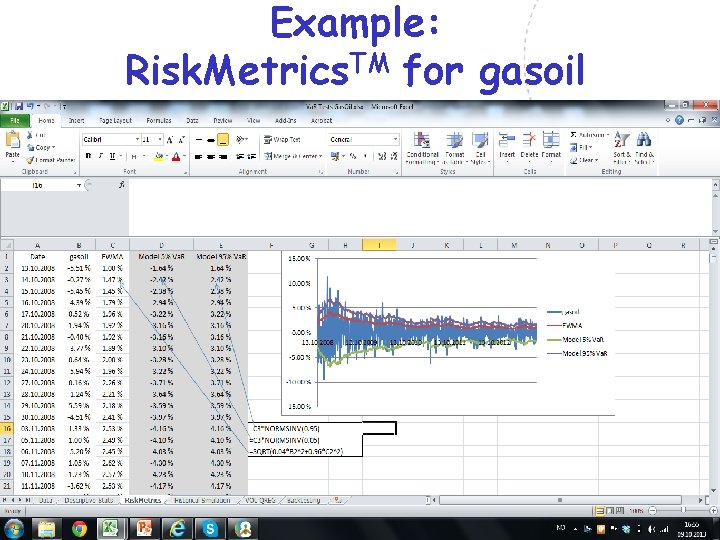
Risk. Metrics. TM • Va. Rα=Ф-1(α)*σt • Volatility changes dynamically over time and needs to be updated. For this reason many institutions use an exponentially weighted moving average (EWMA) methodology for Va. R estimation, e. g. using EWMA to estimate volatility in the normal linear Va. R formula • These estimates take account of volatility clustering so that EWMA Va. R estimates are more risk sensitive 37
Example: Risk. Metrics. TM for gasoil 38
Comparing Value at Risk models for energy commodities – Historical simulation • Makes no assumptions about the parametric form of the return distribution, but do not make the distribution conditional upon market conditions / volatility 39
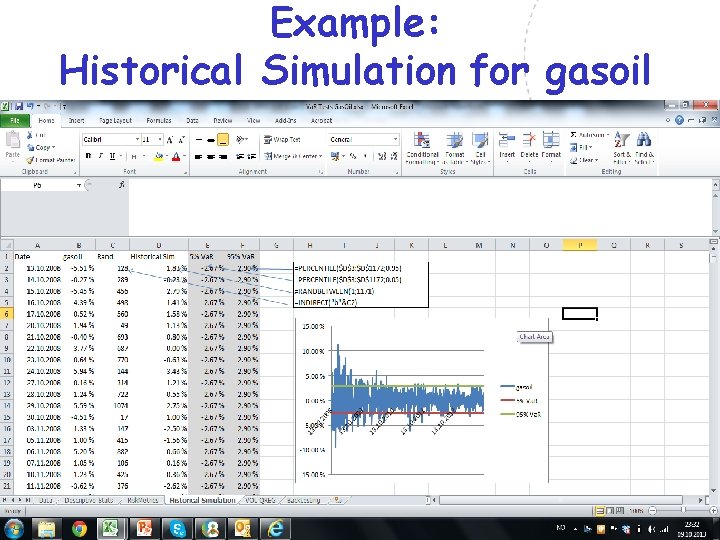
Historical Simulation 1. Choose a sample size to reflect current market conditions (Banks usually use 3 -5 years) 2. Draw returns from the empirical distribution and calculate Va. R for each simulation 3. Use the average Va. R for all simulation (you alsp get the distribution of Va. R as an outcome) – Also called bootstrapping 40
Example: Historical Simulation for gasoil 41
Comparing Value at Risk models for energy commodities • Volatility Adjusted Quantile Regression • Allows for all kinds of distributions (semi nonparametric method) and allow the distribution to be conditional upon the volatility/changing market condition 42
Volatility Adjusted Quantile Regression 1) Calculate Exponentially Weighted Moving Average of Volatility 2) Run a Quantile Regression with the Exponentially Weighted Moving Average of Volatility as the explanatory variable 3) Predict the Va. Rqt+1 from the model 43
Example: Vol-adjusted QREG for gasoil 44
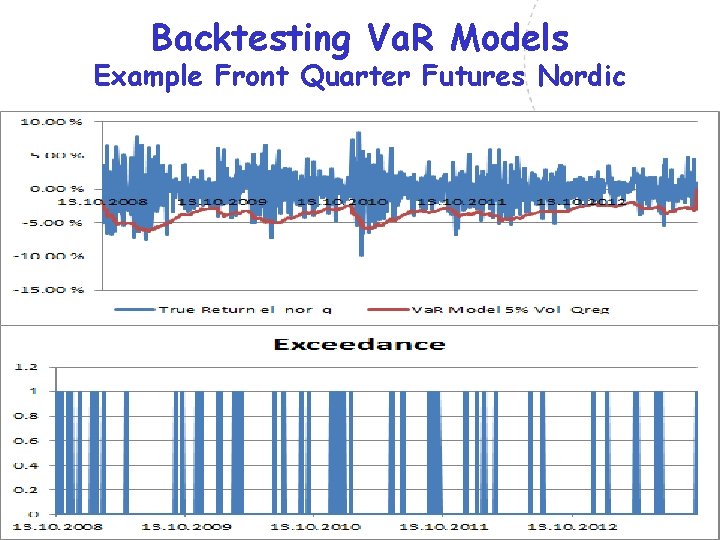
Backtesting Va. R Models In sample analysis • Backtesting refers to testing the accuracy of a Va. R model over a historical period when the true outcome (return) is known • The general approach to backtesting Va. R for an asset is to record the number of occasions over the period when the actual loss exceeds the model predicted Va. R and compare this number to the prespecified Va. R level 45
Backtesting Va. R Models Example Front Quarter Futures Nordic 46
Backtesting Value at Risk Models • A proper Va. R model has: • The number of exceedances as close as possible to the number implied by the Va. R quantile we are trying to model • Exceedances that are randomly distributed over the sample (that is no “clustering” of exceedances). We do not want the model to over/under predict Va. R in certain periods 47
Backtesting Va. R Models • To validate the predictive performance of the models, we consider two types of test: • The unconditional test of Kupiec (1995) • • The conditional coverage test of Christoffersen (1998) Kupiec (1995) test whether the number of exceedances or hits are equal to the predefined Va. R level. Christoffersen (1998) also test whether the exceedances/hits are randomly distributed over the sample 48
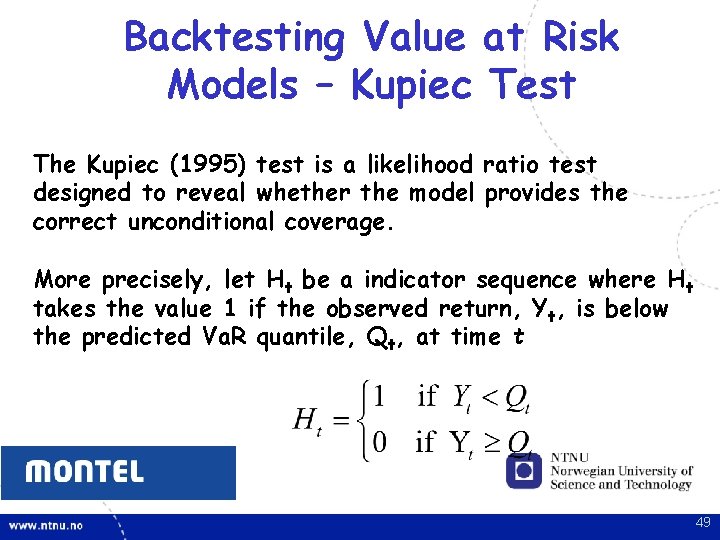
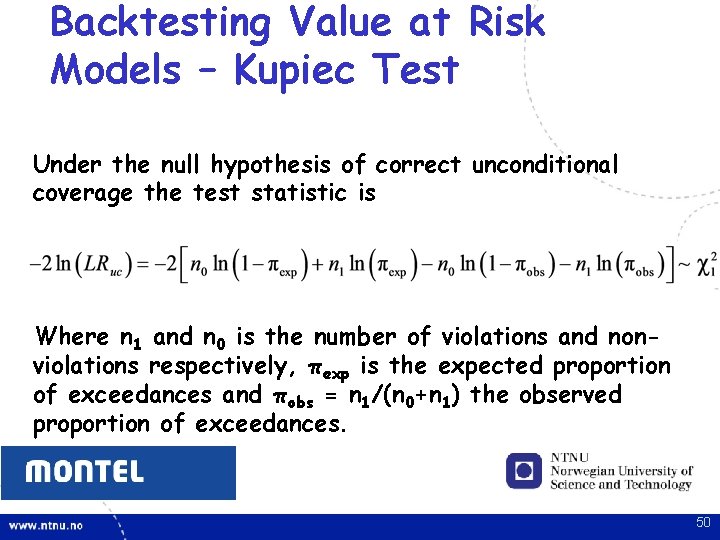
Backtesting Value at Risk Models – Kupiec Test The Kupiec (1995) test is a likelihood ratio test designed to reveal whether the model provides the correct unconditional coverage. More precisely, let Ht be a indicator sequence where Ht takes the value 1 if the observed return, Yt, is below the predicted Va. R quantile, Qt, at time t 49
Backtesting Value at Risk Models – Kupiec Test Under the null hypothesis of correct unconditional coverage the test statistic is Where n 1 and n 0 is the number of violations and nonviolations respectively, πexp is the expected proportion of exceedances and πobs = n 1/(n 0+n 1) the observed proportion of exceedances. 50
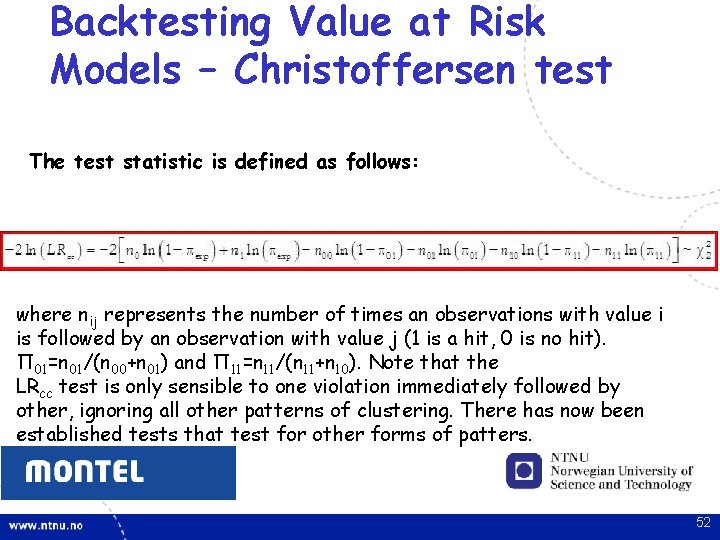
Backtesting Value at Risk Models – Christoffersen test • In the Kupiec (1995) test only the total number of ones in the indicator sequence counts, and the test does not take into account whether several quantile exceedances occur in rapid succession, or whether they tend to be isolated. • Christoffersen (1998) provides a joint test for correct coverage and for detecting whether a violations are clustered or not. 51
Backtesting Value at Risk Models – Christoffersen test The test statistic is defined as follows: where nij represents the number of times an observations with value i is followed by an observation with value j (1 is a hit, 0 is no hit). Π 01=n 01/(n 00+n 01) and Π 11=n 11/(n 11+n 10). Note that the LRcc test is only sensible to one violation immediately followed by other, ignoring all other patterns of clustering. There has now been established tests that test for other forms of patters. 52
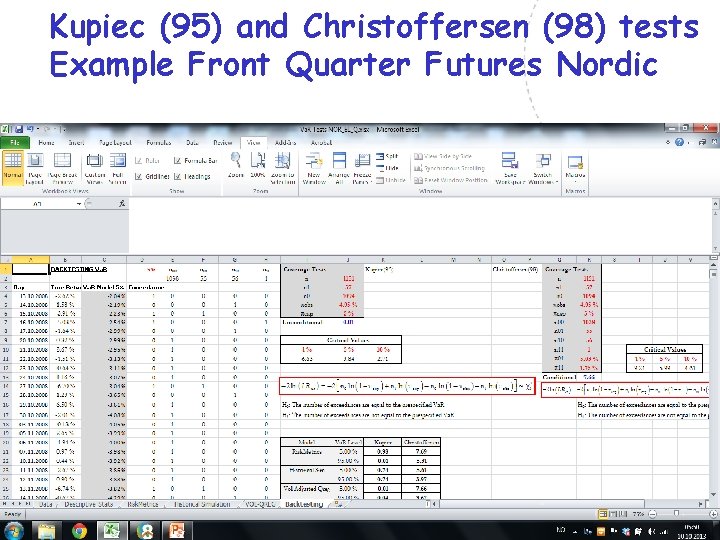
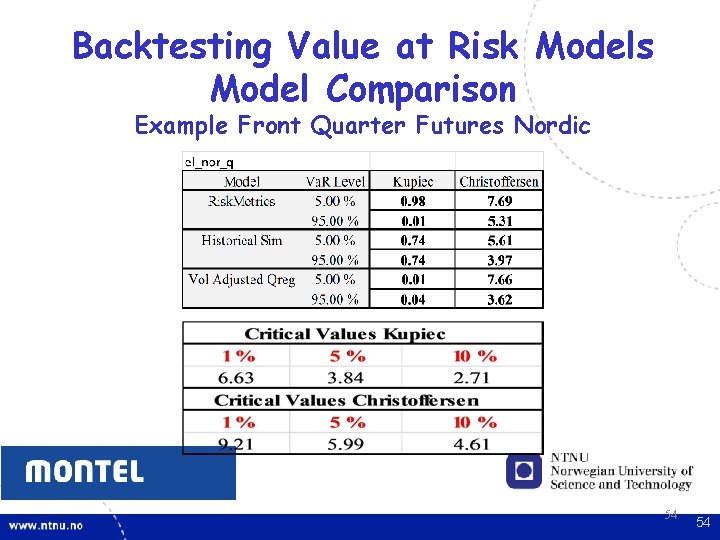
Kupiec (95) and Christoffersen (98) tests Example Front Quarter Futures Nordic 53
Backtesting Value at Risk Models Model Comparison Example Front Quarter Futures Nordic 54 54
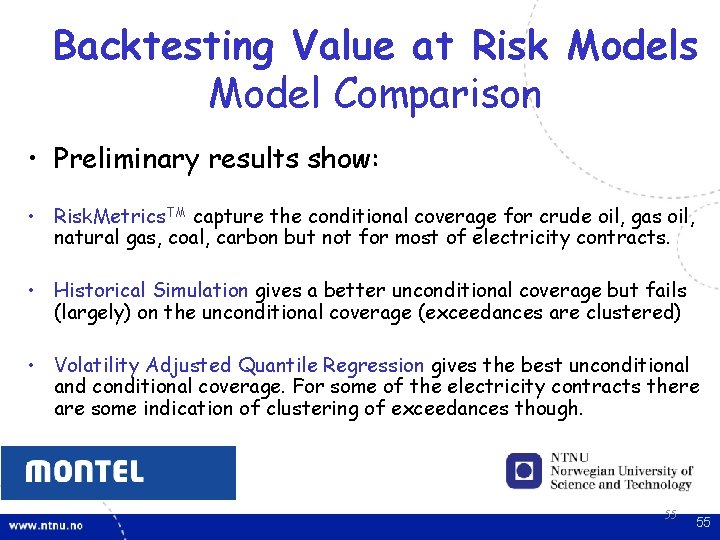
Backtesting Value at Risk Models Model Comparison • Preliminary results show: • Risk. Metrics. TM capture the conditional coverage for crude oil, gas oil, natural gas, coal, carbon but not for most of electricity contracts. • Historical Simulation gives a better unconditional coverage but fails (largely) on the unconditional coverage (exceedances are clustered) • Volatility Adjusted Quantile Regression gives the best unconditional and conditional coverage. For some of the electricity contracts there are some indication of clustering of exceedances though. 55 55
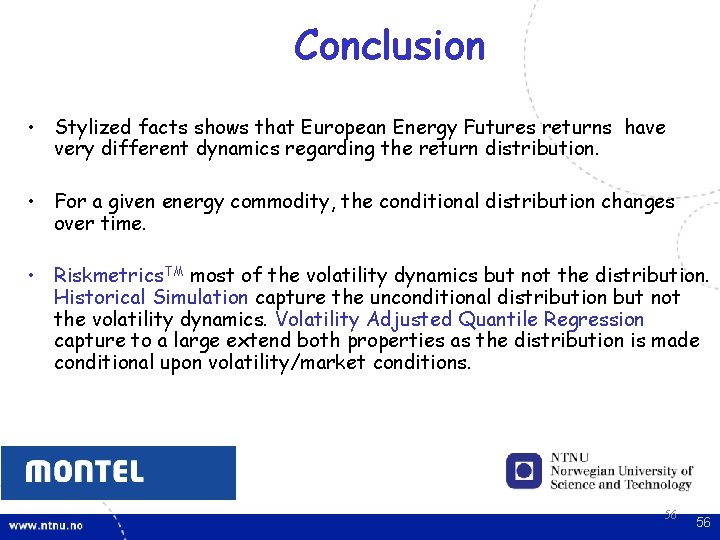
Conclusion • Stylized facts shows that European Energy Futures returns have very different dynamics regarding the return distribution. • For a given energy commodity, the conditional distribution changes over time. • Riskmetrics. TM most of the volatility dynamics but not the distribution. Historical Simulation capture the unconditional distribution but not the volatility dynamics. Volatility Adjusted Quantile Regression capture to a large extend both properties as the distribution is made conditional upon volatility/market conditions. 56 56
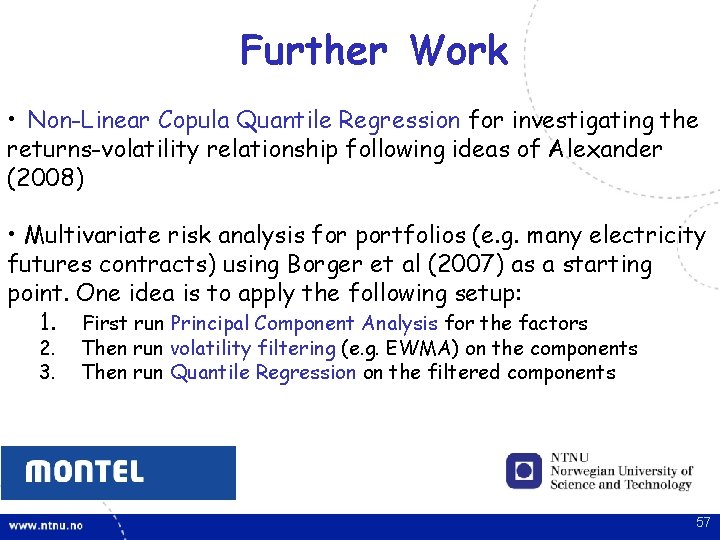
Further Work • Non-Linear Copula Quantile Regression for investigating the returns-volatility relationship following ideas of Alexander (2008) • Multivariate risk analysis for portfolios (e. g. many electricity futures contracts) using Borger et al (2007) as a starting point. One idea is to apply the following setup: 1. First run Principal Component Analysis for the factors 2. 3. Then run volatility filtering (e. g. EWMA) on the components Then run Quantile Regression on the filtered components 57
Questions? Mail: sjur. westgaard@iot. ntnu. no Web: www. iot. ntnu. no/users/sjurw Phone: +47 73598183 or +47 91897096 58