Trace Analysis Chunxu Tang The Mystery Machine Endtoend



- Slides: 38

Trace Analysis Chunxu Tang

The Mystery Machine: End-to-end performance analysis of large-scale Internet services

Introduction • Complexity comes from • Scale • Heterogeneity

Introduction (Cont. ) • End-to-end: • From a user initiates a page load in a client Web browser, • Through server-side processing, network transmission, and Java. Script execution, • To the point client Web browser finishes rendering the page.

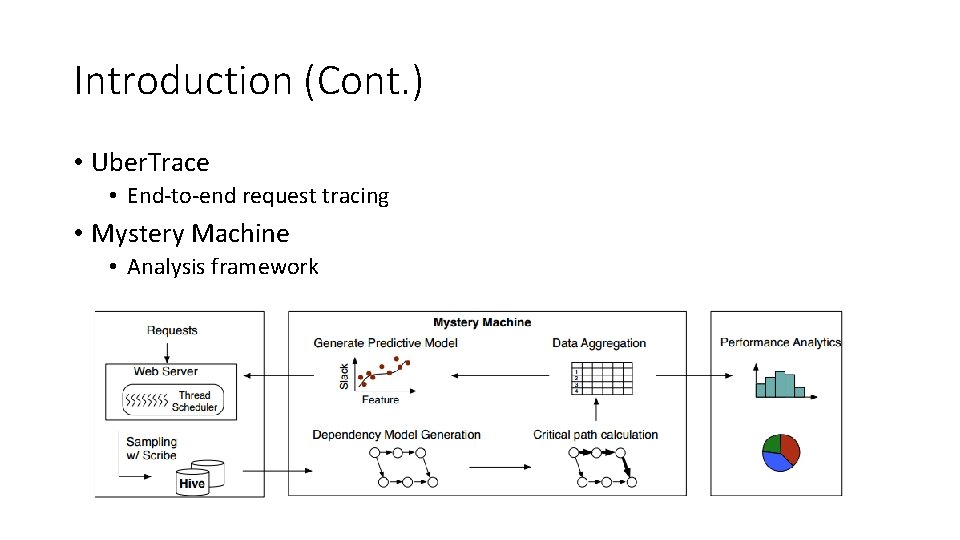
Introduction (Cont. ) • Uber. Trace • End-to-end request tracing • Mystery Machine • Analysis framework

Uber. Trace • Unify the individual logging systems at Facebook into a single end-to-end performance tracing tool, dubbed Uber. Trace.

Uber. Trace (Cont. ) • Log messages contain at least: • • • 1. A unique request identifier. 2. The executing computer. 3. A timestamp that uses the local clock of the executing computer. 4. An event name. 5. A task name, where a task is defined to be a distributed thread of control.

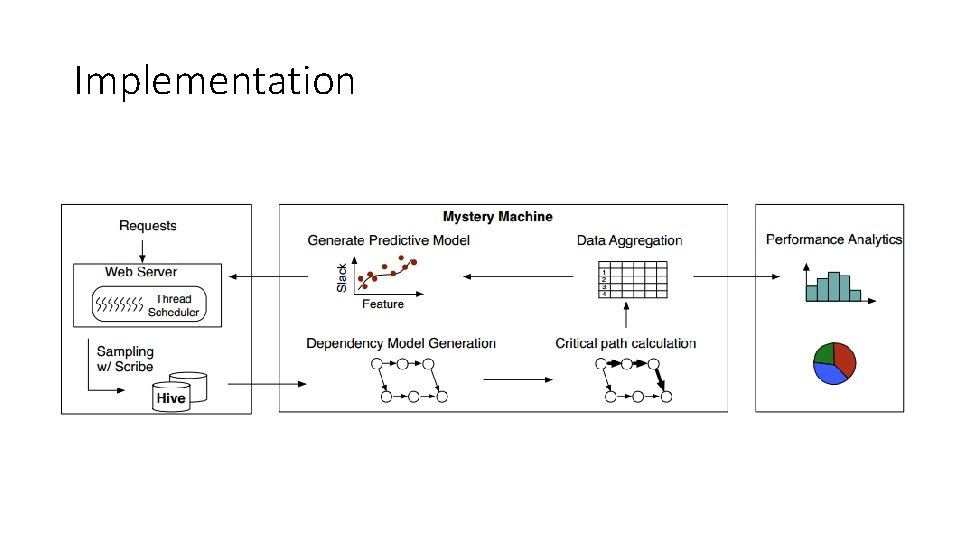
The Mystery Machine • Procedure: • • Create a causal model Find the critical path Quantify slack for segments not on the critical path Identify segments that are correlated with performance anomalies.

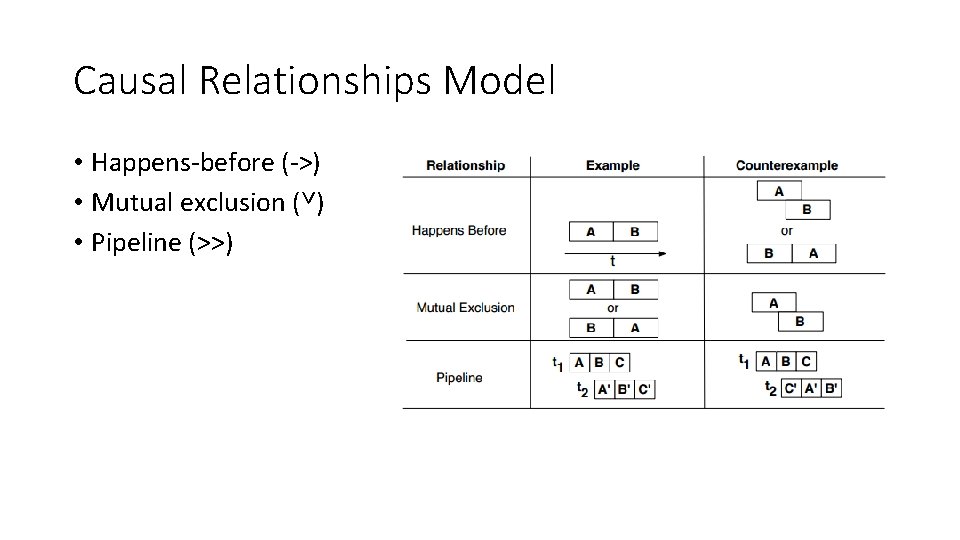
Causal Relationships Model • Happens-before (->) • Mutual exclusion (˅) • Pipeline (>>)

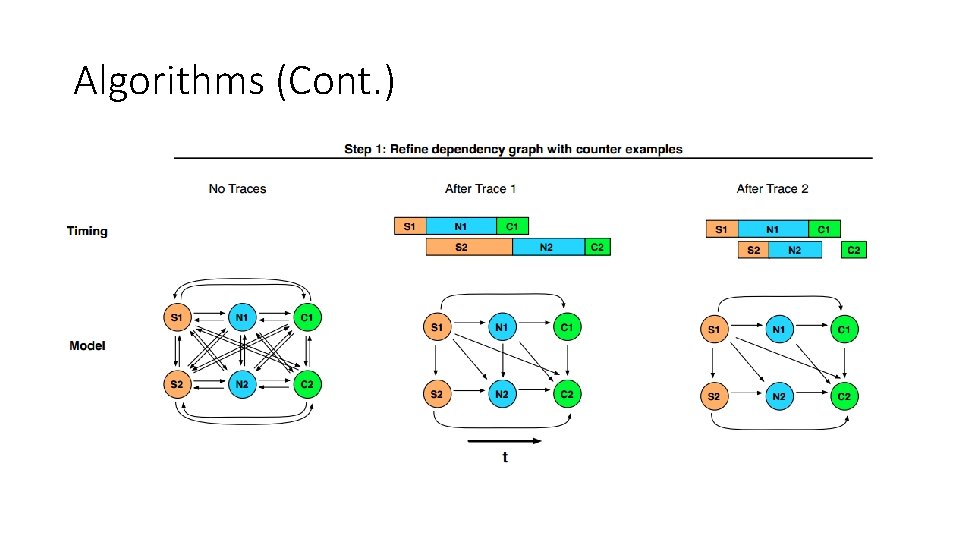
Algorithms • 1. Generate all possible hypotheses for causal relationships among segments. • The execution interval between two consecutive logged events for the same task. • 2. Iterate through traces and rejects a hypothesis if it finds a counterexample in any trace.

Algorithms (Cont. )

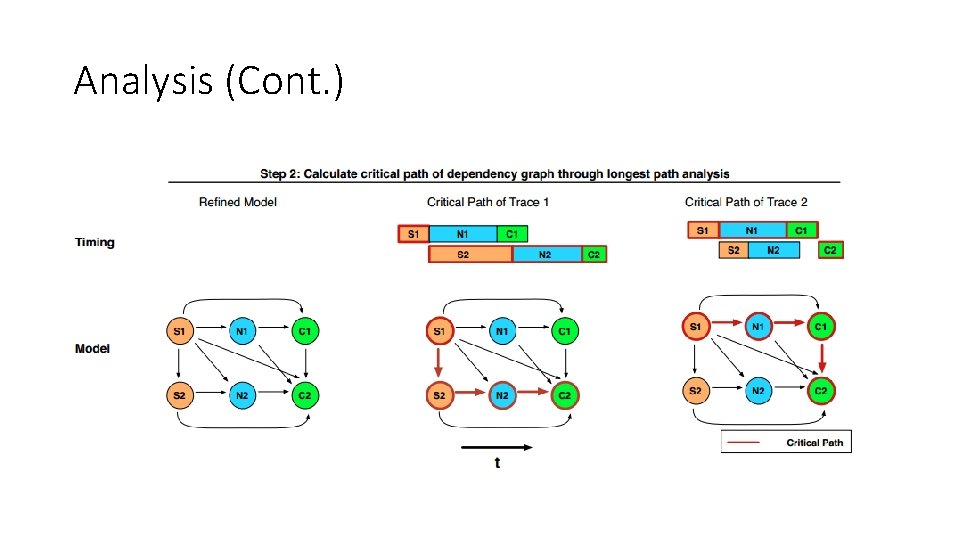
Analysis • Critical path analysis • The critical path is defined to be the set of segments for which a differential increase in segment execution time would result in the same differential increase in end-to-end latency.

Analysis (Cont. )

Analysis (Cont. ) • Slack Analysis • Slack is the amount by which the duration of a segment may increase without increasing the end-to-end latency of the request, assuming that the duration of all other segments remains constant.

Implementation

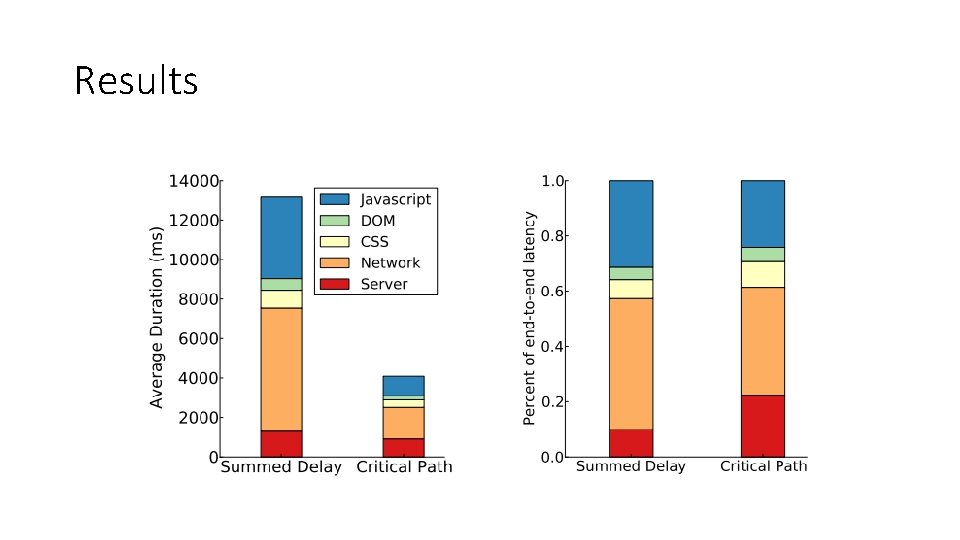
Results

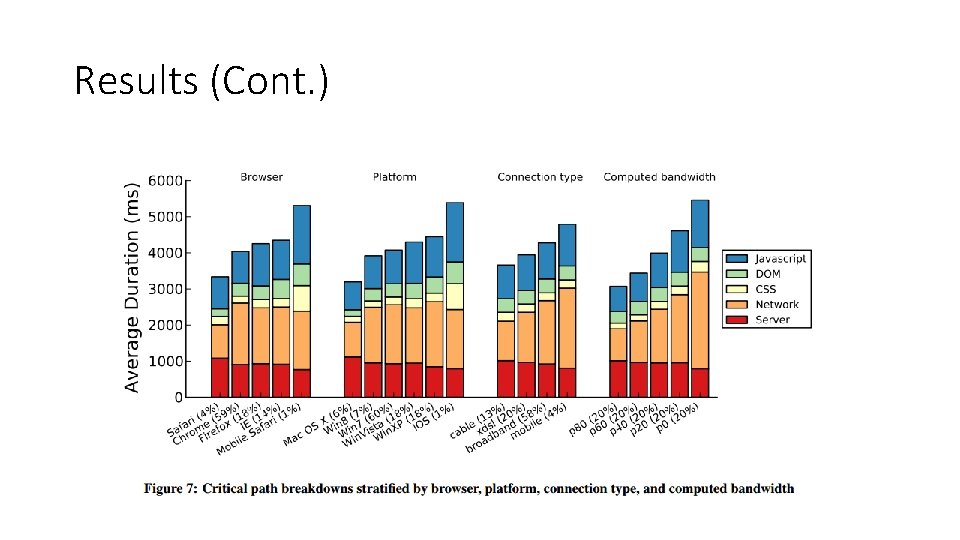
Results (Cont. )

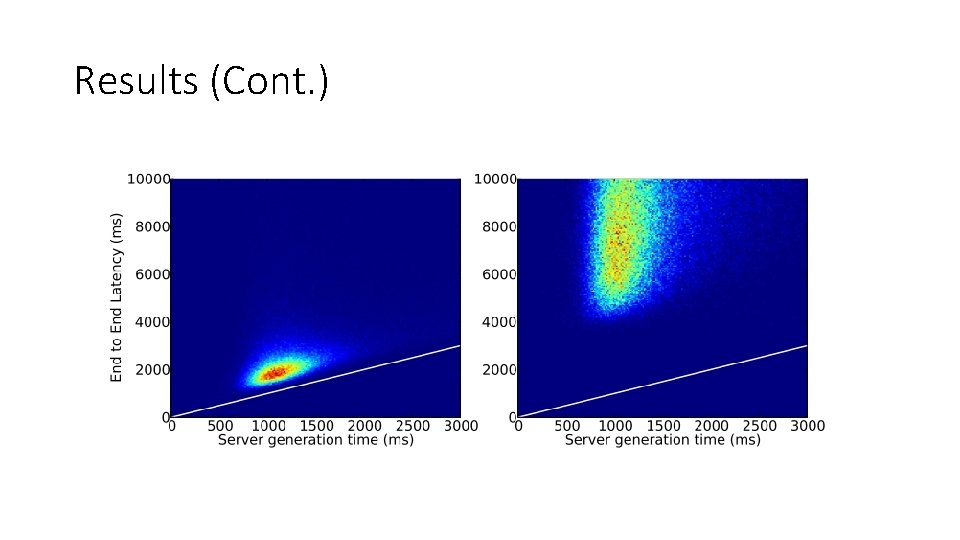
Results (Cont. )

Towards General-Purpose Resource Management in Shared Cloud Services

Introduction • Challenges of resource management • • • Bottleneck on hardware or software Ambiguous which user is responsible for system load Tenants interfere with internal system tasks Resource requirements vary Unpredictable which machine execute a request and how long • Goals • Effective • Efficient

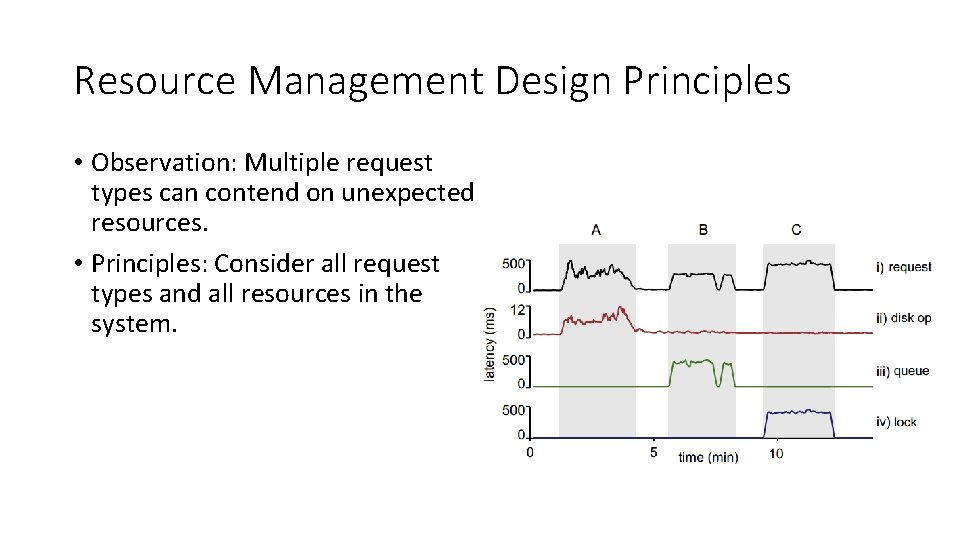
Resource Management Design Principles • Observation: Multiple request types can contend on unexpected resources. • Principles: Consider all request types and all resources in the system.

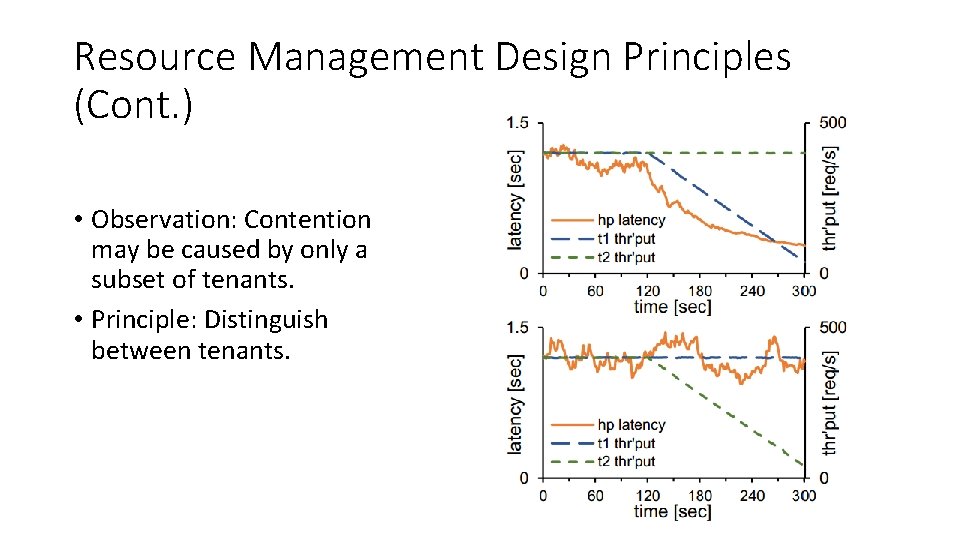
Resource Management Design Principles (Cont. ) • Observation: Contention may be caused by only a subset of tenants. • Principle: Distinguish between tenants.

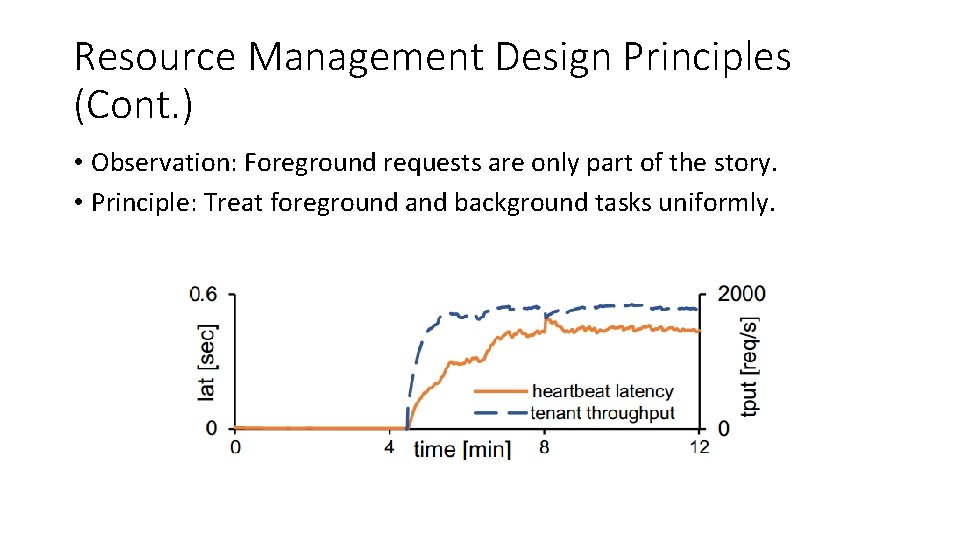
Resource Management Design Principles (Cont. ) • Observation: Foreground requests are only part of the story. • Principle: Treat foreground and background tasks uniformly.

Resource Management Design Principles (Cont. ) • Observation: Resource demands are very hard to predict. • Principle: Estimate resource usage at runtime.

Resource Management Design Principles (Cont. ) • Observation: Requests can be long or lose importance. • Principle: Schedule early, schedule often.

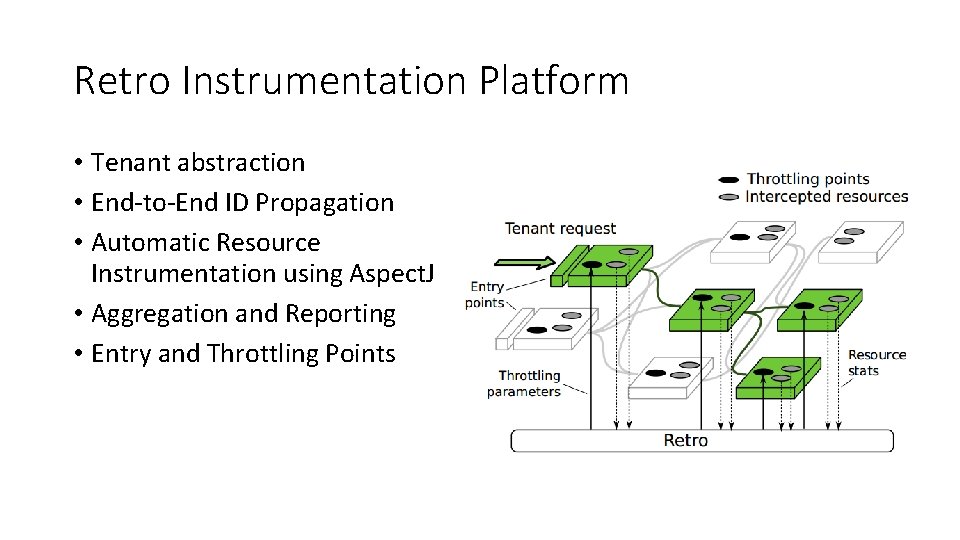
Retro Instrumentation Platform • Tenant abstraction • End-to-End ID Propagation • Automatic Resource Instrumentation using Aspect. J • Aggregation and Reporting • Entry and Throttling Points

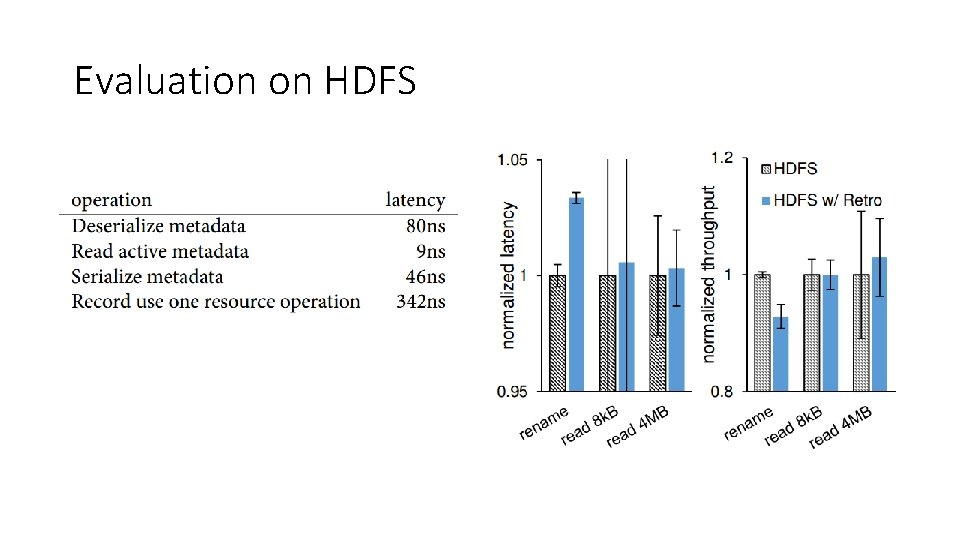
Evaluation on HDFS

Intro. Perf: Transparent Context-Sensitive Multi. Layer Performance Inference using System Stack Traces

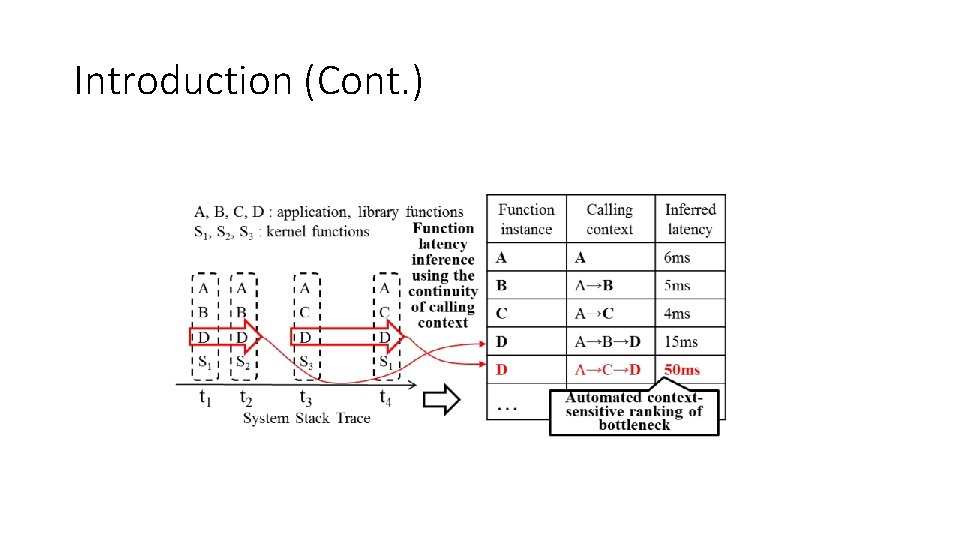
Introduction • Functionality: • With system stack traces as input, Intro. Perf transparently infers contextsensitive performance data of the software by measuring the continuity of calling context – the continuous period of a function in a stack with the same calling context.

Introduction (Cont. )

Introduction (Cont. ) • Contributions: • Transparent inference of function latency in multiple layers based on stack traces. • Automated localization of internal and external performance bottlenecks via context-sensitive performance analysis across multiple system layers.

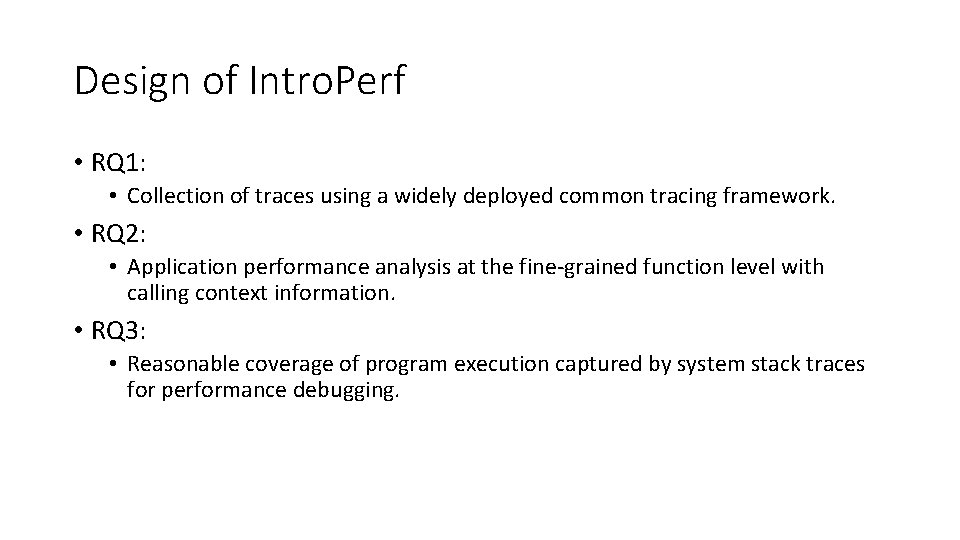
Design of Intro. Perf • RQ 1: • Collection of traces using a widely deployed common tracing framework. • RQ 2: • Application performance analysis at the fine-grained function level with calling context information. • RQ 3: • Reasonable coverage of program execution captured by system stack traces for performance debugging.

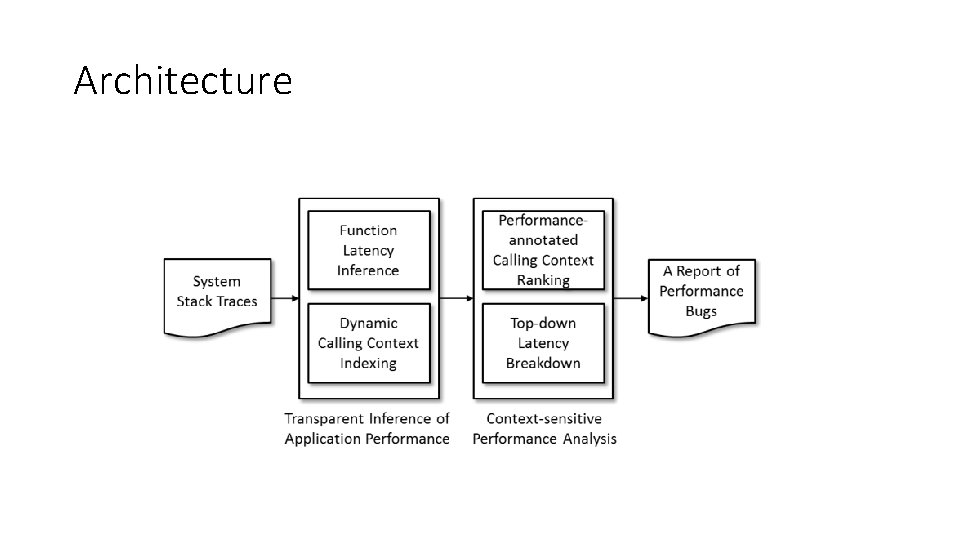
Architecture

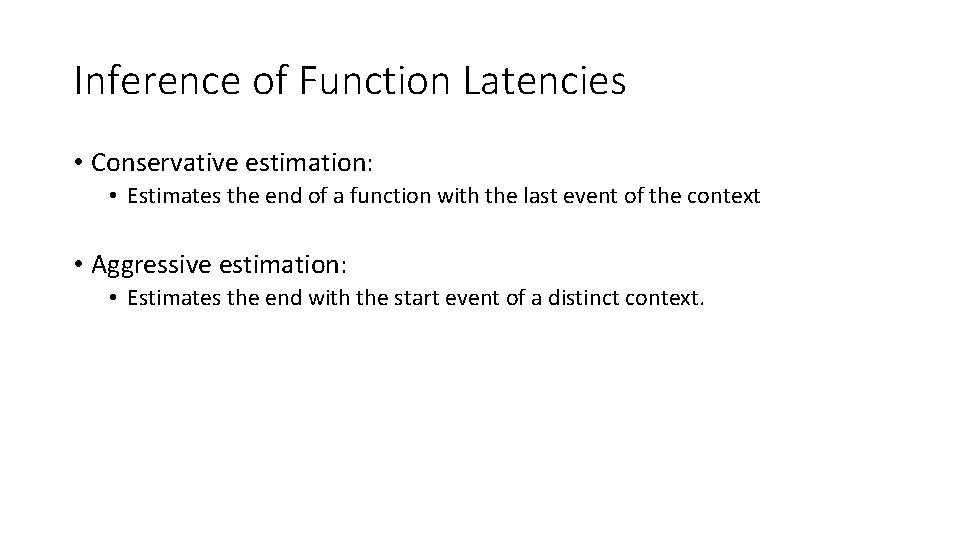
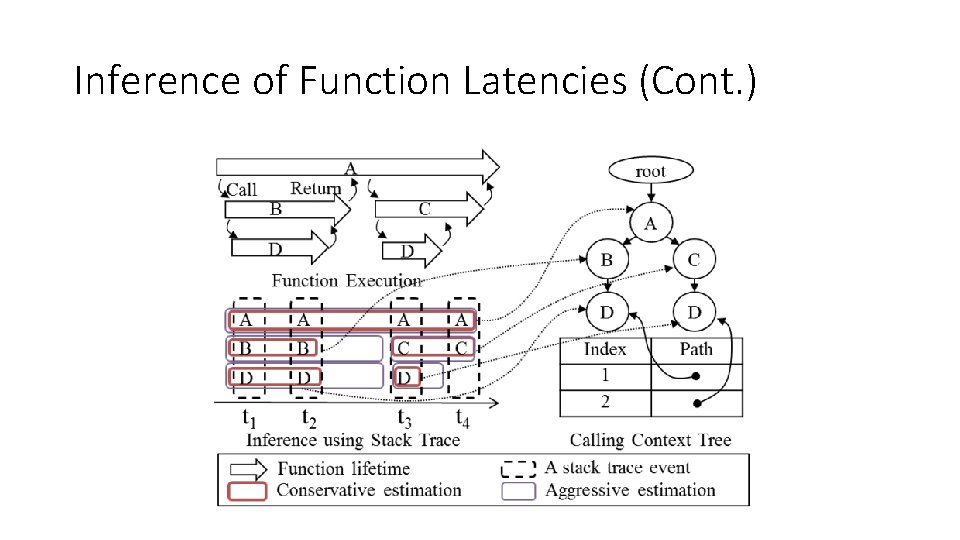
Inference of Function Latencies • Conservative estimation: • Estimates the end of a function with the last event of the context • Aggressive estimation: • Estimates the end with the start event of a distinct context.

Inference of Function Latencies (Cont. )

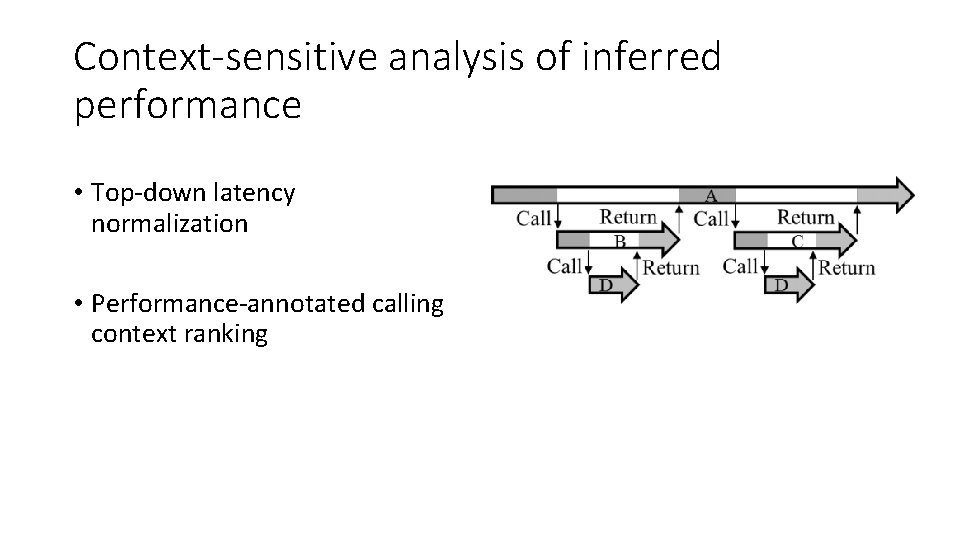
Context-sensitive analysis of inferred performance • Top-down latency normalization • Performance-annotated calling context ranking

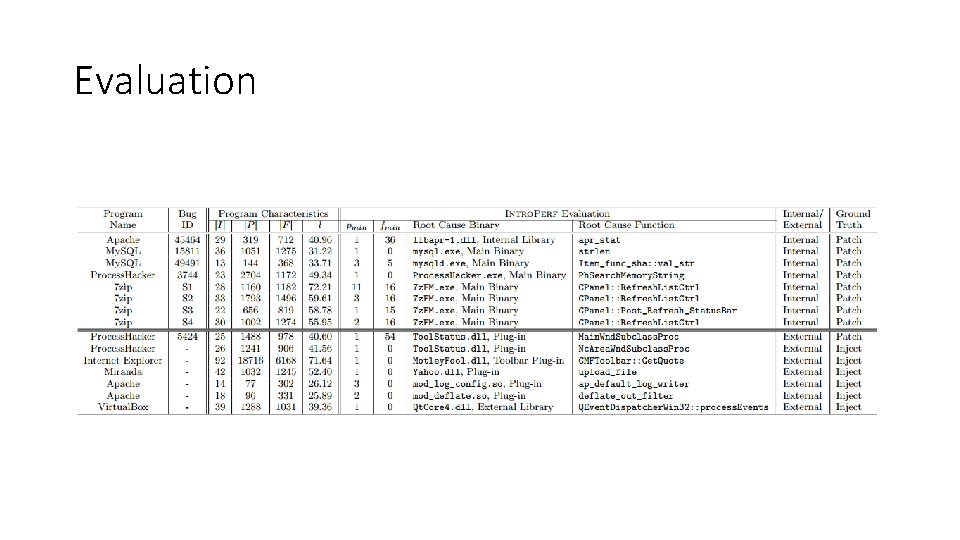
Evaluation

Summary of the papers • http: //joshuatang. github. io/timeline/papers. html