TFAWS Short Course ThermoElectric Coolers NASA GSFC Presented


![Sources / References • • • Marlow Industries [www. marlow. com] Laird Technologies (nee: Sources / References • • • Marlow Industries [www. marlow. com] Laird Technologies (nee:](https://slidetodoc.com/presentation_image_h/a28d4e6fcb388286b3a2f9fc1bc62daf/image-116.jpg)
- Slides: 116

TFAWS Short Course Thermo-Electric Coolers NASA GSFC Presented By Eric W. Grob NASA Goddard Space Flight Center Eric. W. Grob@nasa. gov Thermal & Fluids Analysis Workshop TFAWS 2011 August 15 -19, 2011 NASA Langley Research Center Newport News, VA

Overview • Introduction • Principles of Operation – Some background in semiconductors • Design Information – Design Considerations – Walk-through Examples • Real Life Projects – Early Use on Satellite – Hubble – ST-8 LHP TFAWS – August 15 -19, 2011 2

Acknowledgments • Fundamental information on Thermo-Electric Coolers presented herein has been extracted from several sources, all of which are available in the public domain. A list of websites used is included in the references. Many thanks go to Dr. Jentung Ku (NASA GSFC) for the information from his papers on this topic, and to David Steinfeld for his garage-built TEC “experiment”. TFAWS – August 15 -19, 2011 3

Overview • The thermoelectric effect is the direct conversion of temperature differences to electric voltage and vice-versa. – A thermoelectric device creates a voltage when a temperature difference is applied to it. – Conversely, when a voltage is applied to it, it creates a temperature difference. TFAWS – August 15 -19, 2011 4

Why Use Them ? • Pros: – Unlike common heat pumps (compression/expansion-based and Stirling cycle), these devices have no moving parts and work in any orientation • simple, reliable, compact, low mass, and noiseless, vibration-less operation. – Less maintenance - more than 100, 000 hours of life for steady state operation – Function in environments that are too severe, too sensitive, or too small for conventional refrigeration – Contains no chlorofluorocarbons or other materials which may require periodic replenishment • Temperature control to within fractions of a degree using appropriate support circuitry. – Low thermal mass and fast response time of TECs, when combined with an appropriate control loop, can provide precise temperature control. In relatively stable thermal sink environments, TECs achieve 0. 01°C temperature stability. Such extreme stability is difficult to achieve by other means. – The direction of heat-pumping is fully reversible. Changing the polarity of the DC power supply causes heat to be pumped in the opposite direction, i. e. - a cooler can become a heater. – Temperature differences: • for a hot side around room temperature, temperature differences of about 72°C and 125°C can be achieved by single-stage and multistage TECs, respectively. • In situations where the object being cooled generates little or no heat the combination of TE cooling and thermal insulation can produce large temperature differences. • Cons: – structural integrity of bismuth telluride and soldered joints when subjected to differential thermal expansion stresses. – relatively low COP, particularly with large temperature differences. • this can be acceptable when the heat load is small. • best suited to situations with modest heat loads, cold temperatures not below 150°K, and hot-tocold-side differences not exceeding 100°C. • not recommended for use below 130°K because of their prohibitively low efficiencies. TFAWS – August 15 -19, 2011 5

Thermoelectric Effects • Three separate theories behind the operation of thermoelectric cooling first appeared in the 1800 s. • Seebeck effect: Alessandro Volta and Thomas Johann Seebeck (1821) found that holding the junctions of two dissimilar conductors at different temperatures creates an electromotive force or voltage. This is the basis for thermocouples. • Peltier effect: Jean-Charles Peltier discovered (1834) a heating/cooling effect when passing electric current through the junction of two conductors. • Thomson effect: William Thomson (Lord Kelvin) showed (1851) that over a temperature gradient, a single conductor with current flowing in it has reversible heating and cooling. TFAWS – August 15 -19, 2011 Note that the Peltier effect is the inverse of the Seebeck effect. 6

So What Took So Long To Use Them - TEC Evolution • Although these principles were discovered in the 1800’s, most early work was on metal alloys, not thermoelectric compounds. it wasn’t until the introduction of semiconductor materials in the late 1950’s, that thermoelectric cooling became a viable technology for [small] cooling applications. • The characteristics of TECs make them highly suitable for precise temperature control applications and where space limitations and reliability are paramount or refrigerants are not desired. • TECs have several advantages over competing technologies, including: – high reliability potential – noise-free operation – vibration-free operation – scalability – orientation-independence and compactness (high energy density). • Based on these advantages, TECs now dominate certain applications, and new benefits continue to emerge. • TECs in space have become relatively common; they provide temperature control for low noise amplifiers (LNAs), star trackers, and IR (infrared) sensors. TFAWS – August 15 -19, 2011 7

Seebeck Effect • The voltage difference, V, produced across the terminals of an open circuit made from a pair of dissimilar metals, A and B, whose two junctions are held at different temperatures, is directly proportional to the difference between the hot and cold junction temperatures, THOT – TCOLD V = α(THOT - TCOLD) where α = Seebeck coefficient • The temperature difference, produces an electric potential (voltage) that can drive an electric current in a closed circuit. • Using the Seebeck effect, thermoelectric power generators convert heat to electricity. – Very inefficient – Used when waste heat is readily available, or in remote areas where dependability overrides efficiency TFAWS – August 15 -19, 2011 8

Peltier Effect • When an electric current flows through two dissimilar conductors, depending on the direction of the current flow, the junction of the two conductors will either absorb or release heat. • The heat absorbed or released at the junction is proportional to the electrical current. The proportionality constant is known as the Peltier coefficient. Q = π*I where π = Peltier coefficient and I= junction current • Thomson (Lord Kelvin) showed the relationship between the Seebeck and Peltier coefficients as: π = αT T = temperature of the junction (°K) α = Seebeck Coefficient (V/°K) • Semiconductors are materials of choice for producing the Peltier effect. – They are more easily optimized for pumping heat – Designer can control the type of charge carrier employed within the conductor • With semiconductor advancements, thermoelectric modules can now be produced to deliver efficient solid state heat pumping for both heating and cooling. TFAWS – August 15 -19, 2011 9

But What Are These Coefficients ? • Remember that the Seebeck Effect - a voltage is produced when a temperature difference is applied across a junction of dissimilar materials. This applied temperature difference causes charged carriers in the material, whether they are electrons or holes, to diffuse from the hot side to the cold side, similar to a gas that expands when heated. • The efficiency with which a thermoelectric material generates electrical power depends on several material properties, of which perhaps the most important is thermo-power, or Seebeck coefficient ( ). – inversely related its carrier density - a higher results in decreased carrier concentration and decreased electrical conductivity. Therefore, insulators tend to have very high Seebeck coefficients, while metals have lower values. – depends on the material's temperature, and crystal structure and has units of V/°K, or μV/°K. • Typically metals have small coefficients because most have half-filled bands. Electrons (negative charges) and holes (positive charges) both contribute to the induced thermoelectric voltage thus canceling each other's contribution to that voltage and making it small. – Superconductors have a zero coefficient because it is impossible to have a finite voltage across a superconductor, but can be doped with an excess amount of electrons or holes and thus can have large positive or negative coefficients, depending on the charge of the excess carriers. • A larger induced thermoelectric voltage for a given temperature gradient will lead to a higher efficiency. There is an active research effort to find materials that could make cheaper and more efficient thermoelectric power generators. TFAWS – August 15 -19, 2011 10

Seebeck Coefficient - Examples • Bismuth telluride (Bi 2 Te 3): 287 μV/°K – A gray powder that is a compound of bismuth and tellurium. It is a semiconductor which, when alloyed with antimony or selenium is an efficient thermoelectric material for refrigeration or portable power generation. Furthermore, the Seebeck coefficient of bulk Bi 2 Te 3 becomes compensated around room temperature, forcing the materials used in power generation devices to be an alloy of bismuth, antimony, tellurium, and selenium. • Uranium dioxide (UO 2): 750 µV/°K – also known as urania or uranous oxide, is an oxide of uranium, and is a black, radioactive, crystalline powder that occurs naturally. Used in nuclear fuel rods. A mixture of uranium and plutonium dioxides is used as MOX fuel. Prior to 1960 it was used as yellow and black color in ceramic glazes and glass. • Perovskite - Sr. Ru. O 3 (Strontium/Ruthenate): 36 μV/° K • Constantan: 35 µV/°K • Thallium tin telluride (Tl 2 Sn. Te 5): 270 µV/°K TFAWS – August 15 -19, 2011 11

Making a Semiconductor • One process forming crystalline wafers is forming a cylindrical ingot of high purity monocrystalline silicon is formed by pulling a seed crystal from a 'melt'. A wafer is a thin slice of semiconductor material from these ingots. • Wafers are formed of highly pure (99. 9999% purity), nearly defect-free single crystalline material. • Dopants (impurity atoms) such as boron or phosphorus can be added to the molten intrinsic silicon, thus changing it into n-type or p-type extrinsic silicon (more on this later). • The wafer serves as the substrate for microelectronic devices built in and over the wafer and undergoes many microfabrication process steps such as doping or ion implantation, etching, deposition of various materials, and photolithographic patterning. • Finally the individual microcircuits are separated (dicing) and packaged. TFAWS – August 15 -19, 2011 12

Doping to Make P- or N-Type Semiconductors • Semiconductor doping was formally first developed by John Robert Woodyard working at Sperry Gyroscope Company during World War II. – N-Type: Doping pure silicon with Group V elements (nitrogen (N), phosphorus (P), arsenic (As), antimony (Sb), bismuth (Bi)), extra valence electrons are added that become unbonded from individual atoms and allow the compound to be an electrically conductive (N-Type). – P-Type: Doping with Group III elements (boron (B), aluminum (Al), gallium (Ga), indium (In), thallium (Tl)), which are missing the fourth valence electron, creates "broken bonds" (holes) in the silicon lattice that are free to move. The result is an electrically conductive p-type semiconductor. TFAWS – August 15 -19, 2011 13

Making a Semiconductor • Semiconductor device fabrication is the process used to create the integrated circuits that are present in everyday electrical and electronic, including thermoelectric, devices. – Multiple-step sequence of photographic and chemical processing steps during which electronic circuits are gradually created on a wafer made of pure semiconducting material. – Silicon is almost always used, but various compound semiconductors are used for specialized applications. – The entire manufacturing process, from start to packaged chips ready for shipment, takes six to eight weeks and is performed in highly specialized facilities. • When feature widths were far greater than about 10 microns, purity was not the issue that it is today in device manufacturing. As devices became more integrated, cleanrooms became even cleaner. The workers in a semiconductor fabrication facility are required to wear cleanroom suits to protect the devices from human contamination. • In an effort to increase profits, semiconductor device manufacturing has spread from Texas and California in the 1960 s to the rest of the world, such as Europe, Middle East, and Asia. TFAWS – August 15 -19, 2011 14

Manufacturing a TEC • Semiconductor manufacturing process is beyond the scope of this course (and the instructor’s capability!), but an quick overview is shown below. TFAWS – August 15 -19, 2011 15

Cool Picture TFAWS – August 15 -19, 2011 16

Heat Flow in TE Module • The simplest form of a thermoelectric module: a single semiconductor “pellet’ is soldered to electrically conductive material (plated copper) on each end. – “N-Type” semiconductor material: electrons are repelled by the negative pole of the power supply and attracted by the positive pole. Electrons carry the heat – “P-type” semiconductor material: “holes” are repelled by the positive pole of the power supply and attracted by the negative pole. “Holes” carry the heat. – It is the charge carriers inherent in the material structure that dictate the direction of the heat flow. • This thermoelectric effect and its application in thermoelectric devices involves very complex physics at the subatomic level. For you sub-atomic physicists out there, this is way outside the scope of this course……. TFAWS – August 15 -19, 2011 17

How to Use Semiconductors in TECs • Multiple pellets are needed in order to pump an appreciable amount of heat through a thermoelectric module. • One idea is to connect N-type or P-type material in parallel , both electrically and thermally. Unfortunately, this is not practical. – Typical semiconductor pellet is only rated for “tens” of milli-volts. – A single pellet can draw 5 amps or more with 60 m. V applied. – A 254 -pellet device will draw more than 1000 amps with 60 m. V applied. • The only realistic solution is to wire the semiconductors in series electrically and in parallel thermally. – Interconnections between pellets introduce thermal shorting that significantly compromises the performance of the device. So how do they make this work ? TFAWS – August 15 -19, 2011 18

Aha ! • Use both “N-type” and “P-type” materials. – Arrange N and P-type pellets in a “couple” and form a junction between them with a copper tab. – Free end of P-type pellet connects to the positive voltage potential – Free end of the N-type pellet connects to the negative side of the voltage. – Electrons flow continuously from negative pole of the supply, through the N pellet, through the copper tab junction, through the P pellet, and back to the positive pole of the voltage supply. – Configure a series circuit that keeps all of the heat moving in the same direction. – The two different types of semiconductor material keep the charge carriers and heat flowing in the same direction through the pellets. TFAWS – August 15 -19, 2011 19

Simplest TEC • The simplest TEC consists of two semiconductors: – One p-type and one n-type (one "couple") semi-conductor, connected by a metallic conductor. – When a positive DC voltage is applied as shown, electrons pass from the p-type to the ntype element, and the cold-side temperature decreases as the electron current absorbs heat, until equilibrium is reached. – Heat is pumped from the cold junction to the hot junction. The net cooling is diminished by the effects of Joulean losses generated by the current, and heat conduction through semiconductor material from the hot to the cold junction (back conduction). TFAWS – August 15 -19, 2011 20

Brilliant ! • Using this special properties of thermoelectric “couples”, many pellets can be arranged in rectangular arrays to create practical thermoelectric modules. – The device can pump appreciable amounts of heat – Series electrical connection is suitable for commercially available DC power supplies. • Most common thermoelectric devices – 254 alternating P and N-type pellets – Use 12 to 16 VDC supply – Draw 4 to 5 amps TFAWS – August 15 -19, 2011 21

Thermal Gradients Within a Thermo-Electric Couple • Same as “couples” just covered, except packaging ceramic layers added. • Temperature extremes are at the “junctions”. TFAWS – August 15 -19, 2011 22

Constructing a TEC • A typical single stage cooler consists of two ceramic plates with an array of these p-type and n-type semiconductor materials (bismuth telluride alloys) between the plates. These multiple elements of semiconductor materials are connected electrically in series and thermally in parallel. • When a positive DC voltage is applied as shown, electrons pass from the p-type to the n-type element, and the cold-side temperature decreases as the electron current absorbs heat, until equilibrium is reached. The heat absorption (cooling) is proportional to the current and the number of thermoelectric couples. This heat is transferred to the hot side of the cooler, where it is dissipated into the heat sink and surrounding environment. TFAWS – August 15 -19, 2011 23

From Schematic to Packaging • So, the most efficient scheme is to connect our P-N pellets electrically in series, but thermally in parallel. • Metalized ceramic substrates provide the platform for the pellets and the small conductive tabs that connect them. The pellets, tabs and substrates thus form a layered configuration. TFAWS – August 15 -19, 2011 24

Real TEC Modules - Single • A typical thermoelectric module consists of an array of Bismuth Telluride semiconductor pellets that are “doped” with P and N pellets, . • Module size varies from less than 0. 25” x 0. 25” to approximately 2. 0” x 2. 0”. TFAWS – August 15 -19, 2011 25

Real TEC Modules - Multiple • Some applications require: – multiple single-stage: – or stacked multistage modules. • Multistage TEC's (also called cascade or stacked thermoelectric modules) are used where larger delta T's are required. TFAWS – August 15 -19, 2011 26

Peltier Videos • Illustrates the basic function, i. e. - create a temperature difference to generate voltage (power). – http: //youtu. be/pg. IOUXKyz. FE • And this one illustrates applying a voltage to get cooling. – http: //youtu. be/u 46 VGSw 9 v 1 I TFAWS – August 15 -19, 2011 27

THAT’S GREAT, BUT HOW DO I USE ALL THIS KNOWLEDGE? Design Guide Online Application S/W Desktop Software TFAWS – August 15 -19, 2011 28

Some Terminology • Temperature Difference ( T): hot side temperature of the module minus the cold side temperature of the module. Temperatures are referenced at the ceramic substrates of the module. • Qc: total rate of heat being removed from the cold side of the module. • Waste Heat: this is the rate of heat the heat sink attached to the hot side of the module must dissipate. It is the sum of the heat removed from the cold side of the module plus the Joulean losses from the power input to the module plus parasitics. • Input Voltage: the voltage applied to the module. • Input Current: the current the module will draw at a particular input voltage. • Coefficient of Performance (COP): ratio of heat removed to power input. • QMAX: The amount of heat that a TEC can remove at a 0°temperature difference when the hot‐side of the elements within thermoelectric module are at 300°K (27°C). • IMAX: The current that produces Tmax when the hot‐side of the elements within thermoelectric module are held at 300°K (27°C). • VMAX: The voltage that is produced at DTmax when Imax is applied and the hot‐side temperature of the elements within thermoelectric module are at 300 K. • TMAX: The maximum obtainable temperature difference between the cold and hot side of thermoelectric elements within module when Imax is applied and there is no heat load applied to the module. This parameter is measured with the hot‐side of an element at a temperature of 300°K (27°C). . – In reality, it is virtually impossible to remove all sources of heat in order to achieve the true Tmax. Therefore, the number only serves as a standardized indicator of the cooling capability of a thermoelectric module. TFAWS – August 15 -19, 2011 29

What Do All These Terms Mean? • The terms Imax, Vmax , Qmax and ΔTmax never cease to confuse people. • All these terms are defined at a given hot side temperature Thot of the TEC. • Imax, Vmax and ΔTmax occur at the same time with Q = 0. • Imax, Vmax and Qmax occur at the same time with ΔT = 0. • Qmax and ΔTmax are shown on the performance curve as the end points of the Imax line. TFAWS – August 15 -19, 2011 30

Illustration of Terms • IMAX corresponds to the current that gives TMAX at QC = 0. • QMAX: is the amount of heat that a TEC can remove at a 0°temperature difference when the hot‐side of the elements within thermoelectric module are at 300°K (27°C). • TMAX is the maximum obtainable temperature difference between the cold and hot side of thermoelectric elements within module when Imax is applied and there is no heat load applied to the module. This parameter is measured with the hot‐side of an element at a temperature of 300°K (27°C). Pump Analogy ? TFAWS – August 15 -19, 2011 31

Another View of Same Type of Data Melcor TFAWS – August 15 -19, 2011 32

What Does Imax Mean ? • Imax is the direct current level which will produce the maximum possible ΔT, (i. e. ΔTmax), across the TEC with no heat load (Q=0). . • Imax Operating below Imax there is insufficient current to deliver the ΔTmax • Operating above Imax the power dissipation within thermoelectric begins to elevate the system temperature and diminish ΔT. • Imax and Vmax occur at the same operating point, i. e. Imax is the current level produced by applying Vmax to thermoelectric device. • Imax is not especially temperature-dependent. It tends to be fairly constant throughout the operating range of a thermoelectric device. • Imax is NOT the maximum current that the TEC can withstand before failing. • Thermoelectrics generally operate within 25% - 80% of the maximum current. TFAWS – August 15 -19, 2011 33

What Does Vmax Mean ? • Vmax is the DC voltage which will deliver the maximum possible ΔT (i. e. ΔTmax), across the TEC with no heat load (Q = 0) • At voltages below Vmax, there is insufficient current to deliver ΔTmax • At voltages above Vmax, the power dissipation within thermoelectric begins to elevate the system temperature, and diminish ΔT. • Imax and Vmax occur at the same operating point, i. e. Imax is the current level produced by applying Vmax to thermoelectric device. • Vmax is temperature-dependent. The higher the Thot , the higher the Vmax rating for a specific device. • Vmax is NOT the maximum voltage that thermoelectic device can withstand before failing. TFAWS – August 15 -19, 2011 34

What Does Qmax Mean ? • Qmax is the maximum load to thermoelectric device that produces ΔT = 0. • Qmax, Imax, and Vmax occur at the same operating point to produce ΔT= 0. • It specifies an end point on the load line. • Qmax does not project the maximum heat that can be handled by thermoelectric device. – If the load goes beyond, the TEC will still pump the heat, but thermal load simply winds up at an above-ambient temperature. (i. e. you have to look at different performance curve. ) TFAWS – August 15 -19, 2011 35

What Does Tmax Mean ? • ΔTmax – Ia the maximum possible ΔT across thermoelectric device at a given Th. – ΔTmax always occurs at Q = 0. – ΔTmax always occur at Imax, and Vmax – ΔTmax specifies another end point on the load line. TFAWS – August 15 -19, 2011 36

TEC Performance Curve • The performance chart can be used to define all four engineering parameters providing that two are known or defined by a given cooling requirement. • Generally, Thot, Tcold, and Qc are known and the I and V needed to produce this cooling is of interest. • You can use this to analyze a test result when V, I, Thot, and Tcold were measured, and you want to know Qc. • Start with the known parameters and graph them as shown in the example. TFAWS – August 15 -19, 2011 37

Let’s Try It !! • If you know the desired T and QC: 1 – Draw in the curve for the desired Q C. 2 – Draw the horizontal line for the desired ΔT. 3 – Draw a vertical line downward from the intersection of the ΔT line and the QC curve on the upper graph into the lower graph. 4 – Draw the horizontal V line, the placement being determined by calculating the ratio of AB/BC = EF/FG as shown on the graphs above. 2 1 3 3 4 – So, this example shows that for the selected TEC, to achieve 20 W of cooling with a 36°C ΔT, requires 3. 9 A at 9. 5 V. TFAWS – August 15 -19, 2011 38

TEC Selection - Process • Calculate heat loads In choosing a TEC, it is vital to understand thermal load. There are two components in thermal load in a thermoelectric system – Active load: Heat that is generated by the electrical components that require cooling – active heat dissipation from components – Passive load: Passive heat loads are parasitic in nature and may consist of radiation, convection, or conduction. • Define Temperatures – Know your TEC’s sink temperature: example - must account for temperature drop from TEC to radiator and size/design to maintain the temperature you prescribe…. . more parasitics!! • Determine number of stages required – Function of overall T, rather that heat load. – Generally one stage will suffice for many applications, but multi-stages are possible, depending on the overall T. • Select a TEC from vendor data/catalog using performance curves • Call vendor to discuss !!! TFAWS – August 15 -19, 2011 39

TEC Selection – Example (Marlow Guide) TFAWS – August 15 -19, 2011 40

TEC Selection – Example (Marlow Guide) TFAWS – August 15 -19, 2011 41

TEC Selection – Example (Marlow Guide) TFAWS – August 15 -19, 2011 42

TEC Selection – Example (Marlow Guide) TFAWS – August 15 -19, 2011 43

TEC Selection – Example (Marlow Guide) See next page for Excerpt from Marlow Catalog TFAWS – August 15 -19, 2011 44

Select From Marlow Single-Stage Small size (<15 mm) for lower heat load applications. Reduced power consumption Large size (>15 mm) for medium to high heat load applications. Reliable in many applications with moderate on/off cycles, temperature cycles and for short term high temperature requirements. Unique diffusion barrier and solder type extends the operating conditions beyond standard commercial TEC Modules. Small size, high performance, telecom grade performance. Low power consumption using highest performance MAM thermoelectric material. Designed for qualification to Telcordia reliability assurance. TFAWS – August 15 -19, 2011 45

TEC Selection – Example (Let’s Try One !!) 2. 0 0. 4 0. 0 0. 6 3. 0 0. 0 -10. 0 TFAWS – August 15 -19, 2011 46

TEC Selection – Example (Marlow Guide) TFAWS – August 15 -19, 2011 47

TEC Selection – Example (Marlow Guide) 10. 0 67. 0 0. 15 0. 85 TFAWS – August 15 -19, 2011 48

TEC Selection – Example (Marlow Guide) 0. 15 0. 85 TFAWS – August 15 -19, 2011 49

TEC Selection – Example (Marlow Guide) 3. 0 0. 15 0. 85 RC 6 -4 -01 RC 3 -2. 5 -01 20. 0 3. 5 20. 0 6. 0 3. 7 2. 5 8. 2 3. 6 See next page for Excerpt from Marlow Catalog TFAWS – August 15 -19, 2011 50

Select From Marlow Single-Stage Small size (<15 mm) for lower heat load applications. Reduced power consumption Large size (>15 mm) for medium to high heat load applications. Reliable in many applications with moderate on/off cycles, temperature cycles and for short term high temperature requirements. Unique diffusion barrier and solder type extends the operating conditions beyond standard commercial TEC Modules. Small size, high performance, telecom grade performance. Low power consumption using highest performance MAM thermoelectric material. Designed for qualification to Telcordia reliability assurance. TFAWS – August 15 -19, 2011 51

Our Selected TEC - Features TFAWS – August 15 -19, 2011 52

Our Selected TEC - Performance TFAWS – August 15 -19, 2011 53

TEC Performance Curves (Marlow DT 3 -6) TFAWS – August 15 -19, 2011 54

Check Performance Parameters 65. 0 20. 0 3. 7 8. 2 10. 0 65. 0 0. 15 TFAWS – August 15 -19, 2011 55

Check Performance Parameters 3. 0 20. 0 0. 15 0. 16 3. 7 0. 16 0. 59 TFAWS – August 15 -19, 2011 56

Check Performance Parameters 0. 22 0. 11 0. 59 8. 2 0. 22 1. 8 8. 2 0. 11 0. 9 1. 8 1. 06 TFAWS – August 15 -19, 2011 57

Check Performance Parameters 3. 0 1. 06 4. 1 TFAWS – August 15 -19, 2011 58

Coefficient Of Performance • Coefficient Of Performance is an indicator of the efficiency of a thermoelectric cooling or heating system. 3. 0 / [ 2. 5 * 0. 85 ] = 1. 41 COP = QC / (VTE * ITE) QC = heat pumped by thermoelectric device VTE * ITE = power supplied to thermoelectric device • COP depends on heat pumped and the temperature differential required. • Typical COP for pumping heat is between 0. 4 and 0. 7. TFAWS – August 15 -19, 2011 59

Remember…. . • All thermoelectrics are rated for Imax, Vmax , Qmax and ΔTmax at a specific value of hot side temperature THOT. • As thermoelectric operates, the current flowing through it has two effects: – Peltier effect (cooling) – Joulean effect (heating). • The Joulean effect is proportional to the square of the current. As the current increases, the Joulean heating dominates the Peltier cooling and causes a loss in net cooling. The cut-off defines Imax for thermoelectric. TFAWS – August 15 -19, 2011 60

Using these Performance Curves • Problem: Can I keep a 2 W CCD at 0°C in a 50°C instrument? – TEC hot side is the chassis wall: THOT = 50°C – TEC cold side is the CCD: TCOLD = 0°C – So T = 50°C – If 2 volts is applied to the TEC, an electric current between 2. 5 and 3. 2 amps will flow to the TEC. The exact amount of current is a function of the heat being pumped. – If the current is 3. 0 amps (the applied power is 6. 0 W) and the temperature difference across the TEC is 50 K, then the heat being pumped (the “HEAT LOAD” on the figure) is 2 W. – COP = 2. 0/3. 0 = 33% TFAWS – August 15 -19, 2011 61

Use Vendor Website Design Tools TFAWS – August 15 -19, 2011 62

DESIGNING WITH TECS This information provided is generic in nature, but provides good guidelines to consider in a space application. Much of that type of information is considered ITAR sensitive, thus it can’t be included here. TFAWS – August 15 -19, 2011 63

Designing With TECs • Before the cooler or heat sink can be selected, the cooling requirements must be defined. This includes – determining the amount of heat to be pumped. This includes the heat load from whatever you are trying to cool, the Joulean heat of the TEC, and parasitics from the hot side to the cold side. • Note: additional parasitics from the hot side to the final thermal sink (e. g. - radiator) must be added for the total heat rejection load. Convection/radiation from the hot side to the cold side, along with back conduction through the TEC itself. • Minimizing the heat load allows the cooler to achieve colder temperatures or reduces the power required to reach the defined cooling level. TFAWS – August 15 -19, 2011 64

Designing With TECs • For heating/cooling applications, focus first on the cooling side. – If you have enough capacity for cooling, you should have plenty for heating. • Calculate/estimate total heat loads – Active load – Passive load • Define temperatures – TEC hot side – TEC cold side – ΔT • Define constraints – Available TEC power – Physical (space, weight, etc. ) limitations • Determine number of stages required • Select an appropriate TEC – See vendor design guides and catalogs for details TFAWS – August 15 -19, 2011 65

Different Shapes…… • The hot side has two symmetrical porches for wires carrying. The wires are perpendicular to the longer side of the hot surface. – Option 1. The hot and top sides are equal. No porches for wires carrying. – Option 2. The hot side has a porch for wires carrying. The wires are perpendicular to the shorter side of the hot face. • The cold and hot sides are equal and elongated. The wires are perpendicular to the shorter side of the hot sides. TFAWS – August 15 -19, 2011 66

Wire Lead Configurations…… • Wire thickness is applied depending on TEC power consumption (electric current Imax). – – optional thickness, length and material of wires insulated / color coded wires bonding pads suitable for wire bonding mounting posts TFAWS – August 15 -19, 2011 67

Surface Finish Options…. . • Blank (naked) ceramics • Metalized (gold plating or Ni/Sn) • Metalized and Pre-tinned surfaces. A range of solders can be applied for pre-tinning by request. • Different combinations of the cold and hot sides finish, for instance, gold plated hot side and naked ceramics cold side. TFAWS – August 15 -19, 2011 68

Customized………. . • Thin film conductive patterns can be printed directly onto the TEC cold side. – Direct mounting of laser, CCD, photodetector chips on TE module cold side surface. • Typical plating: – Gold plating, provided for wire bonding. – Ni/Sn plating for solderability – Selective pre-tinning also possible TFAWS – August 15 -19, 2011 69

Temperature Monitoring…. . • Mounting of thermistors or PRTs on a TEC cold side to – monitor performance. – provide feedback to controller (more in a few charts) TFAWS – August 15 -19, 2011 70

Heat Sinks • Design of heat sink is critical to the overall thermoelectric system performance. – All TECs require a heat sink and will be destroyed if operated without one. – The heat sink temperature affects the TEC hot side temperature, which in turn affects the cold side temperature that can be achieved with a TEC. • The thermal resistance of the heat sink is the measure of heat sink’s ability to dissipate heat. R = (T 1 -T 2)/Q R = thermal resistance T 1 = heat sink temperature T 2 =coolant temperature Q = total load to heat sink (active + passive) • Once the heat sink resistance is calculated, it is time to “hit the catalogs. ” TFAWS – August 15 -19, 2011 71

Power Supply • Thermoelectrics operate from a DC power supply. • Both linear and switching power supplies can be used to operate TECs. • The ‘quality” of the DC current is important for TEC operation. – High quality current is smooth and constant with very low ripple or noise. • All current derived from AC sources contains ripple. • Ripple can affect the performance and life of the TEC. • Reversible voltage if you want thermoelectric to act as cooler and heater. TFAWS – August 15 -19, 2011 72

Types of Power Supply/Control • TECs are low voltage and high current devices. Controllers are usually required to provide the appropriate current. • On / Off Control – Simplest and most crude technique – TEC power is cycled from full ON to full OFF – Thermal cycle could degrade the life of the TEC • Proportional Control – Residual error always exists • Proportional-Integral (PI) Control – Eliminates the residual error • Proportional-Integral-Derivative (PID) Control – Adds a derivative circuit to the PI controller to improve the transient response • Pulse Width Modulation Control – Controls the duty cycle and the frequency of power applied to TEC TFAWS – August 15 -19, 2011 73

TEC Electrical Interfaces • A temperature sensor is usually used as input to the controller to measure the cold side temperature. • As the controller senses a change in the temperature, it decides if it needs to heat or cool the TEC. • The controller will apply current in one direction if heating is needed and in the opposite direction if cooling is needed. • When a change in the direction is required the controller will smoothly drop the current to zero before applying current in the opposite direction. • The only electrical connections to the TEC are the two wires providing the current. TFAWS – August 15 -19, 2011 74

TEC Mounting - Overview • Several methods of installing TECs – Solder – Adhesive bonding – Mechanical clamping • For a TEC with a ceramic base of 19 mm or less, soldering or adhesive bonding can be used without fear of failure due to thermal stresses. – Pick adhesive with CTE between ceramic and sink material. – Adhesives and greases are prone to outgassing, and need special consideration for vacuum usage. • If the TEC base is larger than 19 mm, mechanical clamping should be used. – A TEC must have metallization on the hot and/or cold ceramic in order to be mounted using solder. – Thermoelectric modules are relatively strong in compression and weak in shear. • Surface Preparation – Surface flatness should be within 0. 001” regardless of which method is used. – Surface should be clean and free from oil, nicks, and burrs. TFAWS – August 15 -19, 2011 75

TEC Mounting - Solder • When to Use – When minimal outgassing is required – When TEC is smaller than 19 mm – When a high strength junction is required – When high thermal conductivity is required • Procedure – Clean the surface to be soldered using methanol, acetone, or solvent – Do not mix solders. Use a separate soldering iron or a new tip for each solder. – See Marlow’s Design Guide for details. TFAWS – August 15 -19, 2011 76

TEC Mounting - Adhesive Bonding • When to Use – When permanent attachment of TEC to heat sink is desired – When solder is not an option – When all TECs need to be lapped to the same height after mounting • Procedure – Clean and prepare mounting surfaces of TECs and heat sinks using methanol, acetone, or solvent – Coat the TEC ceramic with approximately 0. 05 mm thick layer of epoxy – Place TEC on heat sink and gently rotate the TEC back and forth, squeeze out excessive epoxy – Using a clamp or weight, apply pressure (less than 100 psi), and cure for 2 hours at 65°C. Curing time at room temperature is 24 hours. TFAWS – August 15 -19, 2011 77

TEC Mounting - Mechanical Clamping (1/2) • When to use – When the TEC is larger than 19 mm – When permanent bond is not desired – When multiple TECs are used • Preparation – The mounting surfaces should be flat within 0. 001”. – If more than one module is to be used in the assembly, all modules should be within 0. 001” in height. – Mounting and module surfaces should be carefully cleaned to remove any grits, burrs, etc. • Thermal resistance occurs at each interface of an assembly and affects overall system performance. – Interface materials must be used to fill in the small thermal gaps. • Silicone-base thermal grease (not for flight) • Graphite foil • Thermally-conductive pads – Uniform pressure should be applied during installation. TFAWS – August 15 -19, 2011 78

TEC Mounting - Mechanical Clamping (2/2) • Ensure an even pressure across the module surface when tightening the screws. Maximum recommended compression loading (pressure) is 350 psi – Marlow recommends 150 psi or less. • If possible, use only two compression points per module, and keep them close to sides of TEC (0. 15” to 0. 25”). • The two compression points should be along the center line of the TEC. • Slowly adjust the tension on the screws and alternate frequently between the two compression points. • A common error is to tighten one side so that it tips below the top surface of the TEC; the when pressure is increased on the other side, it creates leverage which crushes the TEC. TFAWS – August 15 -19, 2011 79

Review (1/3) • A single TEC can be used for heating and cooling by reversing the polarity of the applied voltage. Any thermoelectric system will have a greater capacity for heating a load than cooling it. • TECs can actively pull heat out of a load, making it possible to reach below-ambient temperatures. • How cold TEC can get depends on many factors. – Heat load – Ambient temperature – Optimization of current delivery to TEC – Optimization of heat sink • It is theoretically possible to get ΔT of 75 °C at Thot = 35 °C with no heat load. – In reality, ΔT of 40 °C can be achieved with a single stage TEC. • Multi-stage TECs can be used to achieve colder (and cryogenic) temperatures. – TEC is less efficient at colder temperature – The ΔT rating is markedly reduced – The cooling capacity is significantly reduced compare to single stage counterpart – More expensive TFAWS – August 15 -19, 2011 80

Review (2/3) • Avoid imposing an excessive cooling rate on TEC. – With differential compression/expansion responses among the component materials, excessive ramping rate may destroy Peltier device. – No greater than 1 °C/second (heating or cooling) • As long as you provide sufficient voltage and current capability from your power supply, TECs may be connected in any series/parallel configuration that makes sense for the application. • There is no advantages to connecting TECs in series versus parallel so far as heat pumping of individual TEC is concerned. – However, parallel wiring does offer some protection against a TE device or connection failure. • Measuring electrical resistance is a good way to check the health of a TEC. – Should measure AC resistance using a digital impedance meter or LCR – If DC is applied as with the standard ohm meter, a ΔT will develop across the module and this will result in the buildup of a Seebeck voltage. The Seebeck voltage will oppose the applied voltage and make the device appear to be more resistive than it is. TFAWS – August 15 -19, 2011 81

Review (3/3) • TECs should always be dry when under use to prevent thermal and electrical shorting from condensation – Protection should be provided to TEC to prevent shorting (thermal and electrical) and electrolytic effects. – A perimeter seal around the TEC is usually used. • You cannot cool the liquid by immersing thermoelectric device into the fluid – thermoelectric modules are not the equivalent of “electric ice cubes”. TFAWS – August 15 -19, 2011 82

Preventing Problems • A heat sink is required in any design using TECs. A TEC is vulnerable to overheating - once it reaches the reflow temperature of the solder used, the unit will be destroyed. – Vendors can provide TECs that withstand operating and non-operating temperatures of 85°C and short term exposure temperatures up to 125°C. – Custom TECs can withstand operating and non-operating temperatures of 120°C and short term exposure temperatures up to 170°C. – Do not overheat the TEC, especially when mounting TEC with solder. • Never power up a TEC unless at least one side is mounted to a suitable heat sink. • Use appropriately-rated wire in making connections. • Label electrical connections (+ / -) – For multistage TECs, applying full reversed power could overtemperature cold side (exceed resolder temperature) in under a minute. – Particularly multistage TECs, for initial startup use minimal power to verify the cooler wiring is not reversed. TFAWS – August 15 -19, 2011 83

TEC Modeling - SINDA/FLUINT 5. 3 • Routines are available to size and simulate thermoelectric (Peltier) devices. These include: – TECUNITS. . . a units selection utility for all routines in this section – BISTEL. . . returns temperature-dependent properties for TECs made with bismuth telluride, – a common material for room temperature applications – TECINFO. . returns sizing information given material properties (whether output from – BISTEL or from another source) – TEC 1. . . . simulates a single-stage TEC as modeled by two nodes plus a linear conductor – interconnecting them: a 1 D model – TEC 2. . . . simulates a single-stage TEC as modeled by multiple pairs of node • All of these routines require attention to units, and in particular to the UID selection (ENG or SI) in Global Control Data (Section 4. 3). Temperatures are assumed in user units according to the values of UID and ABSZRO. Default length units are meters if UID=SI, and feet if UID=ENG, but different length scale units can be chosen using the TECUNITS utility. Default thermal power units are Watts if UID=SI, and BTU/hr if UID=SI, and can also be changed using TECUNITS. Electrical power units are always Watts. TFAWS – August 15 -19, 2011 84

TEC Modeling - SINDA/FLUINT 5. 3 • TECUNITS. . . a units selection utility for all routines in this section – CALL TECUNITS(name, units) • Unlike FLUINT, SINDA itself does not enforce a unit convention: any units may be used as long as they are self-consistent (e. g. , the units of linear G times the units of T should be equal to the units of Q). • However, extra calculations are required for TECs that depend on a knowledge of the units. • Therefore, even if no fluid submodels are present, the UID must be set to SI if degrees C or K are used, and it must be set to ENG if degrees F or R are used. (UID is set in CONTROL DATA, GLOBAL. ) UID must be correctly set when using TEC simulation routines. • BISTEL. . . returns temperature-dependent properties for TECs made with bismuth telluride, a common material for room temperature applications – CALL BISTEL (Ncp, Tc, Th, Sm, Rm, Km) • The routine BISTEL may be used to estimate relevant overall thermal and electrical properties for bismuth telluride couples. These properties (Seebeck coefficient, electrical resistivity, and thermal conductivity) are based on second-order polynomial curve fits. * Although the valid range for these properties was not specified in the original source, BISTEL restricts the range of -100°C to 60°C: average temperatures (where Tavg = 0. 5*(Tc+Th)) outside of that range will yield property values at the limits. TFAWS – August 15 -19, 2011 85

TEC Modeling - SINDA/FLUINT 5. 3 • TECINFO. . returns sizing information given material properties (whether output from BISTEL or from another source) – CALL TECINFO (Tc, Th, X, Sm, Rm, Km, Dtmax, Imax, Vmax, Qc. Max, Iopt, Vopt, Qc. Opt, COPopt) • Given the device aspect ratio (X, the ratio of cross sectional area to thickness for one couple) and, perhaps using a prior call to BISTEL, the overall (effective) device properties Seebeck coefficient (Sm), material electric resistivity (Rm), and thermal conductivity (Km), TECINFO produces sizing metrics regarding thermal electric cooler performance at the currently specified hot and cold side temperatures. These metrics may be used to select a specific device, the simulation of which can be later performed using the TEC 1 routine. TFAWS – August 15 -19, 2011 86

TEC Modeling - SINDA/FLUINT 5. 3 • TEC 1. . . . simulates a single-stage TEC (1 D) – CALL TEC 1 (’smn’, Nc, Nh, Ng, Mode, I, V, P, X, Ncp, Sm, Rm, Km) • Once a single stage thermoelectric device has been selected, perhaps using the TECINFO routine, the TEC 1 utility may be used to simulate it in SINDA. One node is used to represent the hot side, and another node is used to represent the cold side. These nodes may be of any type (arithmetic, diffusion, boundary). In addition, a linear conductor between these two nodes is used to represent thermal conduction through the device. * To use TEC 1, build this simple network (two nodes and a linear conductor between them) as part of the SINDA model, then call TEC 1 within VARIABLES 1, as specified below. • TEC 2. . . . simulates a single-stage TEC (2 D) – CALL TEC 2 (’smn’, IDnc, IDnh, IDng, Areas, Mode, I, V, P, X, Ncp, Sm, Rm, Km) • TEC 2 is a two-dimensional version of TEC 1. Refer to the documentation for TEC 1 for additional details. With TEC 1, one node is used to represent the hot side, and another node is used to represent the cold side. With TEC 2, any number of nodes may be used to represent the hot side, and an equal number of corresponding nodes may be used to represent the cold side. Linear conductors between these hot and cold node pairs may be optionally used to represent thermal conduction through the device. Since the TEC has been subdivided, perhaps unevenly, each node pair must be assigned a relative weighting: how much of the total surface area corresponds to each node pair. This weighting is provided by a list of areas corresponding to each node pair. TFAWS – August 15 -19, 2011 87

TEC Modeling - Thermal Desktop • Thermal Desktop provides a Thermo-Electric Cooler routine: – “Thermal > FD/FEM Network > Thermoelectric Cooler” command allows the user to model a thermoelectric cooler (TEC) or other Peltier device. • The TEC command will prompt the user to select the cold and hot sides of the cooler. – Note that a restriction on the TEC option is that the cold side surface and the hot side surface must be identical in subdivision, and must line up from each face. • After selecting the cold and hot sides, a TEC dialog box is displayed. – For detailed information on the TEC subroutine and its input parameters, the user should consult the SINDA/FLUINT manual. – Multi-stage coolers can also be modeled with this functionality by stacking TEC devices. TFAWS – August 15 -19, 2011 88

TEC Modeling - Thermal Desktop • The user should: – Select the “Input Mode” of the cooler (Current, Voltage, Power) and enter values. – Input the Area/Thickness of an individual couple in the device. • This parameter is usually available on technical data sheets provided by the manufacturer. – If modeling a Bismuth Telluride device • select the “Bismuth Telluride” option (if not already selected) and input the number of couples contained in the cooler. – If the couples are made of another material, select “User Defined” and input the device: • Seebeck Coefficients (“Seebeck Coeff” field) • Effective Resistivity (“Eff. Resistivity” field) • Thermal Conductivity (Conductivity field) TFAWS – August 15 -19, 2011 89

TEC Modeling - Thermal Desktop • By default the program will generate conductors representing back conduction through the couples. This can be disabled by deselecting the “Generate Conductors for Couples” check box. – User must account for the filler, i. e. - create either a contactor between the cold and hot side, or fill the gap between the cold and hot sides with a FD Solid Brick. • The TEC dialog box allows the user to add temperature control to either the hot or cold side for transient simulations. – This control simulates on/off thermostatic control by default. – A proportional option is available. – For steady state simulations, the user can elect to apply a constant input or midpoint control. TFAWS – August 15 -19, 2011 90

Other space TEC insights • In terrestrial applications, additional TEC power and a bigger sink are usually the easiest approach to higher loads • In space, TEC power and rejection resources can be constrained • TEC heat can raise the local reject temperature – This in turn causes the TEC to work harder which creates more heat…. . this just digs a deeper hole to climb out – It important to understand the spacecraft reject constraints • These constraint motivate TEC selection to be optimized for COP – The literature indicates that a single stage TEC can create a 60 C gradient A single stage could be a fine solution for an terrestrial application , but there’s wiser choices for space TFAWS – August 15 -19, 2011 91

Multi stage cooler optimization • When selecting a cooler based for a specific space application, consider funding a study to select an optimum (usually custom) design. Such an optimization will consider – the number of stages, – number of PN junctions in each stage – the elements profile height vs. cross-section (to affect self parasitic) • Optimizations can address the size and spacing of elements to increase the structural sheer strength/ launch viability • The wedding cake is generally weakest at it’s top layer TFAWS – August 15 -19, 2011 93

Stress Relief • Space designs are – subject to launch vibrations and differential expansion also causes stress – generally incorporate a mechanically compliant element to mitigate these stresses – any compliant element will create an additional gradient • Compliant thermal straps – Multi-layer foils with bend(s) can provide compliance in 2 axes (and some compliance in the third axis – Braids can provide 3 axis compliance • Generally, compliant elements are on the cold side. – Particularly in multi-stage TECs the cold side is weaker – The cold side moves less heat and so this will cause lower gradients – Generally the reject side is beefier to promote heat rejection TFAWS – August 15 -19, 2011 94

Thermal Design to Maintain the Heat Sink • The heat sink is the heat rejection sink for the TEC, but thermal control of the heat sink is critical to prevent thermal runaway. • All heat loads into the sink must be considered in thermal design of that part of the package. • The heat sink can be controlled by: – a passive radiator, augmented by a heater, with a conductive path to the TEC hot side. – a two-phase system, i. e. - LHP evaporator, with its own control system. • This is the more “typical” type of thermal design we do, but is critical to the performance of a thermoelectric design. TFAWS – August 15 -19, 2011 95

You Learn By Practicing • Buy some cheap TECs and experiment with them (non-flight, of course). • DC batteries are cheap. TFAWS – August 15 -19, 2011 96

SPACE APPLICATIONS (W/REAL WORLD EXAMPLES) Satcom CLNA (SC Thermal Control Handbook, AIAA) WFC-3 (H. Peabody, NASA GSFC) TFAWS – August 15 -19, 2011 97

Thermoelectrics in Space Applications • Advantages – Simplicity, reliability, compactness, low mass, noiseless, vibrationless operation – No moving parts • Disadvantages – Low efficiency, particularly with large temperature differences • Best suited to situation with modest heat loads, cold temperatures not below 150 K, hot-to-cold side difference not exceeding 100 K. • A major TEC issue is the structural integrity of bismuth telluride and soldered joints when subjected differential expansion stresses. • Another potential issue is redundancy, which can lead to increased complexity, larger heat loads, and greater radiator area. • Space applications – Infrared sensors, blackbody references, charge coupled devices, high power integrated circuits, quartz crystal microbalances TFAWS – August 15 -19, 2011 98

Space Based Applications Source: D. Gilmore, (Editor), Spacecraft Thermal Control Handbook – Vol 1. Fundamental Technologies, 2 nd edition, 2002. TFAWS – August 15 -19, 2011 99

RCA SATCOM “Spacecraft Thermal Control Handbook – Vol I”, D. Gilmore, Aerospace Corp. TFAWS – August 15 -19, 2011 100

RCA Satcom † - Problem Overview • Uplink signals reaching geosynchronous satellites are weak because of the long transmission distance and the fading that results from atmospheric effects. Receiver signal quality can be improved by operating the initial amplifier stages at cold temperatures where the largest source of noise, "thermal noise, " is suppressed. • RCA Satcom Ku-band spacecraft, launched into geosynchronous orbit in 1986 , used a cooled low noise amplifier (CLNA) operating at-50°C for improved uplink receiver performance. • • The primary parasitic heat flow path into the LNA is radiation from the SC and conduction down the leads and waveguides. The TEC needs to “pump” the amplifier dissipation and any parasitic heat to the radiator. Isolating from warm SC interior is key to minimizing radiative and conductive parasitic loads, which can easily overwhelm a TEC. Due to the large temperature differential between the TEC and the radiator, a mechanically compliant interface is needed to minimize stresses from CTE effects. A TEC controller (TECC) is used to monitor the amplifier's temperature and modulates cooling power, to maintain the amplifier temperature, +/-1°C. † Spacecraft Thermal Control Handbook – Vol I”, TFAWS D. Gilmore, Aerospace Corp – August 15 -19, 2011 Warm SC Interior Waveguide LNA Honeycomb radiator 101

RCA Satcom † - Design Considerations • Heat Loads: As discussed today, the first step when using a TEC is to understand the heat loads, both active and passive. • Active: Initial analysis predicted 525 m. W from the CLNA. – Since small errors in estimating this load would result in significant errors in the cooler waste heat and necessary radiator size, a series of calorimetric tests was conducted with a thermally representative CLNA assembly and a calibrated TEC rejecting heat to a temperaturecontrolled heat exchanger. – Sensitivity of the amplifier heat load to hot-side temperature is shown. – These tests established the cooling requirement to maintain the LNA at 50°C for a range of baseplate temperatures (27, 15, and 0°C). † Spacecraft Thermal Control Handbook – Vol I”, TFAWS D. Gilmore, Aerospace Corp – August 15 -19, 2011 102

RCA Satcom † - Design Considerations • Passive: the largest initial passive heat load was conduction through the waveguide. – Since conventional satellite waveguides are fabricated of 30 -mil (or thicker) aluminum, a low conductivity waveguide needed to be developed. • Highly insulating polymer waveguide with a vapor-deposited thin metal coating on the interior and flange surfaces that renders the waveguide electrically conductive without substantially affecting its thermal isolation. – To minimize radiative heat absorbed by the amplifier, the LNA would be enclosed in a thermal shield and low emittance surfaces used throughout. – The amplifier's 32 -gauge electrical leads were chosen to minimize heat leak down the lead without compromising structural integrity. • A thermal strap was used to provide mechanically compliant heat transport between the TEC and LNA with a modest temperature gradient. – Stacked layers of metal curved to provide virtually no resistance to small displacements in two planes • Constructed of silver rather than copper. Silver is lighter and imparts lower loads to the TEC during vibration. • The strap was permanently bonded to the TEC with a conductively loaded adhesive, to reduce the TEC-to-strap to reduce the TEC-strap gradient † Spacecraft Thermal Control Handbook – Vol I”, TFAWS D. Gilmore, Aerospace Corp – August 15 -19, 2011 103

RCA Satcom† - Select Rejection Temperature • Rejection temperature was the final parameter needed to design and build an optimized cooler. This temperature affects both the specification (and therefore the optimization) of the TEC and the local radiator sizing. • Selecting an excessively cold rejection temperature would result in a large and heavy radiator, while an excessively warm rejection temperature would cause the TEC to consume excessive power, resulting in inappropriate use of radiator area. • The selection needed to be a compromise between radiator area (a warmer rejection temperature would be needed for a smaller area) and power consumption (a colder temperature would be needed for lower power). Optimal rejection temperature would balance TEC power consumption against radiator area. • The local radiator operating temperature was selected as 15°C maximum, as a compromise between low input power and radiator area. † Spacecraft Thermal Control Handbook – Vol I”, TFAWS D. Gilmore, Aerospace Corp – August 15 -19, 2011 104

RCA Satcom † - TEC Design Implementation • The TEC vendor was given the following parameters: 790 m. W cooling requirement, - 52°C cold-side temperature (allowing for a 2°C gradient in the strap), and + 15°C hot-side (rejection) temperature. The vendor's optimization indicated that a four-stage cooler would consume 8 W of power. • The final design step was to size the CLNA radiator, using the 8 W input power plus the 0. 79 W heat pumped, and an assumed 0. 80 fin effectiveness. • Radiated heat from internal and external sources was covered by virtue of using the equivalent sinks. • The required radiator area was 0. 106 m 2. † Spacecraft Thermal Control Handbook – Vol I”, TFAWS D. Gilmore, Aerospace Corp – August 15 -19, 2011 106

RCA Satcom † - Test Results and Flight Data • A test of the final CLNA configuration was performed with an engineering model CLNA bolted to an equivalent aluminum plate representing the radiator panel. – Demonstrated adequate cooling and radiator-area margin. The CLNA operation was as expected during spacecraft thermalbalance testing, which simulated the worst hot expected flight environment. • Initial flight data also indicated that the CLNA was properly maintaining the LNA at-50°C. † Spacecraft Thermal Control Handbook – Vol I”, TFAWS D. Gilmore, Aerospace Corp – August 15 -19, 2011 107

WFC-3 Hume Peabody NASA GSFC TFAWS – August 15 -19, 2011 108

Wide Field Camera 3 Overview TFAWS – August 15 -19, 2011 109

HST’s Wide Field Camera 3 Detector Cooling Main Radiator TECFIRE • IR Detector • 6 Stage TEC, Focal Plane -128°C • TEC Heat removed by flexible heat pipe • Condenser connected to TECFIRE • IR Cold Enclosure Flexible Heat Pipes UVIS Detector • UVIS • Surrounds IR detector assembly • Cold Enclosure heat removed by flexible heat pipe • Condenser connected to TECFIRE • TECFIRE (TEC For IR Elex) IR Detector (Internal) • 4 Stage TEC, CCD -83°C goal Enclosure • (4) 2 -stage, constant current TECs IR(External) used to cool inner shield • All TEC Heat into flexible GCHP Evaporator • Condenser connected to Main Radiator TFAWS – August 15 -19, 2011 • Assemblies of (6) 1 -stage TECs in parallel (2 x 3 array) • 2 units for Detector Baseplate (DB) • 1 unit for Cold Enclosure (CE) • TEC heat deposited on Main Radiator 110

WFC-3 TCS Block Diagram RADIATOR 6 x 1 GCHP Flex HP Baseplate 2 2 4 Flex HP UVIS Detector (-83°C) Baseplate 4 IR Detector (-128°C) Shield CE=Cold Enclosure UVIS TECFIRE TFAWS – August 15 -19, 2011 111

Some Issues with Model Correlation • The original model only estimated a steady state TECFIRE power based on the hot side temperature, control setpoint, input heat load, and characteristic TEC performance curves. This was done in an external model and the results imported simply as a constant power for flight predictions. This completely neglected the dynamically changing flight environment and the radiator responding both to environmental loading changes and TECFIRE power to maintain control. • TEC performance changes for correlation: – UVIS 4 -stage TEC: improvement of about 5% was needed – IR 6 -stage: improvement of about 8% was needed. – TECFIRE: degraded by 5% (to 95% of nominal) – Further subsystem testing for the requalification of the unit to lower operating temperatures showed that the actual voltage needed by the TEC was higher than the vendor supplied data and confirmed the necessary degradation. TFAWS – August 15 -19, 2011 112

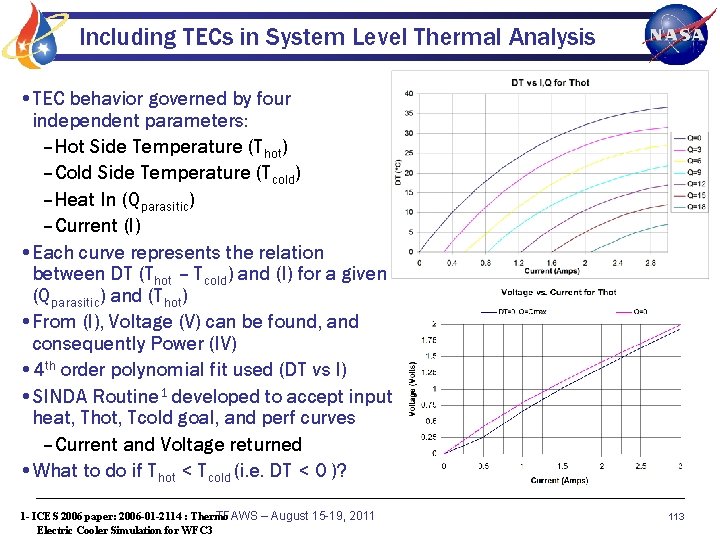
Including TECs in System Level Thermal Analysis • TEC behavior governed by four independent parameters: – Hot Side Temperature (Thot) – Cold Side Temperature (Tcold) – Heat In (Qparasitic) – Current (I) • Each curve represents the relation between DT (Thot – Tcold) and (I) for a given (Qparasitic) and (Thot) • From (I), Voltage (V) can be found, and consequently Power (IV) • 4 th order polynomial fit used (DT vs I) • SINDA Routine 1 developed to accept input heat, Thot, Tcold goal, and perf curves – Current and Voltage returned • What to do if Thot < Tcold (i. e. DT < 0 )? 1 - ICES 2006 paper: 2006 -01 -2114 : Thermo TFAWS – August 15 -19, 2011 Electric Cooler Simulation for WFC 3 113

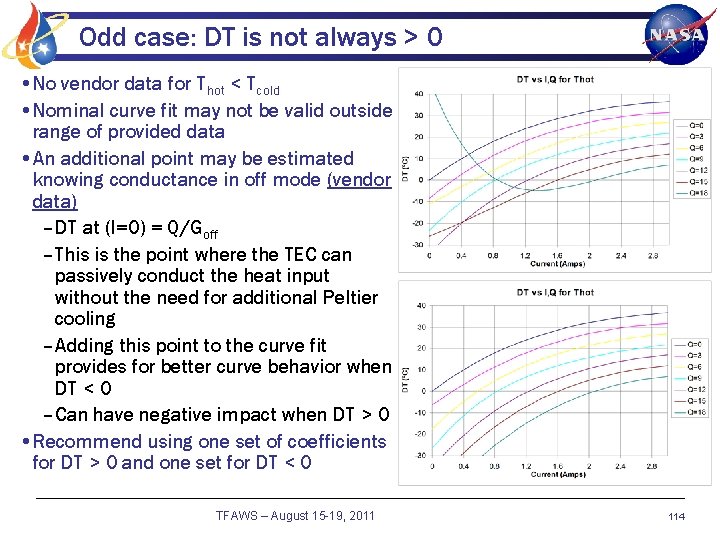
Odd case: DT is not always > 0 • No vendor data for Thot < Tcold • Nominal curve fit may not be valid outside range of provided data • An additional point may be estimated knowing conductance in off mode (vendor data) – DT at (I=0) = Q/Goff – This is the point where the TEC can passively conduct the heat input without the need for additional Peltier cooling – Adding this point to the curve fit provides for better curve behavior when DT < 0 – Can have negative impact when DT > 0 • Recommend using one set of coefficients for DT > 0 and one set for DT < 0 TFAWS – August 15 -19, 2011 114

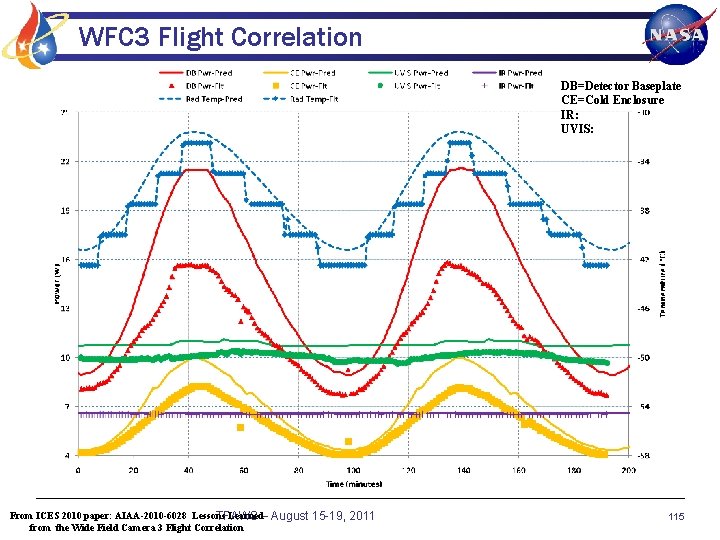
WFC 3 Flight Correlation DB=Detector Baseplate CE=Cold Enclosure IR: UVIS: From ICES 2010 paper: AIAA-2010 -6028 Lessons Learned– TFAWS from the Wide Field Camera 3 Flight Correlation August 15 -19, 2011 115

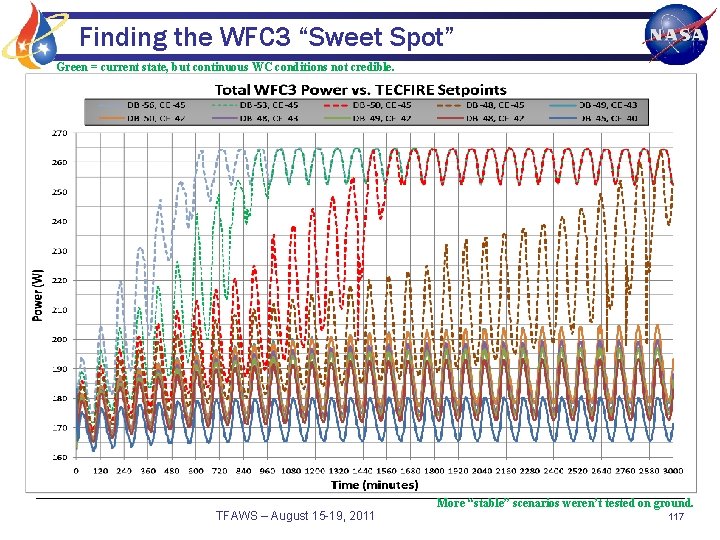
Future WFC 3 Predictions • An important lesson learned through the development and testing of WFC 3 was that it is crucial to understand the impact of a varying hot side sink on the TEC power demands or risk TEC run-away • For WFC 3, the lingering question from the scientists has always been “Can we maintain the IR detector at -128°C for all orbital conditions? ” • The concern has been if TECFIRE can provide the stable -53°C sink necessary • If the Radiator Sink increases, then the DT demand also increases. This increases the TEC power, which increases the radiator temperature, which increases the demand…until it runs away to a maximum current • Ironically, placing a higher demand on the upstream 6 stage TEC (by raising the TECFIRE control point) results in a cooler radiator than further reducing the TECFIRE control point – This can be thought of as whispering into a microphone with the amplifier turned up vs. yelling into a microphone with the amplifier turned down. . . • Nominal setpoints predict run-away under stacked worst case thermal conditions – Number of setpoint cases run to see if non-run-away case existed – However, many of these represent an untested condition, and likelihood of SC remaining in worst case environments not credible. TFAWS – August 15 -19, 2011 116

Finding the WFC 3 “Sweet Spot” Green = current state, but continuous WC conditions not credible. TFAWS – August 15 -19, 2011 More “stable” scenarios weren’t tested on ground. 117
![Sources References Marlow Industries www marlow com Laird Technologies nee Sources / References • • • Marlow Industries [www. marlow. com] Laird Technologies (nee:](https://slidetodoc.com/presentation_image_h/a28d4e6fcb388286b3a2f9fc1bc62daf/image-116.jpg)
Sources / References • • • Marlow Industries [www. marlow. com] Laird Technologies (nee: Melcor) [www. lairdtech. com Tellurex [www. tellurex. com] Cullimore & Ring [www. crtech. com] CRC Handbook of Thermoelectrics (1995) “Spacecraft Thermal Control Handbook – Vol 1. Fundamental Technologies”, 2 nd edition, 2002, D. Gilmore, (Editor) “Thermoelectric Converter for Loop Heat Pipe Temperature Control: Experience and Lessons Learned”, J. Ku, L. Ottenstein, “Using Thermoelectric Converters for Loop Heat Pipe Operating Temperature Control”, AIAA 2006 -4057, J. Ku, H. Nagano, 4 th IECEC “Loop Heat Pipe Operation with Thermoelectric Converters and Coupling Blocks”, AIAA 2007 -4713, J. Ku, H. Nagano, 5 th IECEC “ Lessons Learned from the Wide Field Camera 3 Flight Correlation”, AIAA-2010 -6028, H. Peabody, R. Stavely, W. Bast “Thermo Electric Cooler Simulation for WFC 3”, SAE-2006 -01 -2114, H. Peabody, D. Maidt, R. Stavely TFAWS – August 15 -19, 2011 118
 Tall + short h
 Nasa tfaws
 Https //nssdc.gsfc.nasa
 Gsfc.nasa.gov
 Hindawi
 Liz hays
 Nasa gsfc
 Nasa
Nasa Http //nssdc.gsfc.nasa
 Charcoal coolers in kenya
 Replexen
 Guided by
 Dangling bond in fullerene
 Thermoelectric
 Thermoelectric cloud chamber
 Melcor tec
 Nasa safety and mission assurance
 Goddard contractors association
 Panitikan kahulugan
 Calipso browse images
 One and a half brick wall
 Course title and course number
 Chaine parallèle muscle
 Thrombus fate
 Great saphenous vein course
 Understand quran course 2 pdf
 News headlines banner
 Presentation by name
 Jekyll and hyde setting
 The theme love in romeo and juliet
 Dentify a key term used in both passages.
 Name of presenter
 How is power presented in ozymandias and london
 Bruner theory of cognitive development
 How is mr hyde presented as a frightening outsider
 Talisman presented
 Topic, main idea supporting details
 Kamikaze poem analysis
 Technological design definition
 Bob cratchit quotes
 Procedure text structure
 What type of conics is presented in a tilted glass of water
 My last duchess and ozymandias
 Prism is presented with
 Cause effect text structure
 Technical drawing means
 Generic structure of spoof text
 Proudly presented by
 Summary of act 5 macbeth
 Lady macbeth soliloquy act 1 scene 5
 Depletion journal entry
 Presented below
 Type of polygon
 Nnn1996
 Young and dyslexic annotations
 Presented sy
 The kitchen presented by
 Professionally presented
 Caltech bursar
 Madtshirt music
 How it's made presented by
 Natural asset companies
 Ano ang maikling kwento
 Heterozygous short-hair x heterozygous short-hair
 Kva kva kvačica
 Nasa center for climate simulation
 Ang mga elemento ng tula
 Soleil
 Wonder taste
 Nasa design squad challenge touchdown
 Http://solarsystem.nasa.gov/planets/
 Service desk single point of contact
 Ndia systems engineering conference
 What are the benefits of space exploration
 Nasa std 6001
 Nasa conference tracking system
 Project risk categories
 Republika hrvatska 4 razred
 Working with models
 Http://pds.jpl.nasa.gov/planets/
 Kevin murphy nasa
 Nasa nomad large file transfer
 Nasa elmt
 Nasa shared service center
 Nasa guest account
 Nasa safety center
 Nasa nesc academy
 Cea nasa
 Mario perez nasa
 Modis hq
 Nasa firms
 Halimbawa ng bugtong
 Dotazník naša trieda
 Ang ibong adarna ay may paksang
 Bell pepee
 Nasa-std-5020
 Nasa-std-5009
 Nasa worldview earthdata
 Earthobservatory.nasa.gov/features/world of change
 Star grounding
 Mga nilalaman ng pahayagan
 Nasa stands for
 Http://solarsystem.nasa.gov
 Andriy koval
 Nasa big data
 Tekst pjesme još hrvatska ni propala
 Http://solarsystem.nasa.gov/planets/
 Dissimilar fraction example
 Anyong tubig na karaniwang nasa bukana ng dagat
 Maikling kwento example
 Nasa turbofan
 Cientistas da nasa recalculam idade da estrela
 Soho esa
 High level of pollution
 12.02.2008 nasa
 Http://solarsystem.nasa.gov/planets
 Do gui aos ambientes imersivos

