1 TEAM PARADIGM 6 CONCEPTUAL DESIGN REVIEW Farah

- Slides: 73
1 TEAM PARADIGM 6 CONCEPTUAL DESIGN REVIEW Farah Abdullah Stephen Adams Noor Emir Anuar Paul Davis Zherui Guo Steve Mc. Cabe Zack Means Mizuki Wada Askar Yessirkepov
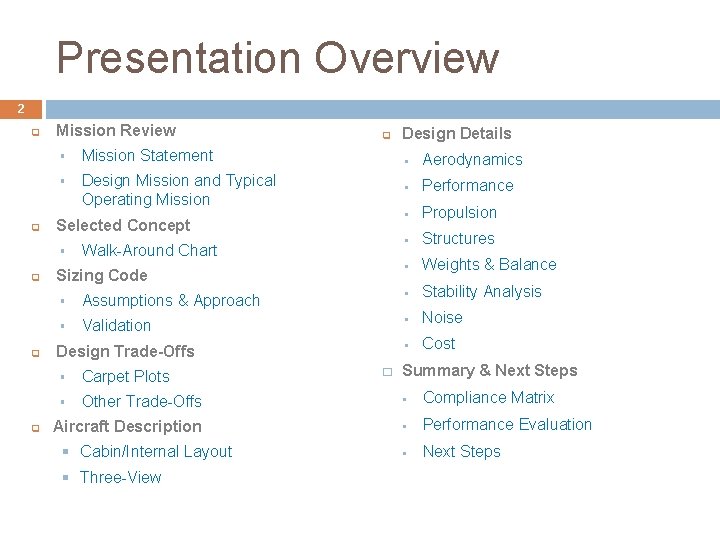
Presentation Overview 2 q q Mission Review § Mission Statement § Design Mission and Typical Operating Mission Selected Concept § q q Walk-Around Chart Sizing Code Design Details § Aerodynamics § Performance § Propulsion § Structures § Weights & Balance § Assumptions & Approach § Stability Analysis § Validation § Noise § Cost Design Trade-Offs � Summary & Next Steps § Carpet Plots § Other Trade-Offs § Compliance Matrix Aircraft Description § Performance Evaluation § Next Steps § Cabin/Internal Layout § Three-View
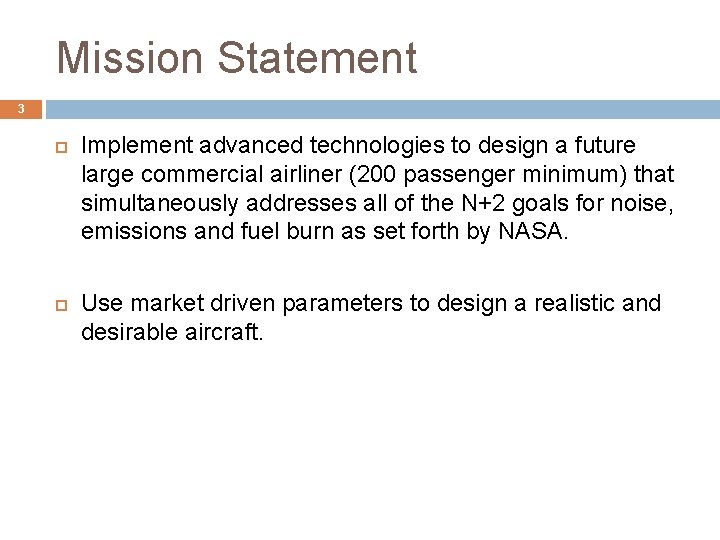
Mission Statement 3 Implement advanced technologies to design a future large commercial airliner (200 passenger minimum) that simultaneously addresses all of the N+2 goals for noise, emissions and fuel burn as set forth by NASA. Use market driven parameters to design a realistic and desirable aircraft.
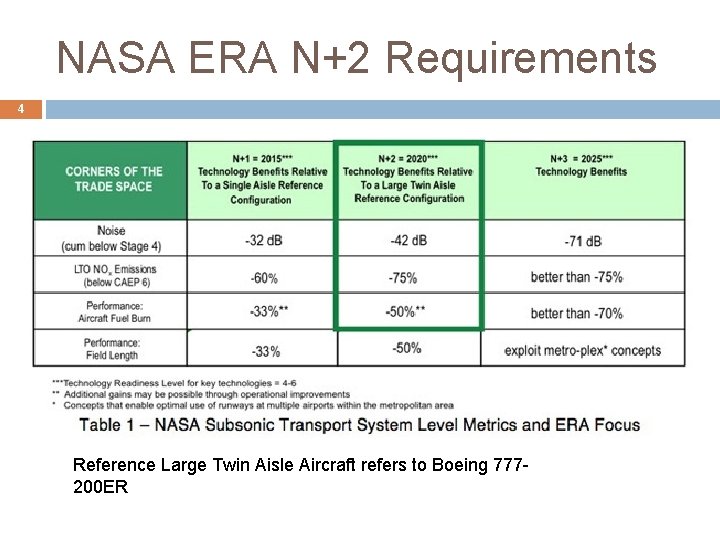
NASA ERA N+2 Requirements 4 Reference Large Twin Aisle Aircraft refers to Boeing 777200 ER
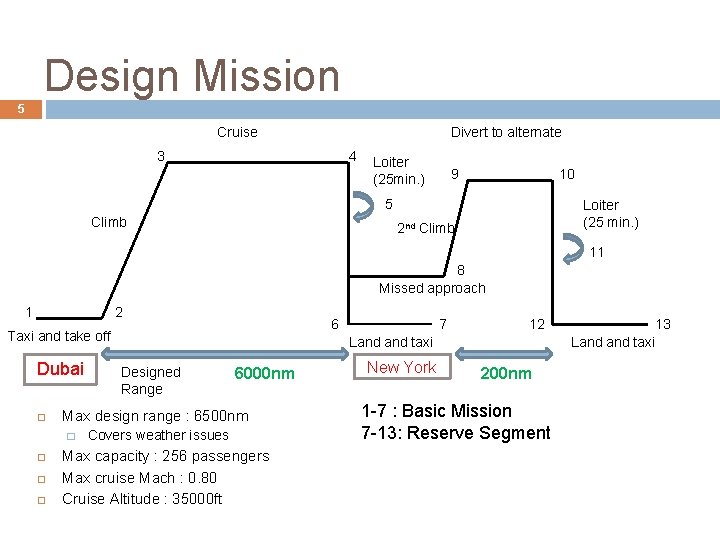
Design Mission 5 Cruise Divert to alternate 4 3 Loiter (25 min. ) 10 9 5 Climb Loiter (25 min. ) 2 nd Climb 11 8 Missed approach 1 2 6 Taxi and take off Dubai 12 Land taxi Designed Range 6000 nm Max design range : 6500 nm � 7 Covers weather issues Max capacity : 256 passengers Max cruise Mach : 0. 80 Cruise Altitude : 35000 ft New York 200 nm 1 -7 : Basic Mission 7 -13: Reserve Segment 13 Land taxi
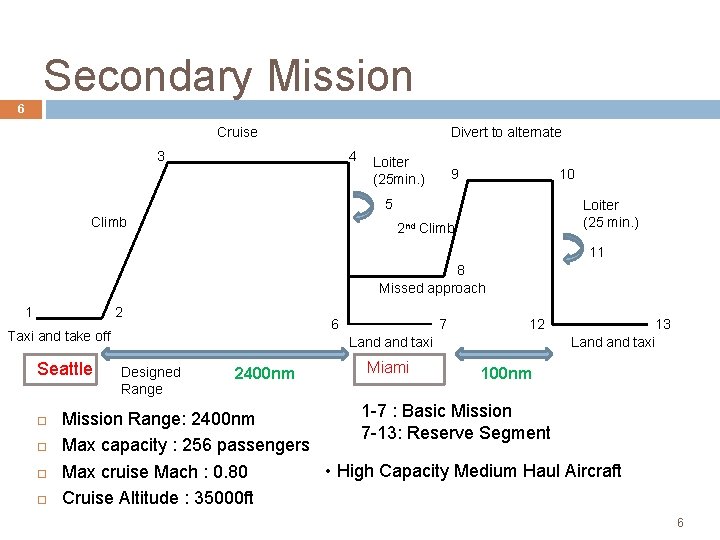
Secondary Mission 6 Cruise Divert to alternate 4 3 Loiter (25 min. ) 10 9 5 Climb Loiter (25 min. ) 2 nd Climb 11 8 Missed approach 1 2 6 Taxi and take off Seattle 7 12 Land taxi Designed Range 2400 nm Miami 13 Land taxi 100 nm 1 -7 : Basic Mission Range: 2400 nm 7 -13: Reserve Segment Max capacity : 256 passengers • High Capacity Medium Haul Aircraft Max cruise Mach : 0. 80 Cruise Altitude : 35000 ft 6
Selected Concept
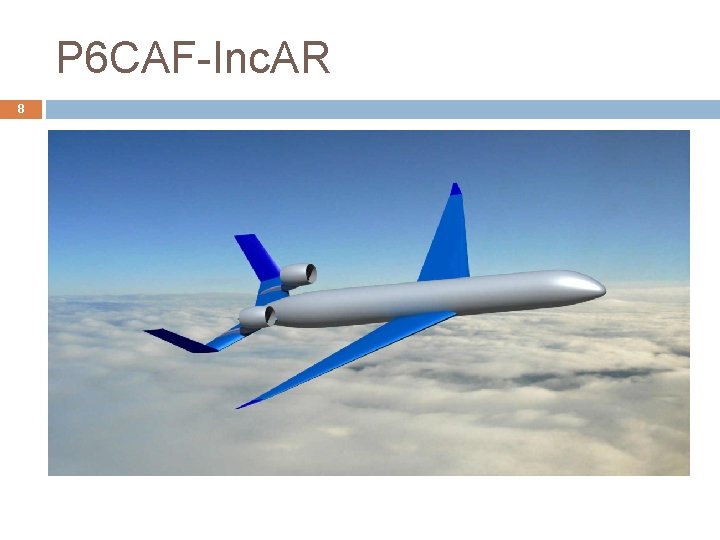
P 6 CAF-Inc. AR 8
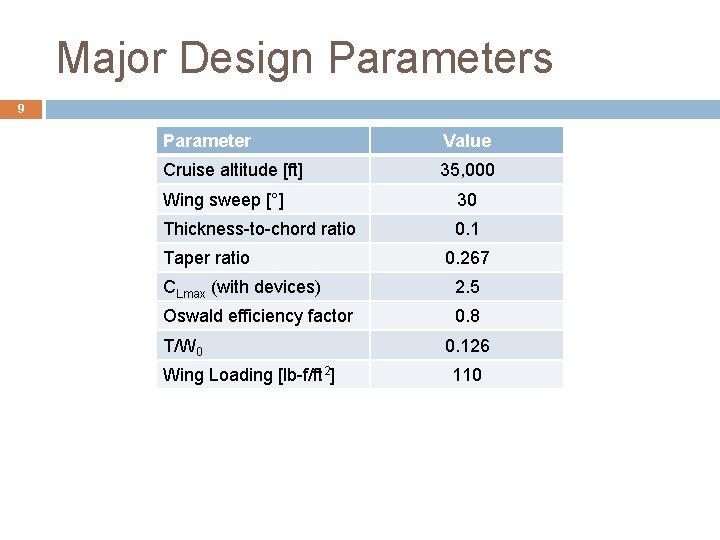
Major Design Parameters 9 Parameter Value Cruise altitude [ft] 35, 000 Wing sweep [°] 30 Thickness-to-chord ratio 0. 1 Taper ratio 0. 267 CLmax (with devices) 2. 5 Oswald efficiency factor 0. 8 T/W 0 Wing Loading [lb-f/ft 2] 0. 126 110
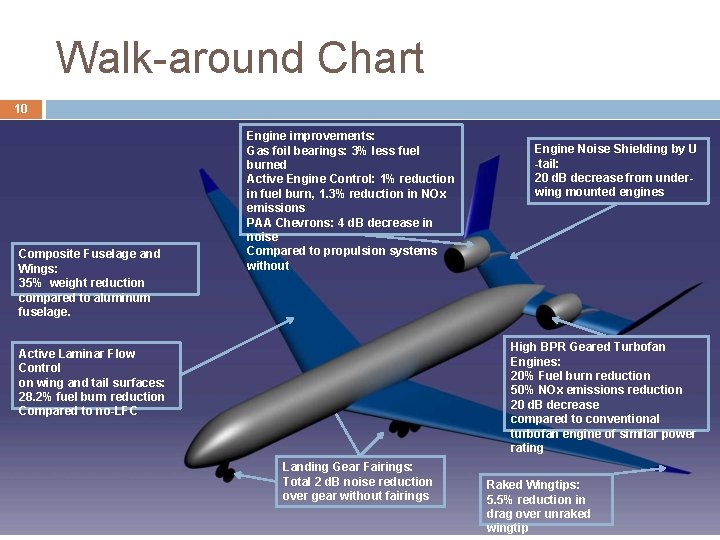
Walk-around Chart 10 Composite Fuselage and Wings: 35% weight reduction compared to aluminum fuselage. Engine improvements: Gas foil bearings: 3% less fuel burned Active Engine Control: 1% reduction in fuel burn, 1. 3% reduction in NOx emissions PAA Chevrons: 4 d. B decrease in noise Compared to propulsion systems without Engine Noise Shielding by U -tail: 20 d. B decrease from underwing mounted engines High BPR Geared Turbofan Engines: 20% Fuel burn reduction 50% NOx emissions reduction 20 d. B decrease compared to conventional turbofan engine of similar power rating Active Laminar Flow Control on wing and tail surfaces: 28. 2% fuel burn reduction Compared to no-LFC Landing Gear Fairings: Total 2 d. B noise reduction over gear without fairings Raked Wingtips: 5. 5% reduction in drag over unraked wingtip
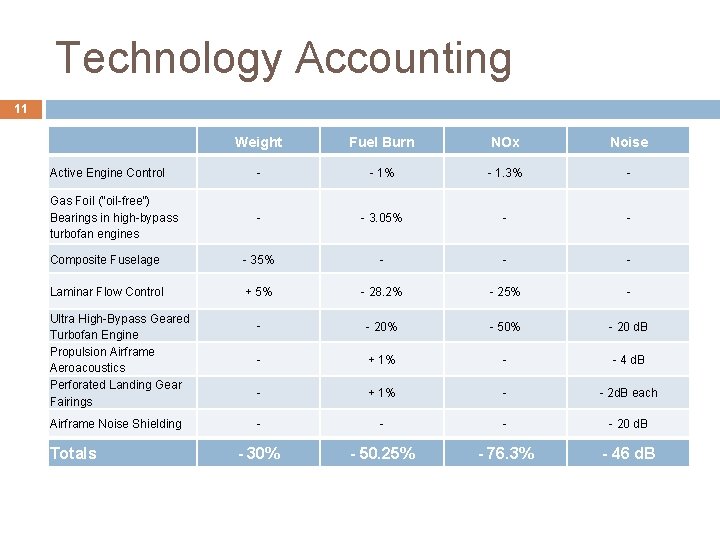
Technology Accounting 11 Weight Fuel Burn NOx Noise Active Engine Control - - 1% - 1. 3% - Gas Foil (“oil-free”) Bearings in high-bypass turbofan engines - - 3. 05% - - Composite Fuselage - 35% - - - Laminar Flow Control + 5% - 28. 2% - 25% - - - 20% - 50% - 20 d. B - + 1% - - 4 d. B - + 1% - - 2 d. B each - - 20 d. B - 30% - 50. 25% - 76. 3% - 46 d. B Ultra High-Bypass Geared Turbofan Engine Propulsion Airframe Aeroacoustics Perforated Landing Gear Fairings Airframe Noise Shielding Totals
Sizing Code overview • Assumptions & approach • Validation •
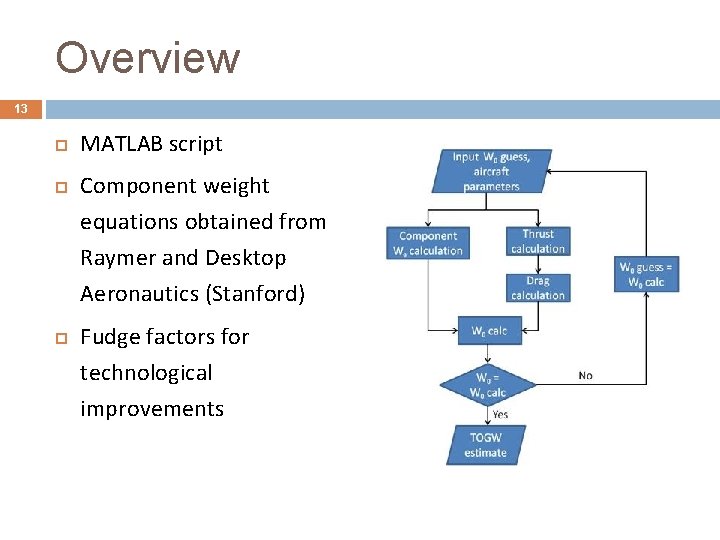
Overview 13 MATLAB script Component weight equations obtained from Raymer and Desktop Aeronautics (Stanford) Fudge factors for technological improvements
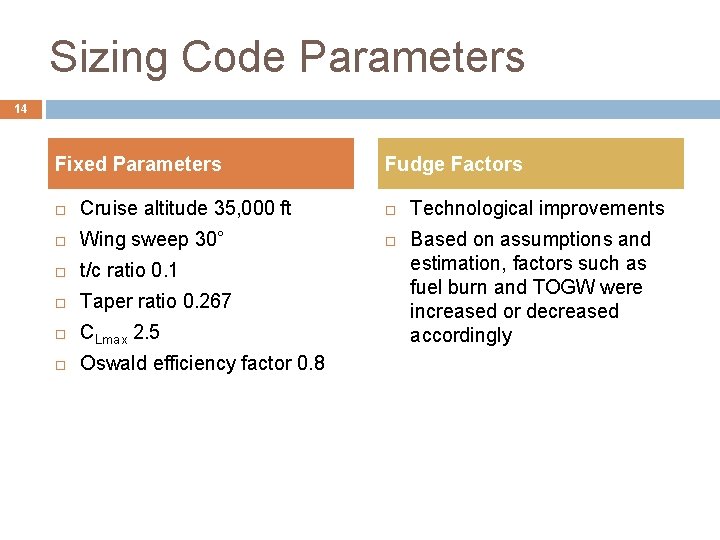
Sizing Code Parameters 14 Fixed Parameters Fudge Factors Cruise altitude 35, 000 ft Wing sweep 30° t/c ratio 0. 1 Taper ratio 0. 267 CLmax 2. 5 Oswald efficiency factor 0. 8 Technological improvements Based on assumptions and estimation, factors such as fuel burn and TOGW were increased or decreased accordingly
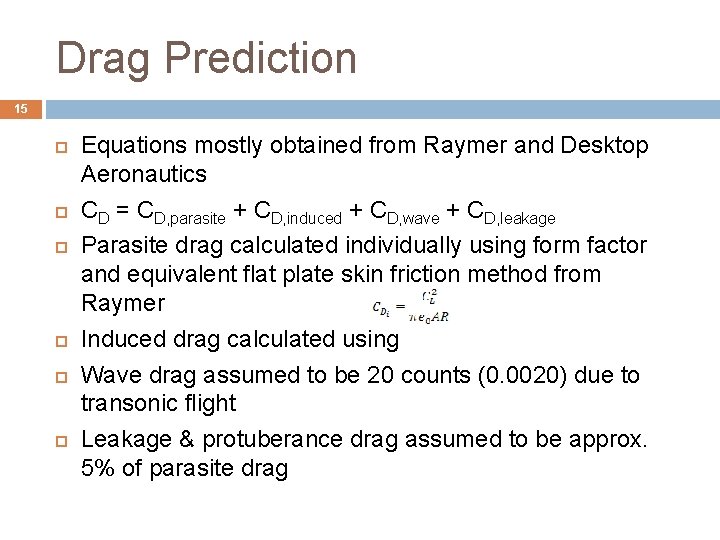
Drag Prediction 15 Equations mostly obtained from Raymer and Desktop Aeronautics CD = CD, parasite + CD, induced + CD, wave + CD, leakage Parasite drag calculated individually using form factor and equivalent flat plate skin friction method from Raymer Induced drag calculated using Wave drag assumed to be 20 counts (0. 0020) due to transonic flight Leakage & protuberance drag assumed to be approx. 5% of parasite drag
Engine Sizing 16 Using equations from Raymer Scaled from existing engine tabular data as well as NASA twin-spool turbofan engine Currently assumed to have same NOx Emission Index as GE 90 -94 B engine used in 777 -200 ER
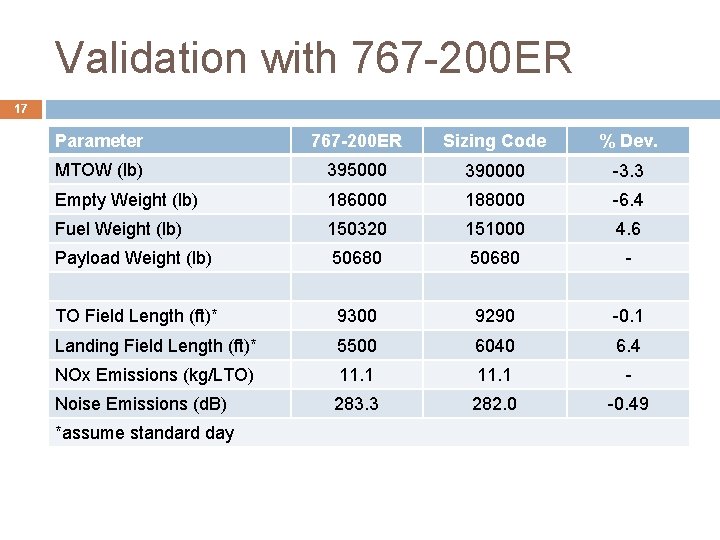
Validation with 767 -200 ER 17 Parameter 767 -200 ER Sizing Code % Dev. MTOW (lb) 395000 390000 -3. 3 Empty Weight (lb) 186000 188000 -6. 4 Fuel Weight (lb) 150320 151000 4. 6 Payload Weight (lb) 50680 - TO Field Length (ft)* 9300 9290 -0. 1 Landing Field Length (ft)* 5500 6040 6. 4 NOx Emissions (kg/LTO) 11. 1 - Noise Emissions (d. B) 283. 3 282. 0 -0. 49 *assume standard day
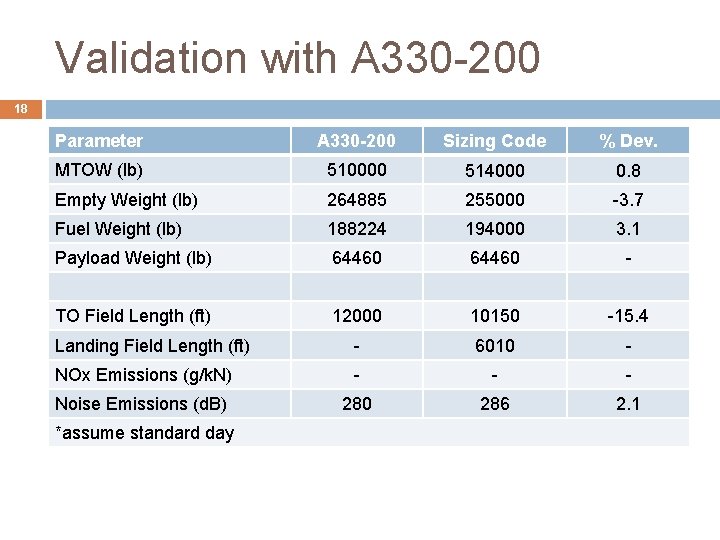
Validation with A 330 -200 18 Parameter A 330 -200 Sizing Code % Dev. MTOW (lb) 510000 514000 0. 8 Empty Weight (lb) 264885 255000 -3. 7 Fuel Weight (lb) 188224 194000 3. 1 Payload Weight (lb) 64460 - TO Field Length (ft) 12000 10150 -15. 4 Landing Field Length (ft) - 6010 - NOx Emissions (g/k. N) - - - Noise Emissions (d. B) 280 286 2. 1 *assume standard day
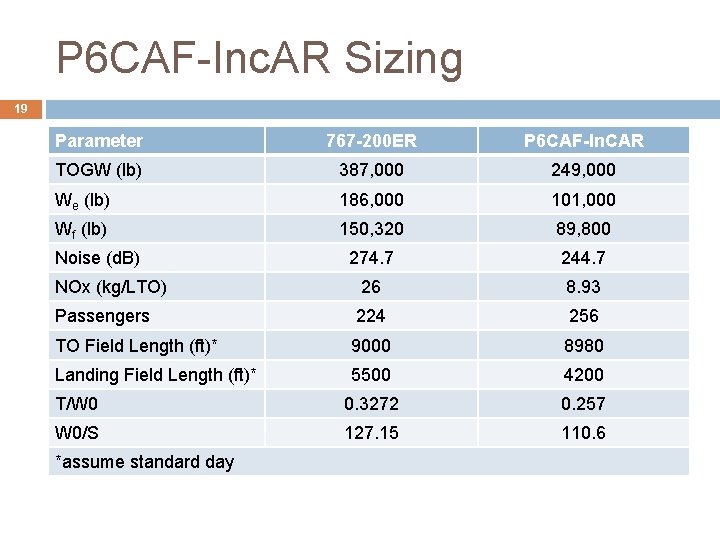
P 6 CAF-Inc. AR Sizing 19 Parameter 767 -200 ER P 6 CAF-In. CAR TOGW (lb) 387, 000 249, 000 We (lb) 186, 000 101, 000 Wf (lb) 150, 320 89, 800 274. 7 244. 7 NOx (kg/LTO) 26 8. 93 Passengers 224 256 TO Field Length (ft)* 9000 8980 Landing Field Length (ft)* 5500 4200 T/W 0 0. 3272 0. 257 W 0/S 127. 15 110. 6 Noise (d. B) *assume standard day
Design Trade-Offs Performance Constraints • W 0/S, T/W 0 estimates • Trade Studies • Compliance Matrix •
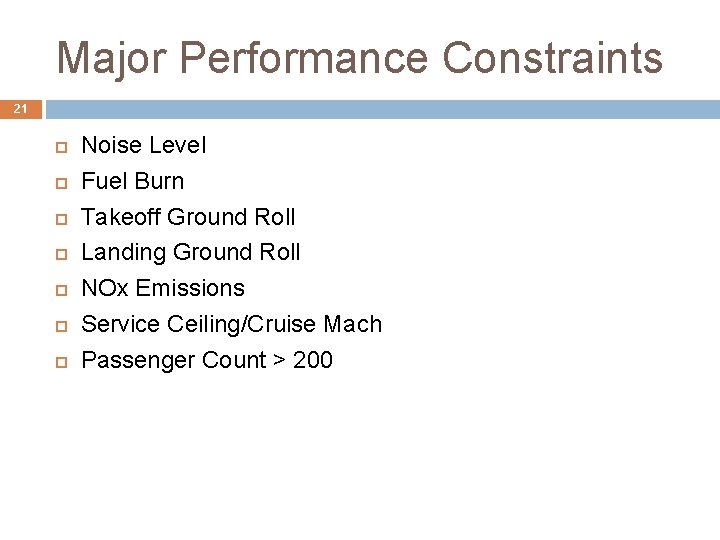
Major Performance Constraints 21 Noise Level Fuel Burn Takeoff Ground Roll Landing Ground Roll NOx Emissions Service Ceiling/Cruise Mach Passenger Count > 200
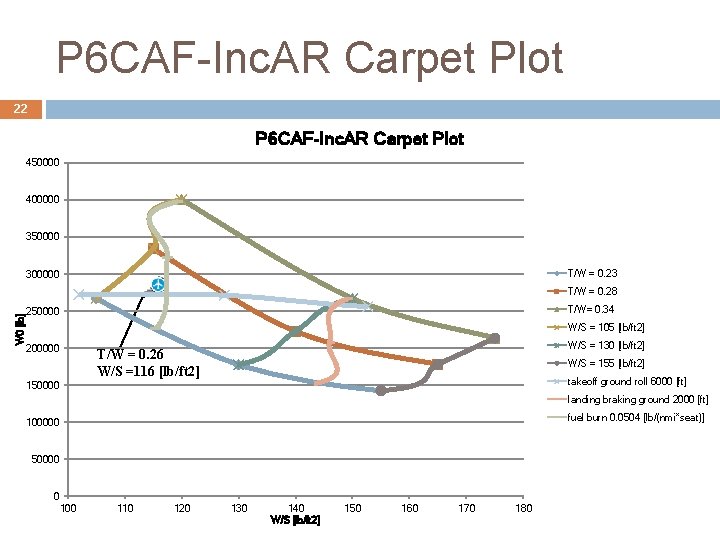
P 6 CAF-Inc. AR Carpet Plot 22 P 6 CAF-Inc. AR Carpet Plot 450000 400000 350000 T/W = 0. 23 300000 W 0 [lb] T/W = 0. 28 T/W= 0. 34 250000 W/S = 105 [lb/ft 2] 200000 W/S = 130 [lb/ft 2] T/W = 0. 26 W/S =116 [lb/ft 2] W/S = 155 [lb/ft 2] takeoff ground roll 6000 [ft] 150000 landing braking ground 2000 [ft] fuel burn 0. 0504 [lb/(nmi*seat)] 100000 50000 0 100 110 120 130 140 W/S [lb/ft 2] 150 160 170 180
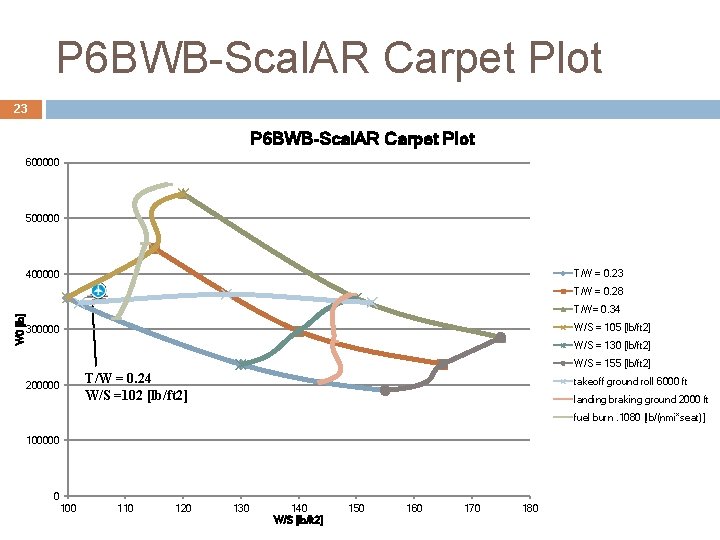
P 6 BWB-Scal. AR Carpet Plot 23 P 6 BWB-Scal. AR Carpet Plot 600000 500000 T/W = 0. 23 400000 W 0 [lb] T/W = 0. 28 T/W= 0. 34 W/S = 105 [lb/ft 2] 300000 W/S = 130 [lb/ft 2] W/S = 155 [lb/ft 2] T/W = 0. 24 W/S =102 [lb/ft 2] 200000 takeoff ground roll 6000 ft landing braking ground 2000 ft fuel burn. 1080 [lb/(nmi*seat)] 100000 0 100 110 120 130 140 W/S [lb/ft 2] 150 160 170 180
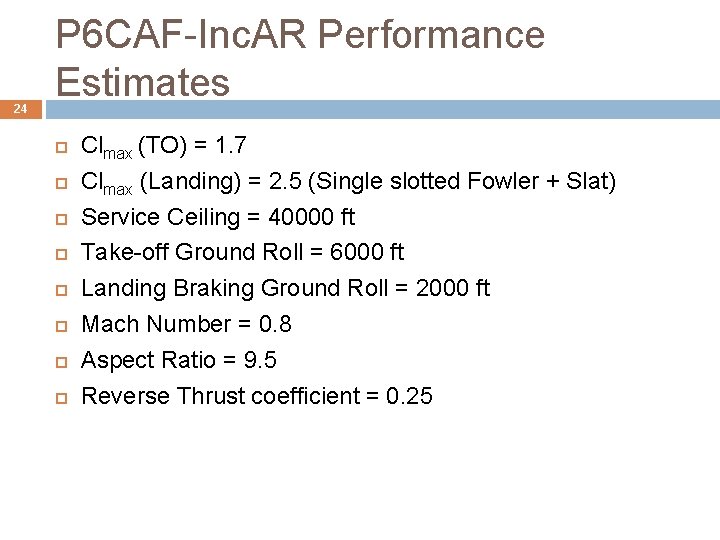
24 P 6 CAF-Inc. AR Performance Estimates Clmax (TO) = 1. 7 Clmax (Landing) = 2. 5 (Single slotted Fowler + Slat) Service Ceiling = 40000 ft Take-off Ground Roll = 6000 ft Landing Braking Ground Roll = 2000 ft Mach Number = 0. 8 Aspect Ratio = 9. 5 Reverse Thrust coefficient = 0. 25
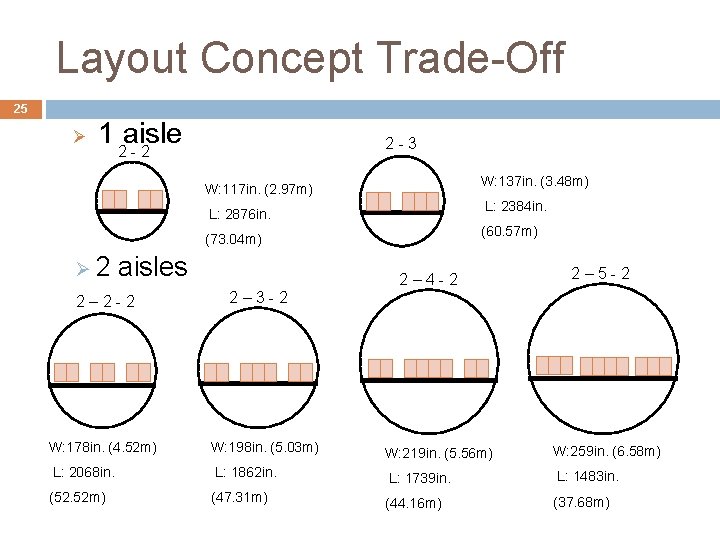
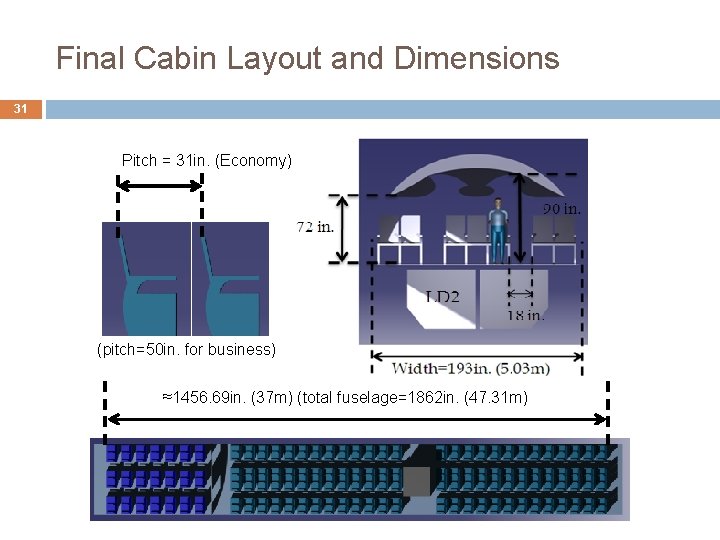
Layout Concept Trade-Off 25 Ø 1 aisle 2 - 2 2 - 3 W: 137 in. (3. 48 m) W: 117 in. (2. 97 m) L: 2384 in. L: 2876 in. (60. 57 m) (73. 04 m) Ø 2 aisles 2 – 2 - 2 2 – 4 - 2 2 – 5 - 2 2 – 3 - 2 W: 178 in. (4. 52 m) W: 198 in. (5. 03 m) W: 219 in. (5. 56 m) W: 259 in. (6. 58 m) L: 2068 in. L: 1862 in. L: 1739 in. L: 1483 in. (52. 52 m) (47. 31 m) (44. 16 m) (37. 68 m)
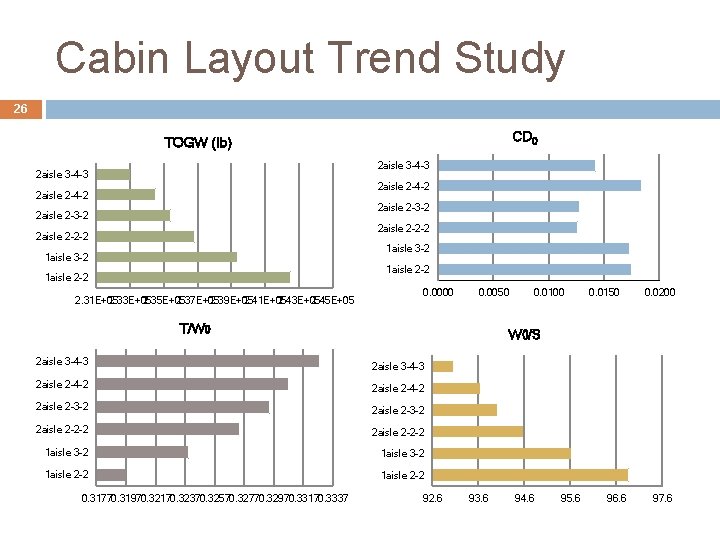
Cabin Layout Trend Study 26 CD 0 TOGW (lb) 2 aisle 3 -4 -3 2 aisle 2 -4 -2 2 aisle 2 -3 -2 2 aisle 2 -2 -2 1 aisle 3 -2 1 aisle 2 -2 2. 31 E+05 2. 33 E+05 2. 35 E+05 2. 37 E+05 2. 39 E+05 2. 41 E+05 2. 43 E+05 2. 45 E+05 0. 0000 0. 0050 T/W 0 2 aisle 3 -4 -3 0. 0150 0. 0200 W 0/S 2 aisle 3 -4 -3 2 aisle 2 -4 -2 2 aisle 2 -3 -2 2 aisle 2 -2 -2 1 aisle 3 -2 1 aisle 2 -2 0. 31770. 31970. 32170. 32370. 32570. 32770. 32970. 33170. 3337 0. 0100 92. 6 93. 6 94. 6 95. 6 96. 6 97. 6
Aircraft Description Three-View • Cabin Layout •
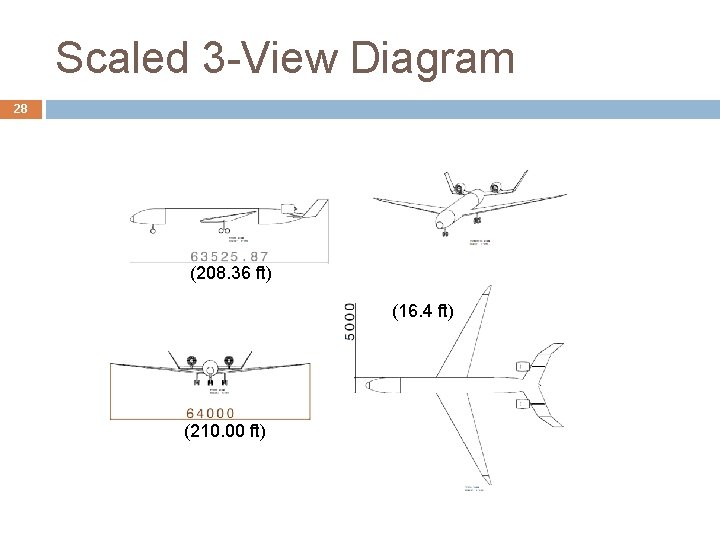
Scaled 3 -View Diagram 28 (208. 36 ft) (16. 4 ft) (210. 00 ft)
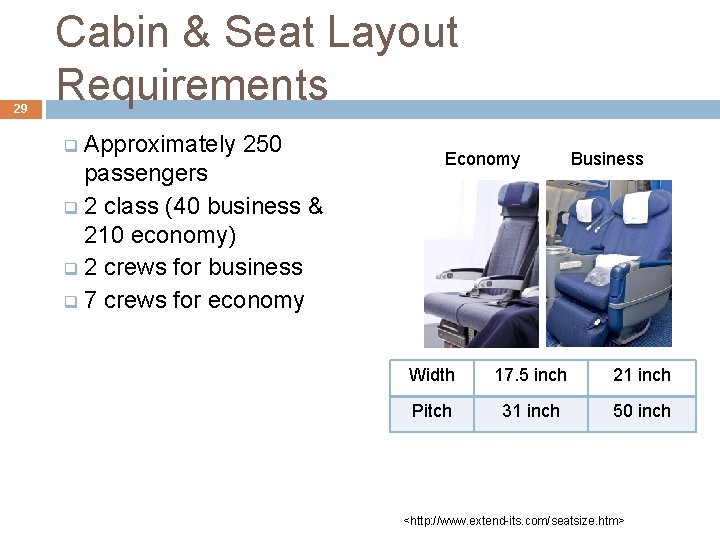
29 Cabin & Seat Layout Requirements Approximately 250 passengers q 2 class (40 business & 210 economy) q 2 crews for business q 7 crews for economy q Economy Business Width 17. 5 inch 21 inch Pitch 31 inch 50 inch <http: //www. extend-its. com/seatsize. htm>
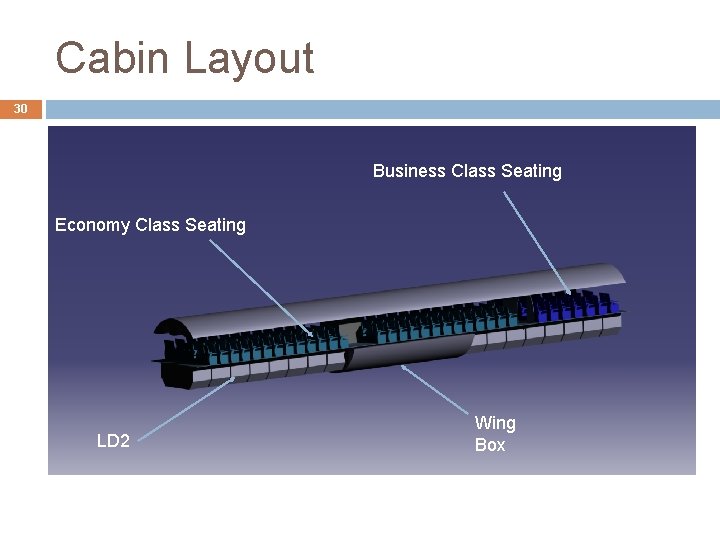
Cabin Layout 30 Business Class Seating Economy Class Seating LD 2 Wing Box
Final Cabin Layout and Dimensions 31 Pitch = 31 in. (Economy) (pitch=50 in. for business) ≈1456. 69 in. (37 m) (total fuselage=1862 in. (47. 31 m)
Aerodynamics Airfoil analysis for wing and tail • Drag build-up • Drag polars •
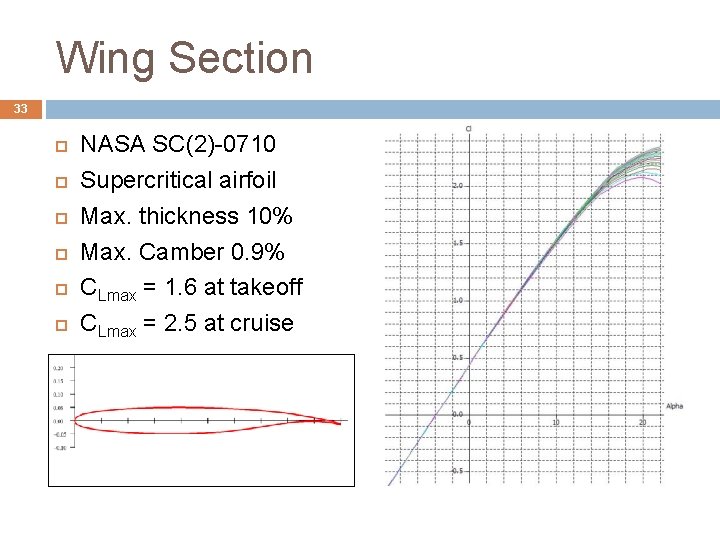
Wing Section 33 NASA SC(2)-0710 Supercritical airfoil Max. thickness 10% Max. Camber 0. 9% CLmax = 1. 6 at takeoff CLmax = 2. 5 at cruise
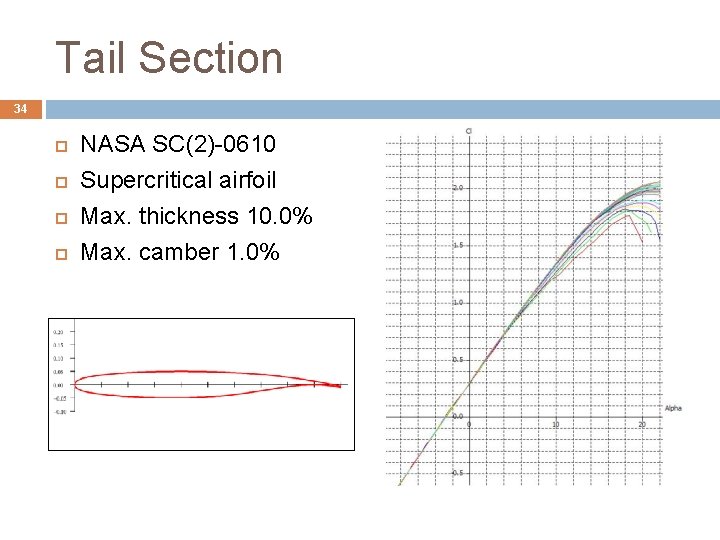
Tail Section 34 NASA SC(2)-0610 Supercritical airfoil Max. thickness 10. 0% Max. camber 1. 0%
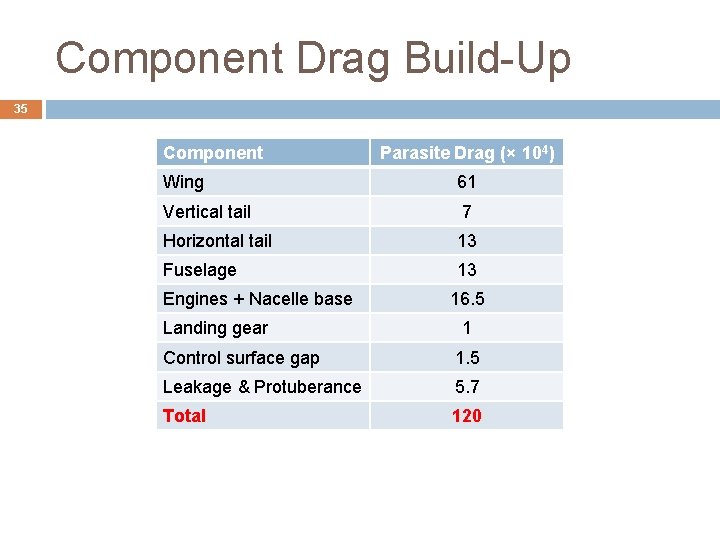
Component Drag Build-Up 35 Component Parasite Drag (× 104) Wing 61 Vertical tail 7 Horizontal tail 13 Fuselage 13 Engines + Nacelle base Landing gear 16. 5 1 Control surface gap 1. 5 Leakage & Protuberance 5. 7 Total 120
Performance • V-n (load) diagram
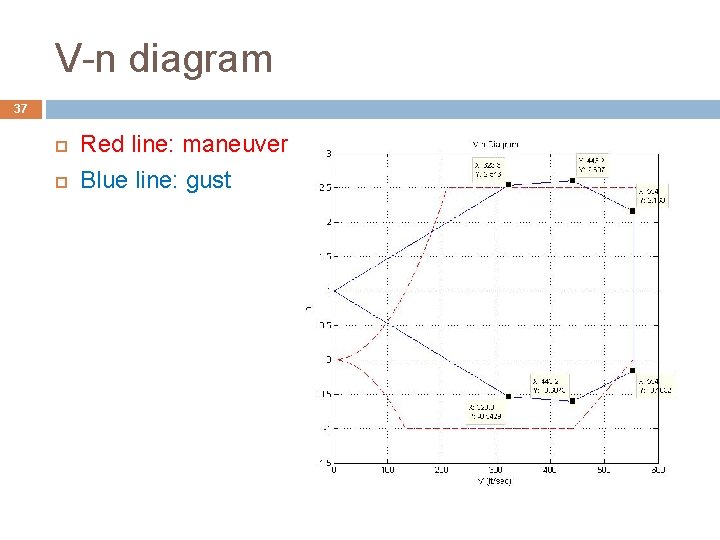
V-n diagram 37 Red line: maneuver Blue line: gust
Propulsion Engine Concept • Engine Sizing •
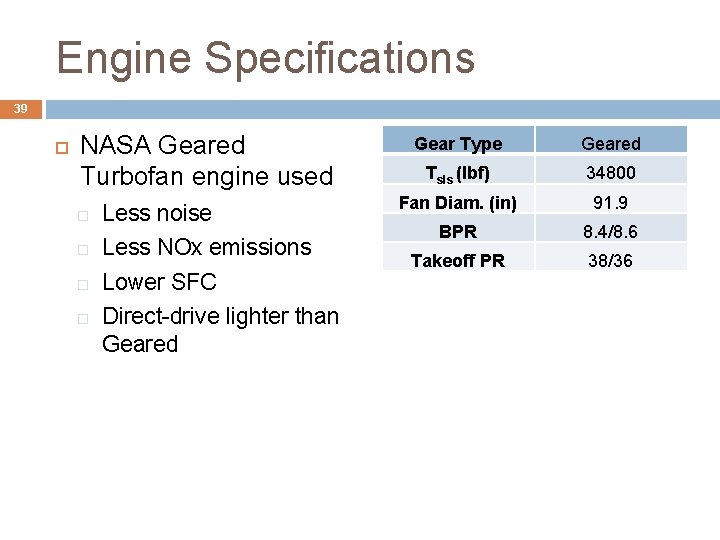
Engine Specifications 39 NASA Geared Turbofan engine used Less noise Less NOx emissions Lower SFC Direct-drive lighter than Geared Gear Type Geared Tsls (lbf) 34800 Fan Diam. (in) 91. 9 BPR 8. 4/8. 6 Takeoff PR 38/36
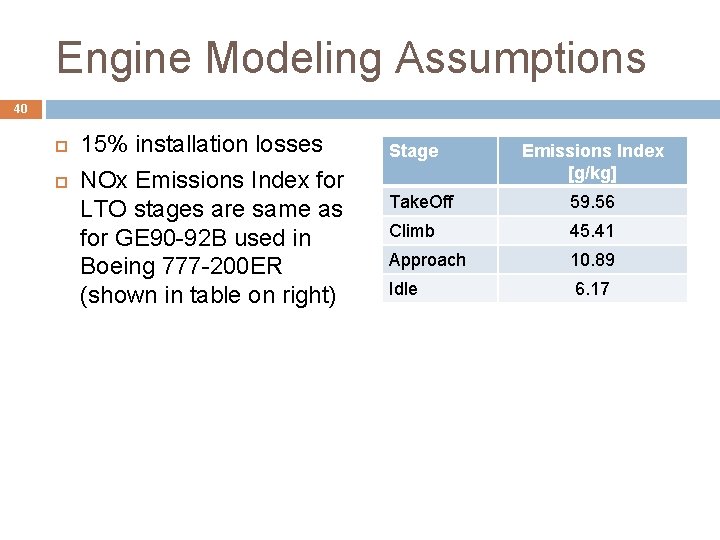
Engine Modeling Assumptions 40 15% installation losses NOx Emissions Index for LTO stages are same as for GE 90 -92 B used in Boeing 777 -200 ER (shown in table on right) Stage Emissions Index [g/kg] Take. Off 59. 56 Climb 45. 41 Approach 10. 89 Idle 6. 17
Structures • Load paths
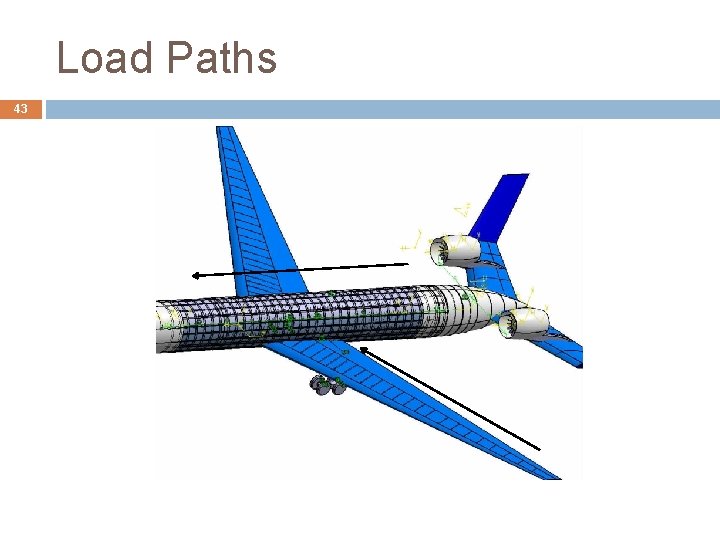
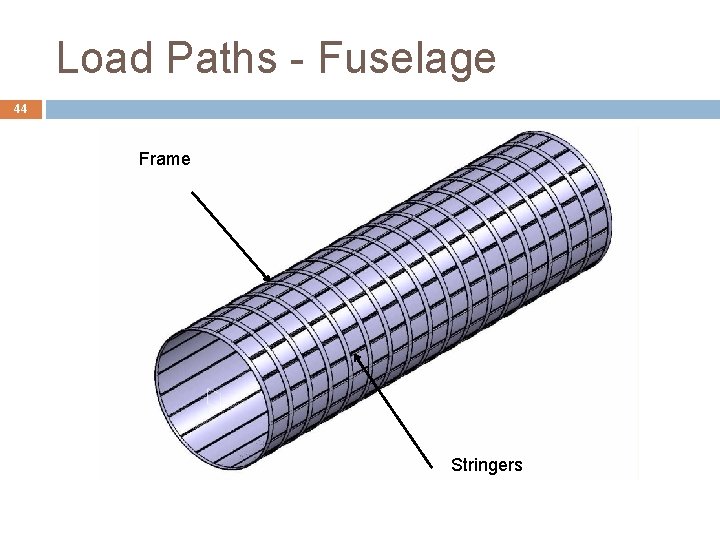
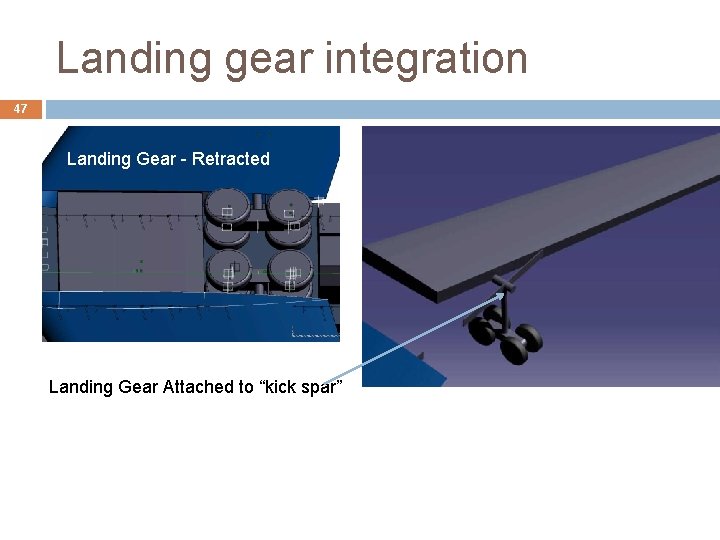
Load Paths 42 Wing box carry-through � Mainly Carbon Fiber Composites Stringer – Skin System for pressurization and fuselage loads Wing and landing gears are attached to bulkhead
Load Paths 43
Load Paths - Fuselage 44 Frame Stringers
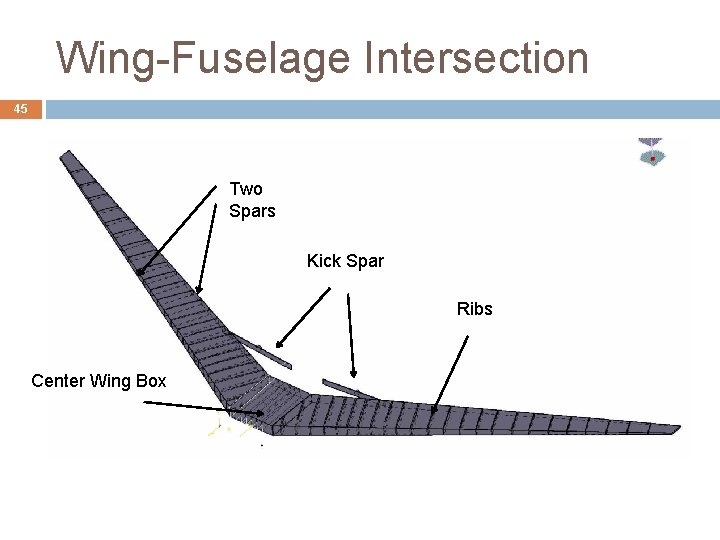
Wing-Fuselage Intersection 45 Two Spars Kick Spar Ribs Center Wing Box
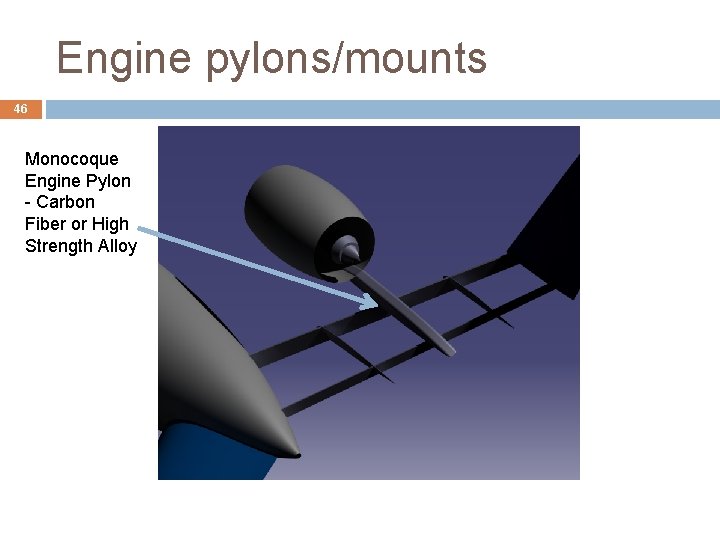
Engine pylons/mounts 46 Monocoque Engine Pylon - Carbon Fiber or High Strength Alloy
Landing gear integration 47 Landing Gear - Retracted Landing Gear Attached to “kick spar”
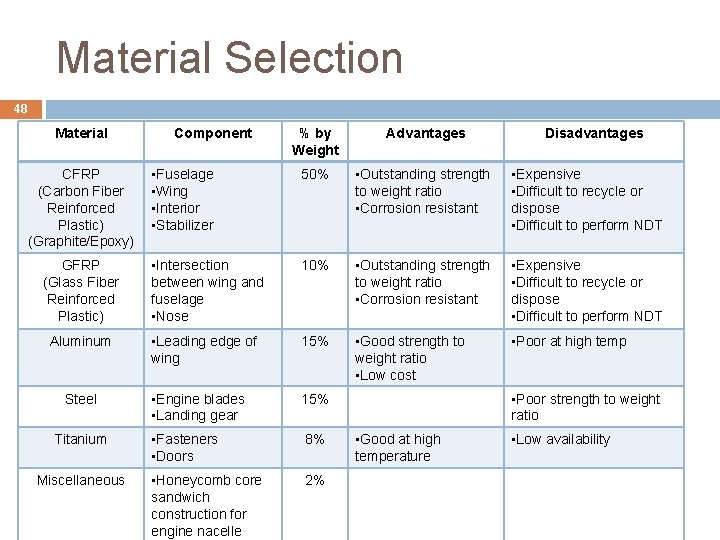
Material Selection 48 Material % by Weight Advantages • Fuselage • Wing • Interior • Stabilizer 50% • Outstanding strength to weight ratio • Corrosion resistant • Expensive • Difficult to recycle or dispose • Difficult to perform NDT GFRP (Glass Fiber Reinforced Plastic) • Intersection between wing and fuselage • Nose 10% • Outstanding strength to weight ratio • Corrosion resistant • Expensive • Difficult to recycle or dispose • Difficult to perform NDT Aluminum • Leading edge of wing 15% • Good strength to weight ratio • Low cost • Poor at high temp • Engine blades • Landing gear 15% • Fasteners • Doors 8% • Honeycomb core sandwich construction for engine nacelle 2% CFRP (Carbon Fiber Reinforced Plastic) (Graphite/Epoxy) Steel Titanium Miscellaneous Component Disadvantages • Poor strength to weight ratio • Good at high temperature • Low availability
Weight Estimates Aircraft component weights • Weight prediction method • Location of c. g. •
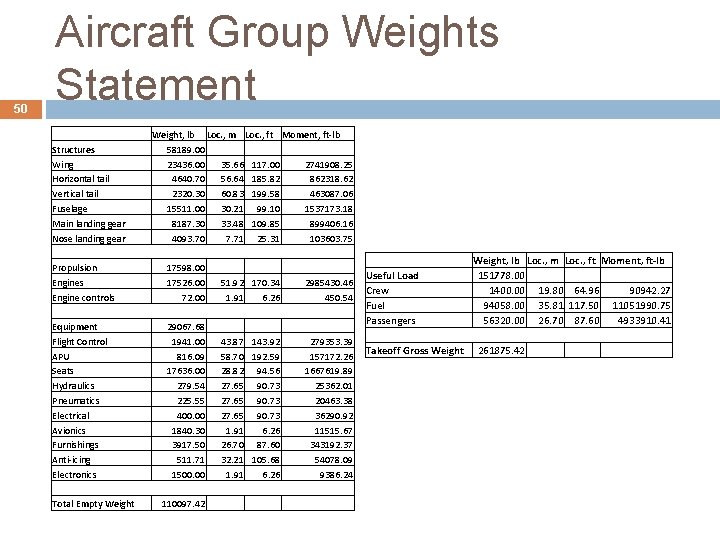
50 Aircraft Group Weights Statement Structures Wing Horizontal tail Vertical tail Fuselage Main landing gear Nose landing gear Propulsion Engines Engine controls Equipment Flight Control APU Seats Hydraulics Pneumatics Electrical Avionics Furnishings Anti-icing Electronics Total Empty Weight, lb Loc. , m Loc. , ft Moment, ft-lb 58189. 00 23436. 00 35. 66 117. 00 2741908. 25 4640. 70 56. 64 185. 82 862318. 62 2320. 30 60. 83 199. 58 463087. 06 15511. 00 30. 21 99. 10 1537173. 18 8187. 30 33. 48 109. 85 899406. 16 4093. 70 7. 71 25. 31 103603. 75 17598. 00 17526. 00 51. 92 170. 34 2985430. 46 72. 00 1. 91 6. 26 450. 54 29067. 68 1941. 00 43. 87 143. 92 279353. 39 816. 09 58. 70 192. 59 157172. 26 17636. 00 28. 82 94. 56 1667619. 89 279. 54 27. 65 90. 73 25362. 01 225. 55 27. 65 90. 73 20463. 38 400. 00 27. 65 90. 73 36290. 92 1840. 30 1. 91 6. 26 11515. 67 3917. 50 26. 70 87. 60 343192. 37 511. 71 32. 21 105. 68 54078. 09 1500. 00 1. 91 6. 26 9386. 24 110097. 42 Useful Load Crew Fuel Passengers Weight, lb Loc. , m Loc. , ft Moment, ft-lb 151778. 00 1400. 00 19. 80 64. 96 90942. 27 94058. 00 35. 81 117. 50 11051990. 75 56320. 00 26. 70 87. 60 4933910. 41 Takeoff Gross Weight 261875. 42
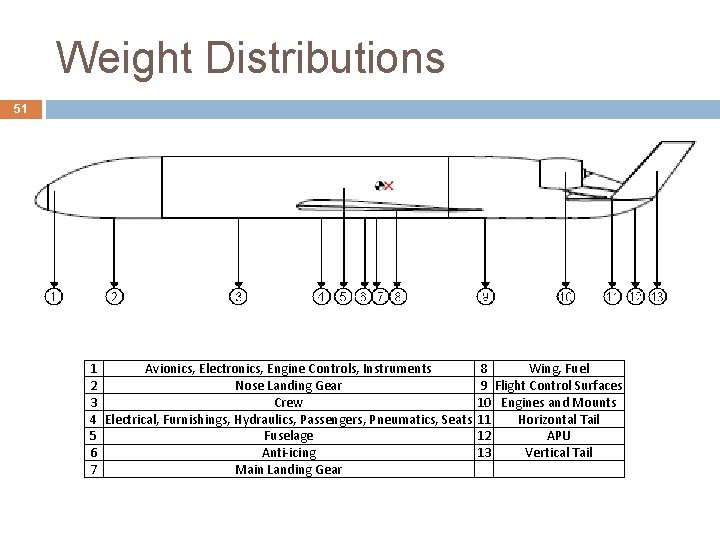
Weight Distributions 51 1 Avionics, Electronics, Engine Controls, Instruments 8 Wing, Fuel 2 Nose Landing Gear 9 Flight Control Surfaces 3 Crew 10 Engines and Mounts 4 Electrical, Furnishings, Hydraulics, Passengers, Pneumatics, Seats 11 Horizontal Tail 5 Fuselage 12 APU 6 Anti-icing 13 Vertical Tail 7 Main Landing Gear
52 Empty Weight Prediction Methods Empty weight elements calculated using Raymer’s equations 15. 25 - 15. 45 based mostly from geometric characteristics of our aircraft These equations are estimates for cargo and transport aircraft
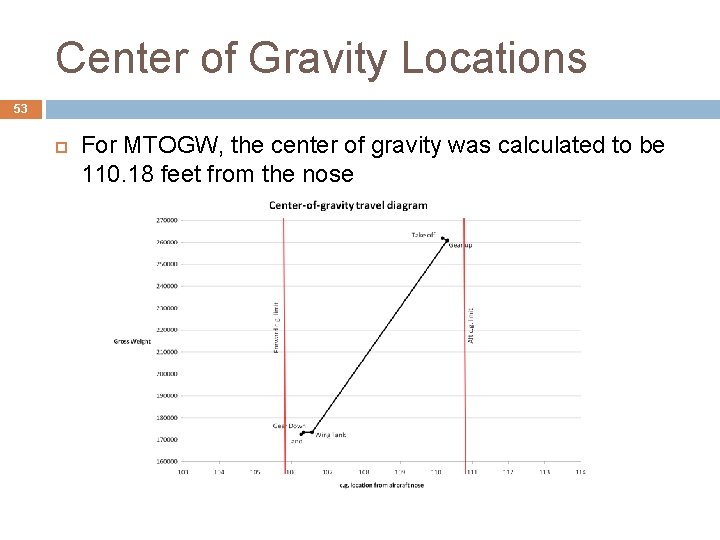
Center of Gravity Locations 53 For MTOGW, the center of gravity was calculated to be 110. 18 feet from the nose
54 Stability & Control Estimates Location of c. g. • Static margin estimates • Tail sizing approach •
Static Longitudinal Stability 55 The neutral point was calculated to be about 112. 51 feet from the nose. Using the MTOGW c. g. and a MAC of 21. 36 ft. , the MTOGW static margin is about 10. 93% The static margin varies in flight as the c. g. moves Based on c. g. travel diagram, max SM will be at landing (SM=29. 25%) and min SM will be just after gear up (SM=10. 31%)
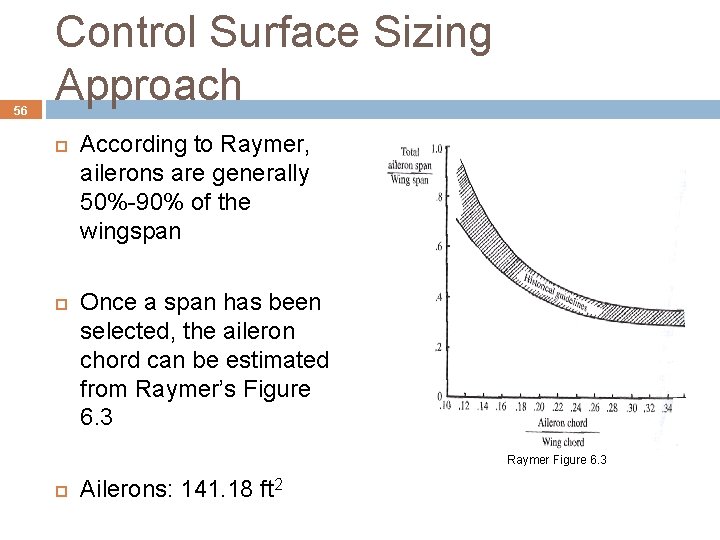
56 Control Surface Sizing Approach According to Raymer, ailerons are generally 50%-90% of the wingspan Once a span has been selected, the aileron chord can be estimated from Raymer’s Figure 6. 3 Raymer Figure 6. 3 Ailerons: 141. 18 ft 2
Control Surface Sizes 57 q q According to Raymer, elevators and rudders are usually about 90% of the tail span Raymer Table 6. 5 states for transport aircraft, rudder chord to tail chord is about 0. 32 and elevator chord to tail chord is about 0. 25 Elevators: 77. 04 ft 2 Rudders: 49. 53 ft 2
58 Noise reduction features • Certification noise values •
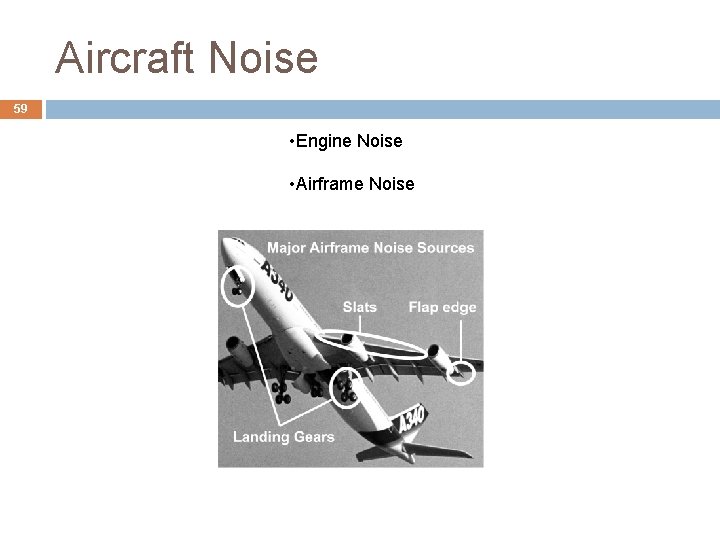
Aircraft Noise 59 • Engine Noise • Airframe Noise
Engine Noise 60 Geared Turbofan Engine � Estimated to have 20 d. B reduction compared to current direct-drive turbofan � Add 3 d. B for 2 engines U-Tail Shielding Effect � Reduce engine noise during take off and approach by 20 d. B
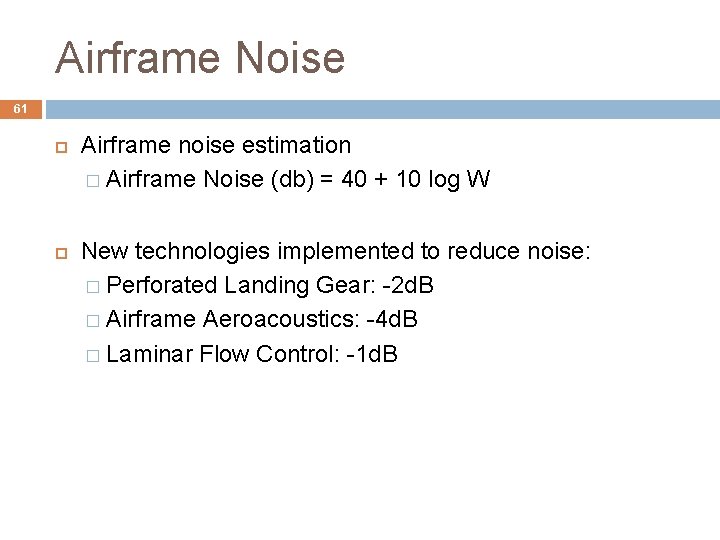
Airframe Noise 61 Airframe noise estimation � Airframe Noise (db) = 40 + 10 log W New technologies implemented to reduce noise: � Perforated Landing Gear: -2 d. B � Airframe Aeroacoustics: -4 d. B � Laminar Flow Control: -1 d. B
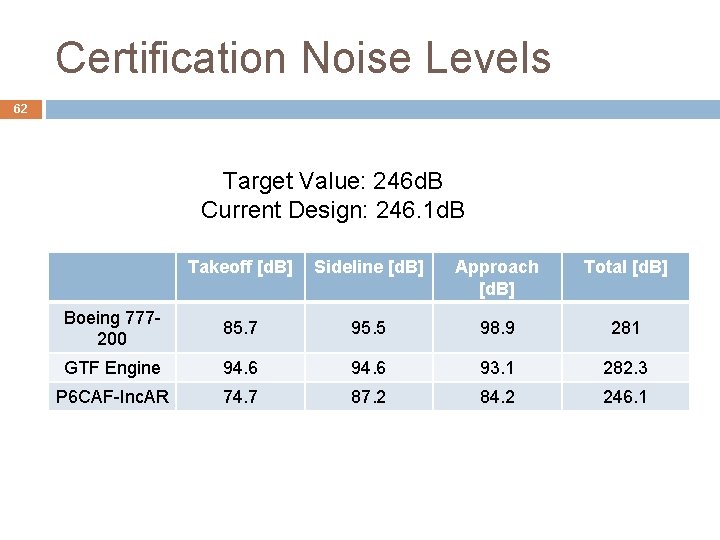
Certification Noise Levels 62 Target Value: 246 d. B Current Design: 246. 1 d. B Takeoff [d. B] Sideline [d. B] Approach [d. B] Total [d. B] Boeing 777200 85. 7 95. 5 98. 9 281 GTF Engine 94. 6 93. 1 282. 3 P 6 CAF-Inc. AR 74. 7 87. 2 84. 2 246. 1
Cost Analysis Development & manufacturing costs • No. of aircraft • Cost computation method •
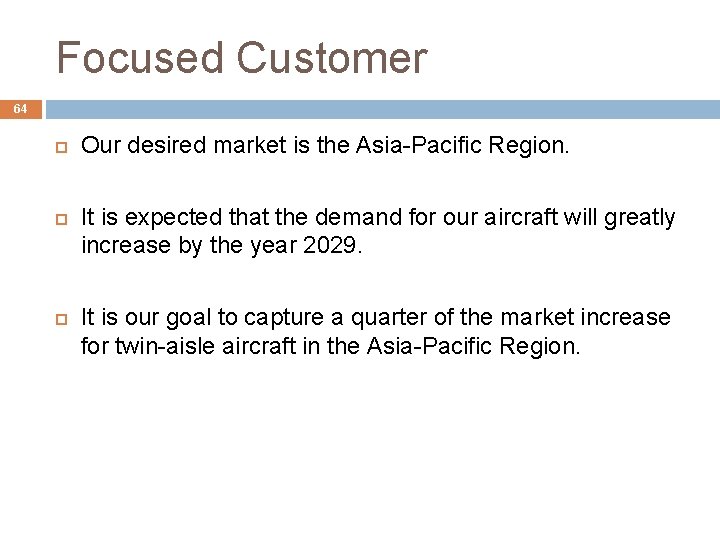
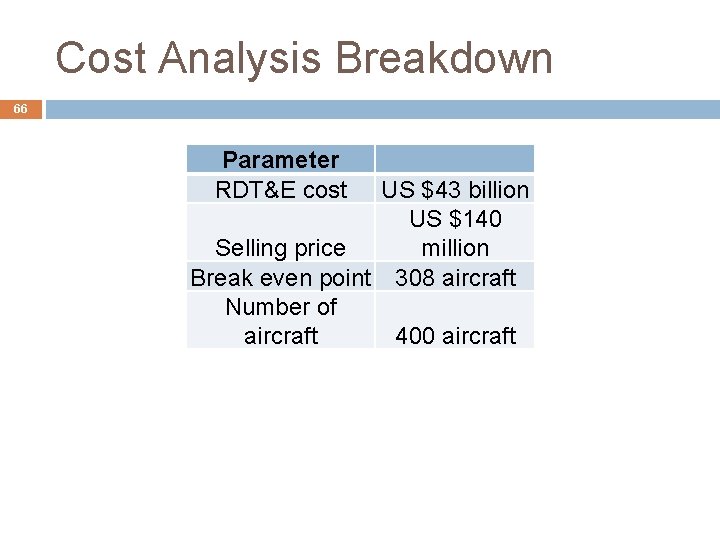
Focused Customer 64 Our desired market is the Asia-Pacific Region. It is expected that the demand for our aircraft will greatly increase by the year 2029. It is our goal to capture a quarter of the market increase for twin-aisle aircraft in the Asia-Pacific Region.
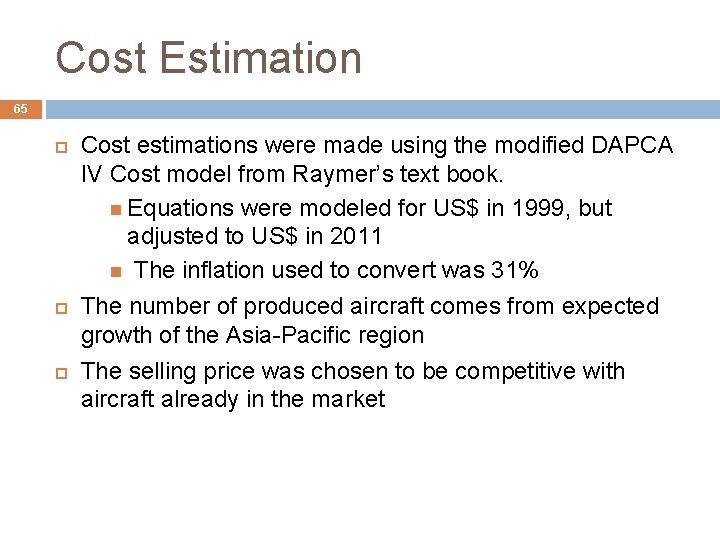
Cost Estimation 65 Cost estimations were made using the modified DAPCA IV Cost model from Raymer’s text book. Equations were modeled for US$ in 1999, but adjusted to US$ in 2011 The inflation used to convert was 31% The number of produced aircraft comes from expected growth of the Asia-Pacific region The selling price was chosen to be competitive with aircraft already in the market
Cost Analysis Breakdown 66 Parameter RDT&E cost US $43 billion US $140 Selling price million Break even point 308 aircraft Number of aircraft 400 aircraft
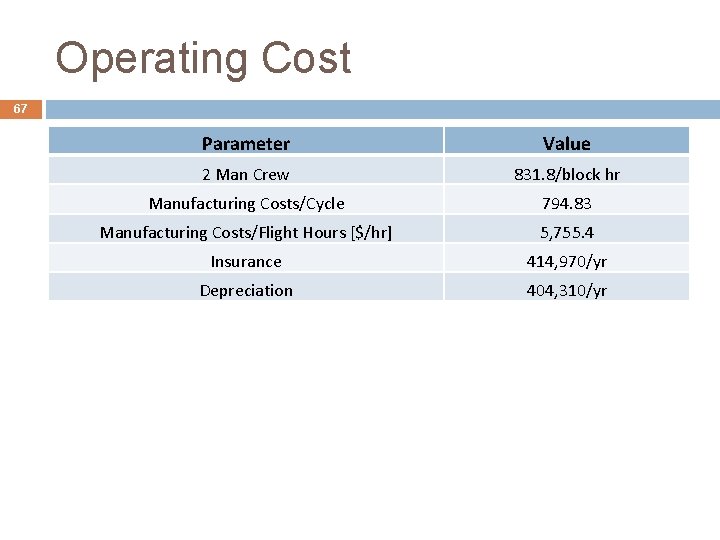
Operating Cost 67 Parameter Value 2 Man Crew 831. 8/block hr Manufacturing Costs/Cycle 794. 83 Manufacturing Costs/Flight Hours [$/hr] 5, 755. 4 Insurance 414, 970/yr Depreciation 404, 310/yr
68 Summary of Concepts • Next Steps •
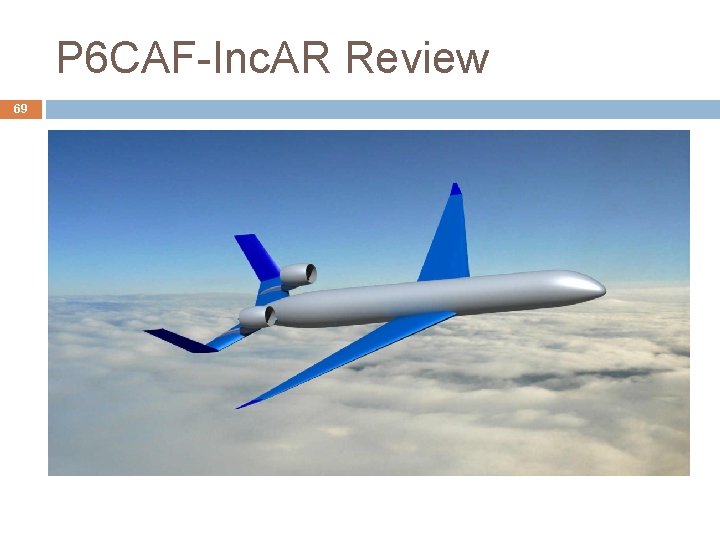
P 6 CAF-Inc. AR Review 69
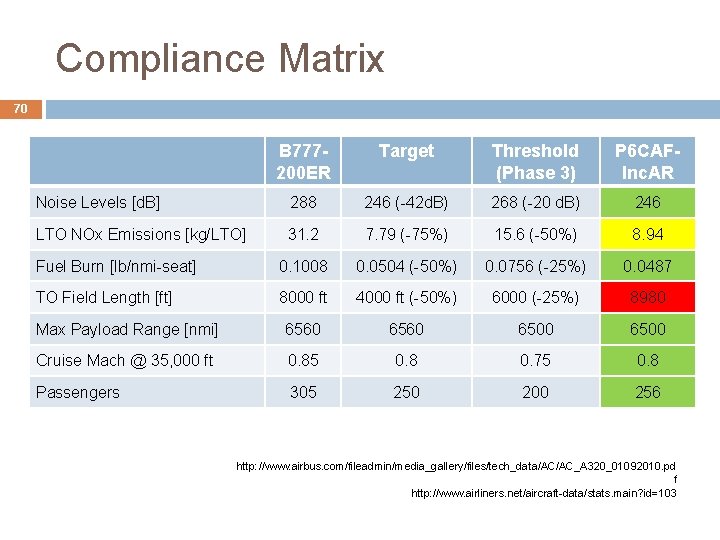
Compliance Matrix 70 B 777200 ER Target Threshold (Phase 3) P 6 CAFInc. AR Noise Levels [d. B] 288 246 (-42 d. B) 268 (-20 d. B) 246 LTO NOx Emissions [kg/LTO] 31. 2 7. 79 (-75%) 15. 6 (-50%) 8. 94 Fuel Burn [lb/nmi-seat] 0. 1008 0. 0504 (-50%) 0. 0756 (-25%) 0. 0487 TO Field Length [ft] 8000 ft 4000 ft (-50%) 6000 (-25%) 8980 Max Payload Range [nmi] 6560 6500 Cruise Mach @ 35, 000 ft 0. 85 0. 8 0. 75 0. 8 Passengers 305 250 200 256 http: //www. airbus. com/fileadmin/media_gallery/files/tech_data/AC/AC_A 320_01092010. pd f http: //www. airliners. net/aircraft-data/stats. main? id=103
Summary 71 Current design shows excellent potential in achieving desired NASA ERA N+2 requirements Take-off field length is currently the only requirement which does not meet Phase III threshold values Concept shows potential for future environmentallyresponsible aircraft with economic feasibility
Next Steps 72 Finishing touches: � Best range and best endurance velocity � Lateral stability analysis (cross-wind landing, oneengine out trim) � Further tweak code to improve take-off field length Near Future � Further refine and improve cost analysis to include technology implementation � Obtain parameter improvements for individual technologies (currently using fudge factors)
Q&A