TAU Tutorial Sameer Shende Allen D Malony and
![TAU Measurement System Configuration r configure [OPTIONS] ¦ {-c++=<CC>, -cc=<cc>} Specify C++ and C TAU Measurement System Configuration r configure [OPTIONS] ¦ {-c++=<CC>, -cc=<cc>} Specify C++ and C](https://slidetodoc.com/presentation_image_h2/fd210204103b913623bfa6bc29bb02ec/image-14.jpg)
![TAU Measurement System Configuration r configure [OPTIONS] ¦ ¦ ¦ -TRACE Generate binary TAU TAU Measurement System Configuration r configure [OPTIONS] ¦ ¦ ¦ -TRACE Generate binary TAU](https://slidetodoc.com/presentation_image_h2/fd210204103b913623bfa6bc29bb02ec/image-15.jpg)
![TAU Performance System Interfaces r r PDT [U. Oregon, LANL, FZJ] for instrumentation of TAU Performance System Interfaces r r PDT [U. Oregon, LANL, FZJ] for instrumentation of](https://slidetodoc.com/presentation_image_h2/fd210204103b913623bfa6bc29bb02ec/image-17.jpg)
![Compiling % configure [options] % make clean install Creates <arch>/lib/Makefile. tau<options> stub Makefile and Compiling % configure [options] % make clean install Creates <arch>/lib/Makefile. tau<options> stub Makefile and](https://slidetodoc.com/presentation_image_h2/fd210204103b913623bfa6bc29bb02ec/image-26.jpg)
![Using PDT: tau_instrumentor % tau_instrumentor Usage : tau_instrumentor <pdbfile> <sourcefile> [-o <outputfile>] [-noinline] [ Using PDT: tau_instrumentor % tau_instrumentor Usage : tau_instrumentor <pdbfile> <sourcefile> [-o <outputfile>] [-noinline] [](https://slidetodoc.com/presentation_image_h2/fd210204103b913623bfa6bc29bb02ec/image-46.jpg)
![Using Opari with TAU Step I: Configure KOJAK/opari [Download from http: //www. fz-juelich. de/zam/kojak/] Using Opari with TAU Step I: Configure KOJAK/opari [Download from http: //www. fz-juelich. de/zam/kojak/]](https://slidetodoc.com/presentation_image_h2/fd210204103b913623bfa6bc29bb02ec/image-51.jpg)
![CCA Performance Observation Component Common Component Architecture for Scientific Components [www. cca-forum. org] r CCA Performance Observation Component Common Component Architecture for Scientific Components [www. cca-forum. org] r](https://slidetodoc.com/presentation_image_h2/fd210204103b913623bfa6bc29bb02ec/image-57.jpg)
![Using TAU Component in ESMF/CCA [S. Zhou] The TAU Performance System 61 TAU Tutorial Using TAU Component in ESMF/CCA [S. Zhou] The TAU Performance System 61 TAU Tutorial](https://slidetodoc.com/presentation_image_h2/fd210204103b913623bfa6bc29bb02ec/image-61.jpg)
![CUBE (UTK, FZJ) Browser [Sept. 2004] The TAU Performance System 123 TAU Tutorial ORNL CUBE (UTK, FZJ) Browser [Sept. 2004] The TAU Performance System 123 TAU Tutorial ORNL](https://slidetodoc.com/presentation_image_h2/fd210204103b913623bfa6bc29bb02ec/image-121.jpg)
- Slides: 124

TAU Tutorial Sameer Shende, Allen D. Malony, and Alan Morris {sameer, malony, amorris}@cs. uoregon. edu Department of Computer and Information Science Neuro. Informatics Center University of Oregon

Outline r r r Motivation Part I: Instrumentation Part II: Measurement Part III: Analysis Tools Conclusion The TAU Performance System 2 TAU Tutorial ORNL Mar. 8, 2005

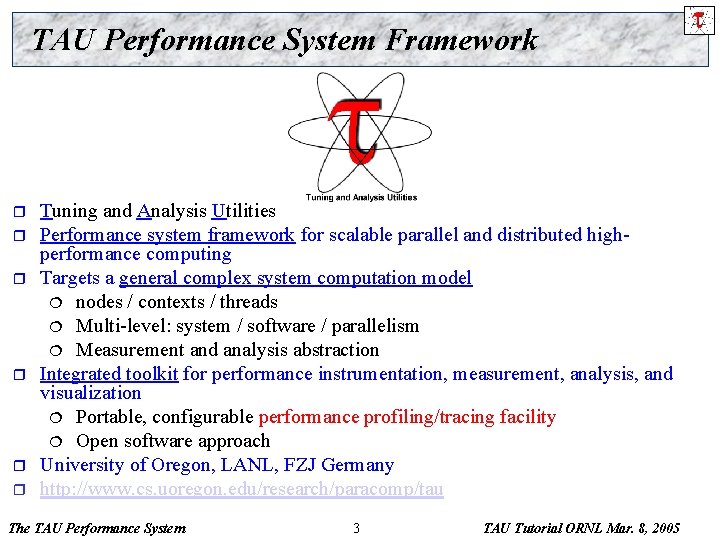
TAU Performance System Framework r r r Tuning and Analysis Utilities Performance system framework for scalable parallel and distributed highperformance computing Targets a general complex system computation model ¦ nodes / contexts / threads ¦ Multi-level: system / software / parallelism ¦ Measurement and analysis abstraction Integrated toolkit for performance instrumentation, measurement, analysis, and visualization ¦ Portable, configurable performance profiling/tracing facility ¦ Open software approach University of Oregon, LANL, FZJ Germany http: //www. cs. uoregon. edu/research/paracomp/tau The TAU Performance System 3 TAU Tutorial ORNL Mar. 8, 2005

TAU Performance Systems Goals r Multi-level performance instrumentation ¦ r r Flexible and configurable performance measurement Widely-ported parallel performance profiling system ¦ ¦ r r r Computer system architectures and operating systems Different programming languages and compilers Support for multiple parallel programming paradigms ¦ r Multi-language automatic source instrumentation Multi-threading, message passing, mixed-mode, hybrid Support for performance mapping Support for object-oriented and generic programming Integration in complex software systems and applications The TAU Performance System 4 TAU Tutorial ORNL Mar. 8, 2005

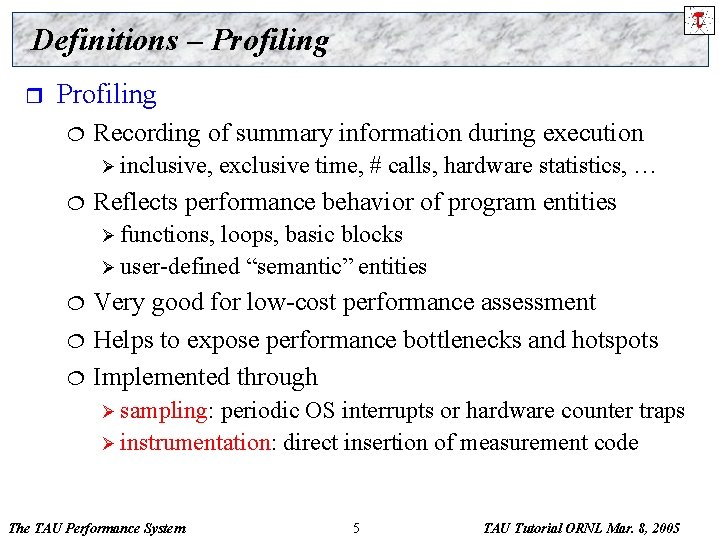
Definitions – Profiling r Profiling ¦ Recording of summary information during execution Ø inclusive, ¦ exclusive time, # calls, hardware statistics, … Reflects performance behavior of program entities Ø functions, loops, basic blocks Ø user-defined “semantic” entities ¦ ¦ ¦ Very good for low-cost performance assessment Helps to expose performance bottlenecks and hotspots Implemented through Ø sampling: periodic OS interrupts or hardware counter traps Ø instrumentation: direct insertion of measurement code The TAU Performance System 5 TAU Tutorial ORNL Mar. 8, 2005

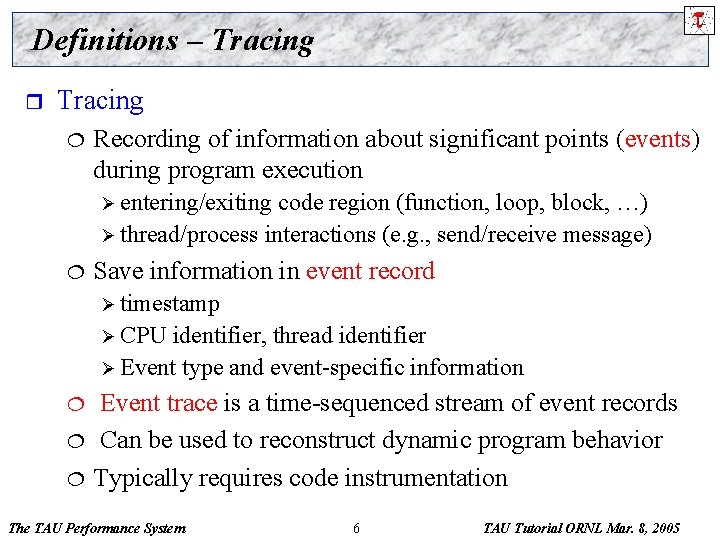
Definitions – Tracing r Tracing ¦ Recording of information about significant points (events) during program execution Ø entering/exiting code region (function, loop, block, …) Ø thread/process interactions (e. g. , send/receive message) ¦ Save information in event record Ø timestamp Ø CPU identifier, thread identifier Ø Event type and event-specific information ¦ ¦ ¦ Event trace is a time-sequenced stream of event records Can be used to reconstruct dynamic program behavior Typically requires code instrumentation The TAU Performance System 6 TAU Tutorial ORNL Mar. 8, 2005

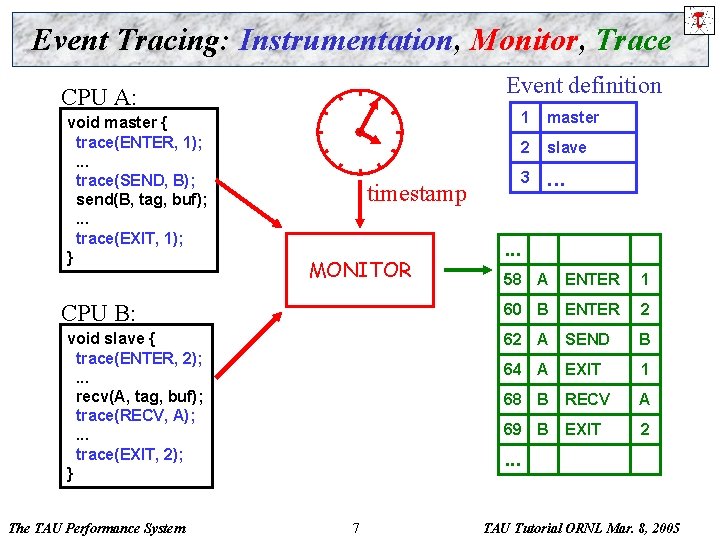
Event Tracing: Instrumentation, Monitor, Trace Event definition CPU A: void master { trace(ENTER, 1); . . . trace(SEND, B); send(B, tag, buf); . . . trace(EXIT, 1); } timestamp MONITOR CPU B: void slave { trace(ENTER, 2); . . . recv(A, tag, buf); trace(RECV, A); . . . trace(EXIT, 2); } The TAU Performance System 1 master 2 slave 3 . . . 58 A ENTER 1 60 B ENTER 2 62 A SEND B 64 A EXIT 1 68 B RECV A 69 B EXIT 2 . . . 7 TAU Tutorial ORNL Mar. 8, 2005

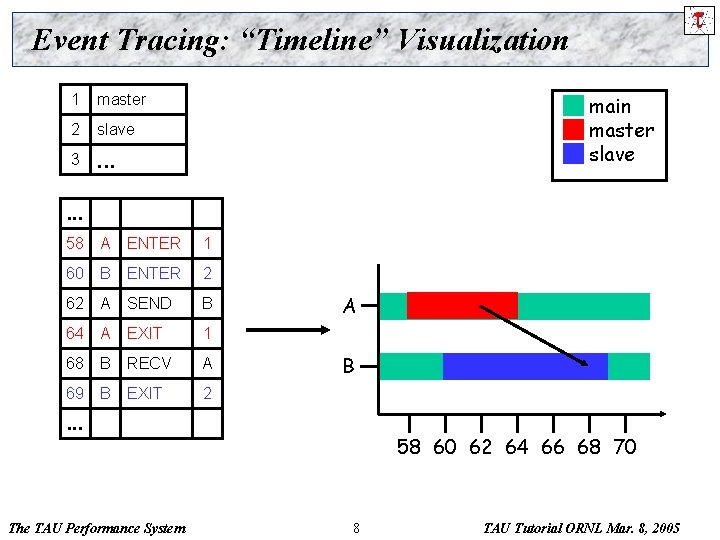
Event Tracing: “Timeline” Visualization 1 master 2 slave 3 . . . main master slave . . . 58 A ENTER 1 60 B ENTER 2 62 A SEND B 64 A EXIT 1 68 B RECV A 69 B EXIT 2 A B . . . The TAU Performance System 58 60 62 64 66 68 70 8 TAU Tutorial ORNL Mar. 8, 2005

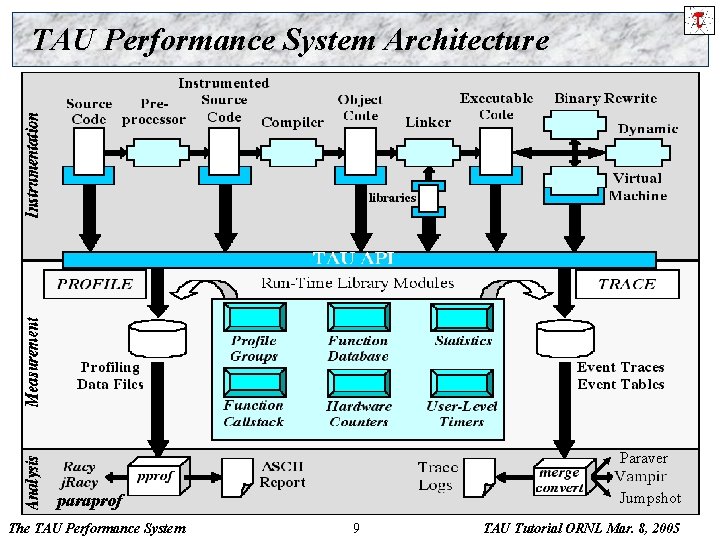
TAU Performance System Architecture Paraver Jumpshot paraprof The TAU Performance System 9 TAU Tutorial ORNL Mar. 8, 2005

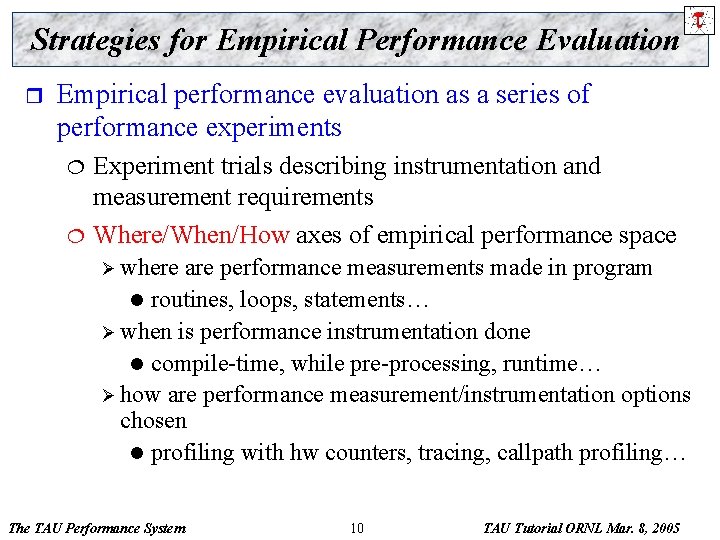
Strategies for Empirical Performance Evaluation r Empirical performance evaluation as a series of performance experiments ¦ ¦ Experiment trials describing instrumentation and measurement requirements Where/When/How axes of empirical performance space Ø where are performance measurements made in program l routines, loops, statements… Ø when is performance instrumentation done l compile-time, while pre-processing, runtime… Ø how are performance measurement/instrumentation options chosen l profiling with hw counters, tracing, callpath profiling… The TAU Performance System 10 TAU Tutorial ORNL Mar. 8, 2005

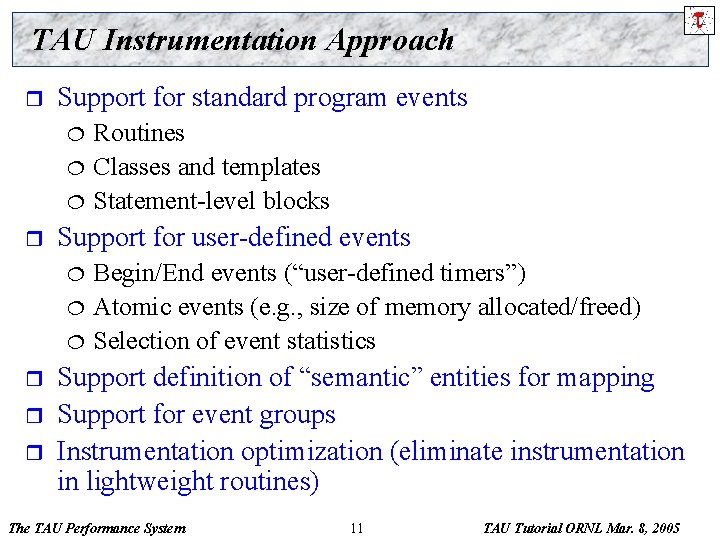
TAU Instrumentation Approach r Support for standard program events ¦ ¦ ¦ r Support for user-defined events ¦ ¦ ¦ r r r Routines Classes and templates Statement-level blocks Begin/End events (“user-defined timers”) Atomic events (e. g. , size of memory allocated/freed) Selection of event statistics Support definition of “semantic” entities for mapping Support for event groups Instrumentation optimization (eliminate instrumentation in lightweight routines) The TAU Performance System 11 TAU Tutorial ORNL Mar. 8, 2005

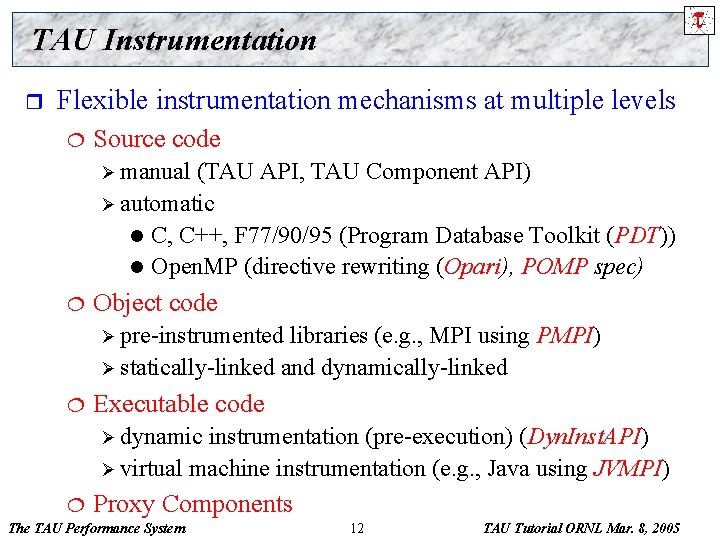
TAU Instrumentation r Flexible instrumentation mechanisms at multiple levels ¦ Source code Ø manual (TAU API, TAU Component API) Ø automatic l C, C++, F 77/90/95 (Program Database Toolkit (PDT)) l Open. MP (directive rewriting (Opari), POMP spec) ¦ Object code Ø pre-instrumented libraries (e. g. , MPI using PMPI) Ø statically-linked and dynamically-linked ¦ Executable code Ø dynamic instrumentation (pre-execution) (Dyn. Inst. API) Ø virtual machine instrumentation (e. g. , Java using JVMPI) ¦ Proxy Components The TAU Performance System 12 TAU Tutorial ORNL Mar. 8, 2005

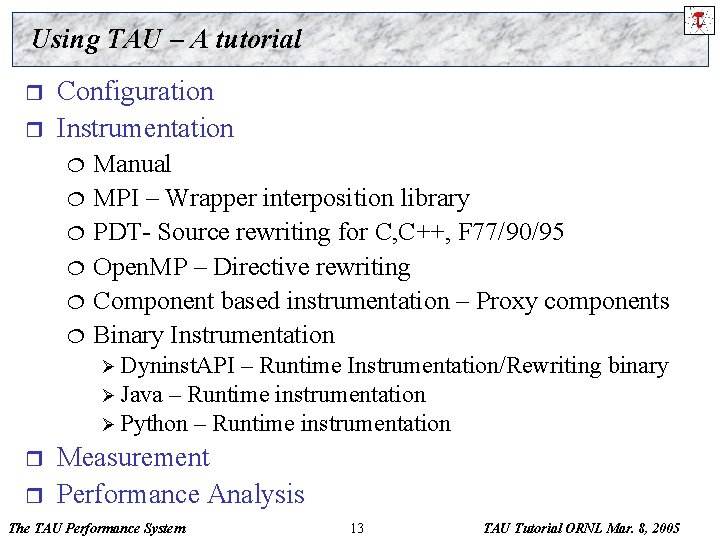
Using TAU – A tutorial r r Configuration Instrumentation ¦ ¦ ¦ Manual MPI – Wrapper interposition library PDT- Source rewriting for C, C++, F 77/90/95 Open. MP – Directive rewriting Component based instrumentation – Proxy components Binary Instrumentation Ø Dyninst. API – Runtime Instrumentation/Rewriting binary Ø Java – Runtime instrumentation Ø Python – Runtime instrumentation r r Measurement Performance Analysis The TAU Performance System 13 TAU Tutorial ORNL Mar. 8, 2005
![TAU Measurement System Configuration r configure OPTIONS cCC cccc Specify C and C TAU Measurement System Configuration r configure [OPTIONS] ¦ {-c++=<CC>, -cc=<cc>} Specify C++ and C](https://slidetodoc.com/presentation_image_h2/fd210204103b913623bfa6bc29bb02ec/image-14.jpg)
TAU Measurement System Configuration r configure [OPTIONS] ¦ {-c++=<CC>, -cc=<cc>} Specify C++ and C compilers ¦ {-pthread, -sproc} Use pthread or SGI sproc threads ¦ -openmp Use Open. MP threads ¦ -jdk=<dir> Specify Java instrumentation (JDK) ¦ -opari=<dir> Specify location of Opari Open. MP tool ¦ -papi=<dir> Specify location of PAPI ¦ -pdt=<dir> Specify location of PDT ¦ -dyninst=<dir> Specify location of Dyn. Inst Package ¦ -mpi[inc/lib]=<dir> Specify MPI library instrumentation ¦ -shmem[inc/lib]=<dir> Specify PSHMEM library instrumentation ¦ -python[inc/lib]=<dir> Specify Python instrumentation ¦ -epilog=<dir> Specify location of EPILOG ¦ -slog 2=<dir> Specify location of SLOF 2/Jumpshot ¦ -vtf=<dir> Specify location of VTF 3 trace package ¦ -arch=<architecture> Specify architecture explicitly (bgl, ibm 64 linux…) The TAU Performance System 14 TAU Tutorial ORNL Mar. 8, 2005
![TAU Measurement System Configuration r configure OPTIONS TRACE Generate binary TAU TAU Measurement System Configuration r configure [OPTIONS] ¦ ¦ ¦ -TRACE Generate binary TAU](https://slidetodoc.com/presentation_image_h2/fd210204103b913623bfa6bc29bb02ec/image-15.jpg)
TAU Measurement System Configuration r configure [OPTIONS] ¦ ¦ ¦ -TRACE Generate binary TAU traces -PROFILE (default) Generate profiles (summary) -PROFILECALLPATH Generate call path profiles -PROFILEPHASE Generate phase based profiles -PROFILEMEMORY Track heap memory for each routine -MULTIPLECOUNTERS Use hardware counters + time -COMPENSATE Compensate timer overhead -CPUTIME Use usertime+system time -PAPIWALLCLOCK Use PAPI’s wallclock time -PAPIVIRTUAL Use PAPI’s process virtual time -SGITIMERS Use fast IRIX timers -LINUXTIMERS Use fast x 86 Linux timers The TAU Performance System 15 TAU Tutorial ORNL Mar. 8, 2005

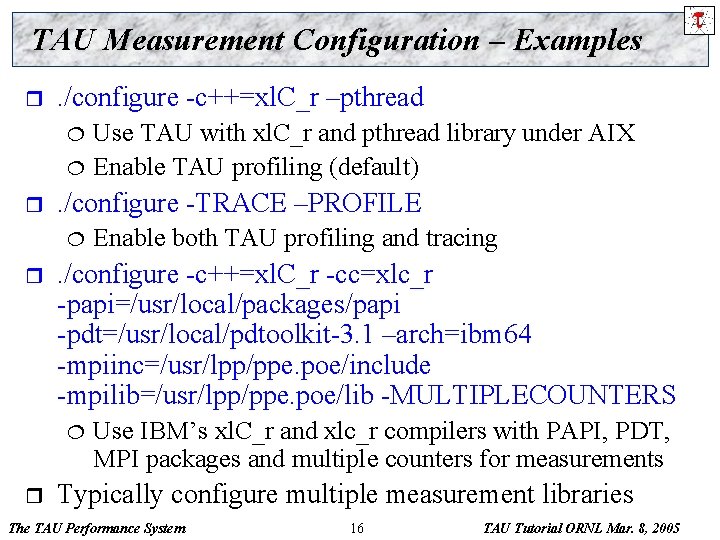
TAU Measurement Configuration – Examples r . /configure -c++=xl. C_r –pthread ¦ ¦ r . /configure -TRACE –PROFILE ¦ r Enable both TAU profiling and tracing . /configure -c++=xl. C_r -cc=xlc_r -papi=/usr/local/packages/papi -pdt=/usr/local/pdtoolkit-3. 1 –arch=ibm 64 -mpiinc=/usr/lpp/ppe. poe/include -mpilib=/usr/lpp/ppe. poe/lib -MULTIPLECOUNTERS ¦ r Use TAU with xl. C_r and pthread library under AIX Enable TAU profiling (default) Use IBM’s xl. C_r and xlc_r compilers with PAPI, PDT, MPI packages and multiple counters for measurements Typically configure multiple measurement libraries The TAU Performance System 16 TAU Tutorial ORNL Mar. 8, 2005
![TAU Performance System Interfaces r r PDT U Oregon LANL FZJ for instrumentation of TAU Performance System Interfaces r r PDT [U. Oregon, LANL, FZJ] for instrumentation of](https://slidetodoc.com/presentation_image_h2/fd210204103b913623bfa6bc29bb02ec/image-17.jpg)
TAU Performance System Interfaces r r PDT [U. Oregon, LANL, FZJ] for instrumentation of C++, C 99, F 95 source code PAPI [UTK] & PCL[FZJ] for accessing hardware performance counters data Dyninst. API [U. Maryland, U. Wisconsin] for runtime instrumentation KOJAK [FZJ, UTK] ¦ ¦ ¦ r r r Vampir/Intel® Trace Analyzer [Pallas/Intel] VTF 3 trace generation library for Vampir [TU Dresden] (available from TAU website) Paraver trace visualizer [CEPBA] Jumpshot-4 trace visualizer [MPICH, ANL] JVMPI from JDK for Java program instrumentation [Sun] Paraprofile browser/Perf. DMF database supports: ¦ ¦ ¦ r Epilog trace generation library CUBE callgraph visualizer Opari Open. MP directive rewriting tool TAU format Gprof [GNU] HPM Toolkit [IBM] Mpi. P [ORNL, LLNL] Dynaprof [UTK] PSRun [NCSA] Perf. DMF database can use Oracle, My. SQL or Postgre. SQL (IBM DB 2 support planned) The TAU Performance System 17 TAU Tutorial ORNL Mar. 8, 2005

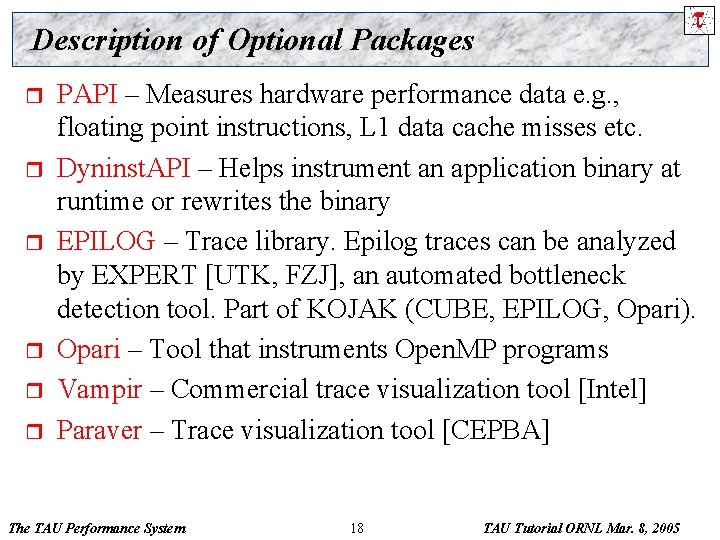
Description of Optional Packages r r r PAPI – Measures hardware performance data e. g. , floating point instructions, L 1 data cache misses etc. Dyninst. API – Helps instrument an application binary at runtime or rewrites the binary EPILOG – Trace library. Epilog traces can be analyzed by EXPERT [UTK, FZJ], an automated bottleneck detection tool. Part of KOJAK (CUBE, EPILOG, Opari). Opari – Tool that instruments Open. MP programs Vampir – Commercial trace visualization tool [Intel] Paraver – Trace visualization tool [CEPBA] The TAU Performance System 18 TAU Tutorial ORNL Mar. 8, 2005

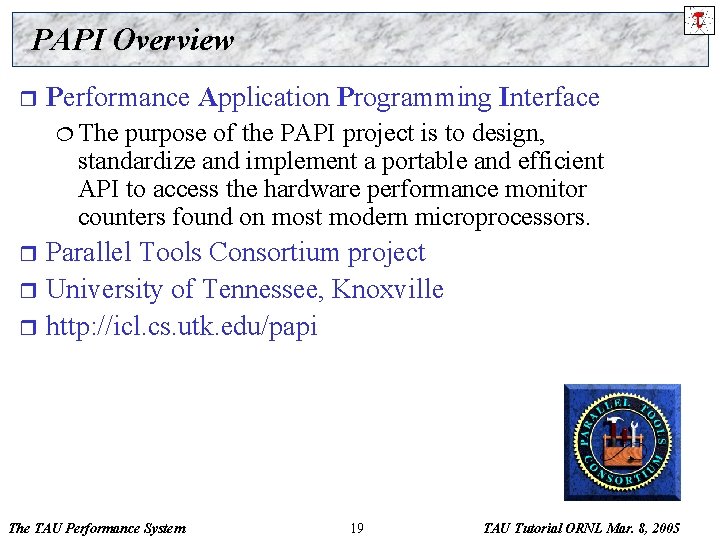
PAPI Overview r Performance Application Programming Interface ¦ The purpose of the PAPI project is to design, standardize and implement a portable and efficient API to access the hardware performance monitor counters found on most modern microprocessors. Parallel Tools Consortium project r University of Tennessee, Knoxville r http: //icl. cs. utk. edu/papi r The TAU Performance System 19 TAU Tutorial ORNL Mar. 8, 2005

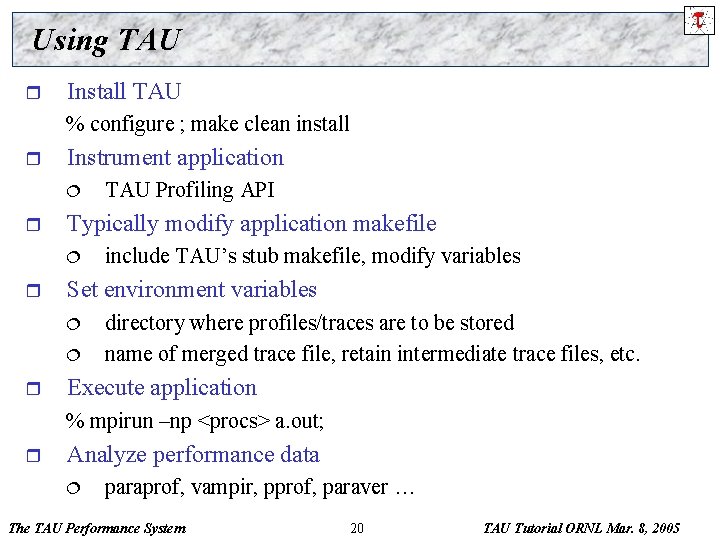
Using TAU r Install TAU % configure ; make clean install r Instrument application ¦ r Typically modify application makefile ¦ r include TAU’s stub makefile, modify variables Set environment variables ¦ ¦ r TAU Profiling API directory where profiles/traces are to be stored name of merged trace file, retain intermediate trace files, etc. Execute application % mpirun –np <procs> a. out; r Analyze performance data ¦ paraprof, vampir, pprof, paraver … The TAU Performance System 20 TAU Tutorial ORNL Mar. 8, 2005

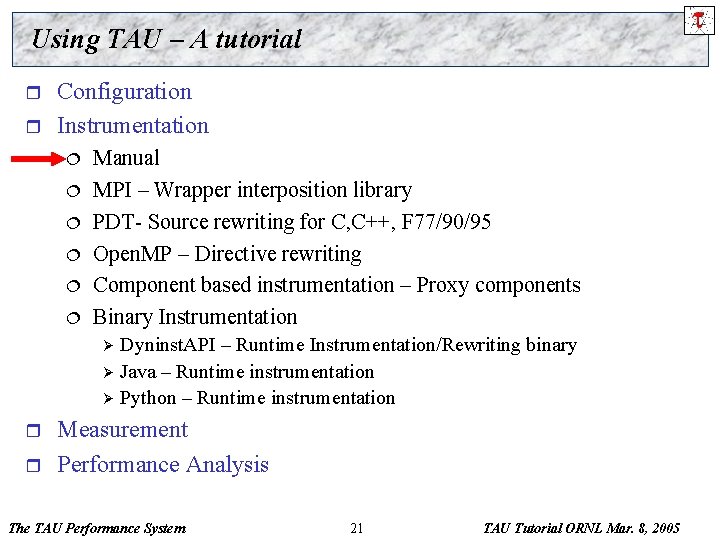
Using TAU – A tutorial r r Configuration Instrumentation ¦ ¦ ¦ Manual MPI – Wrapper interposition library PDT- Source rewriting for C, C++, F 77/90/95 Open. MP – Directive rewriting Component based instrumentation – Proxy components Binary Instrumentation Dyninst. API – Runtime Instrumentation/Rewriting binary Ø Java – Runtime instrumentation Ø Python – Runtime instrumentation Ø r r Measurement Performance Analysis The TAU Performance System 21 TAU Tutorial ORNL Mar. 8, 2005

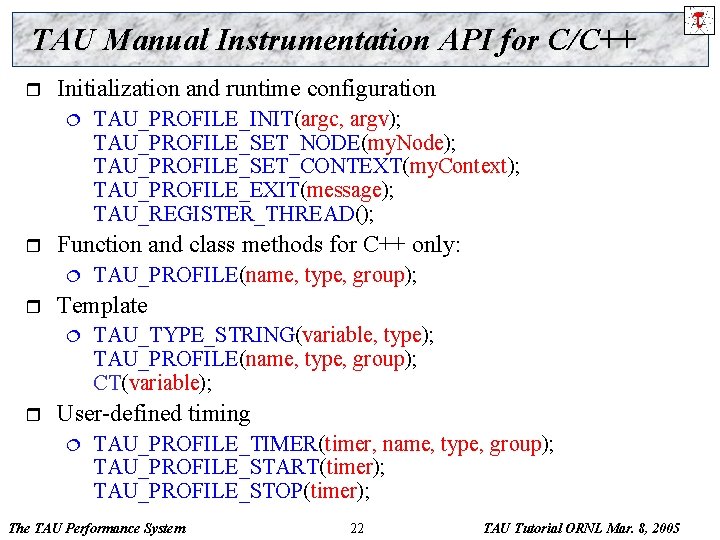
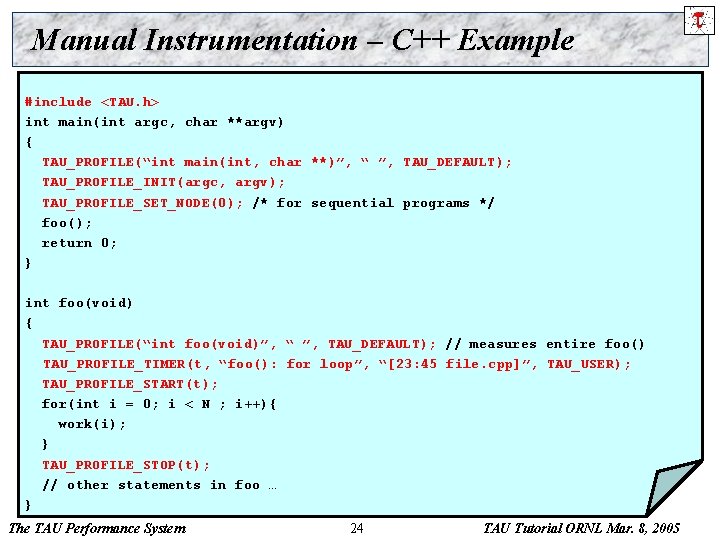
TAU Manual Instrumentation API for C/C++ r Initialization and runtime configuration ¦ r Function and class methods for C++ only: ¦ r TAU_PROFILE(name, type, group); Template ¦ r TAU_PROFILE_INIT(argc, argv); TAU_PROFILE_SET_NODE(my. Node); TAU_PROFILE_SET_CONTEXT(my. Context); TAU_PROFILE_EXIT(message); TAU_REGISTER_THREAD(); TAU_TYPE_STRING(variable, type); TAU_PROFILE(name, type, group); CT(variable); User-defined timing ¦ TAU_PROFILE_TIMER(timer, name, type, group); TAU_PROFILE_START(timer); TAU_PROFILE_STOP(timer); The TAU Performance System 22 TAU Tutorial ORNL Mar. 8, 2005

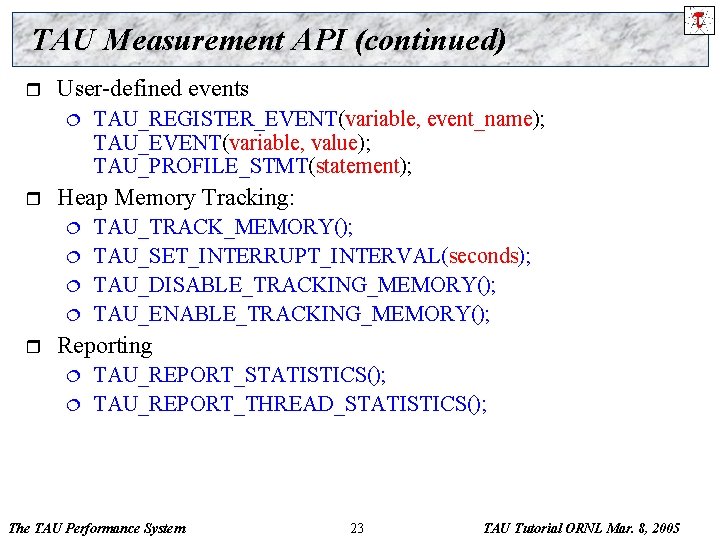
TAU Measurement API (continued) r User-defined events ¦ r Heap Memory Tracking: ¦ ¦ r TAU_REGISTER_EVENT(variable, event_name); TAU_EVENT(variable, value); TAU_PROFILE_STMT(statement); TAU_TRACK_MEMORY(); TAU_SET_INTERRUPT_INTERVAL(seconds); TAU_DISABLE_TRACKING_MEMORY(); TAU_ENABLE_TRACKING_MEMORY(); Reporting ¦ ¦ TAU_REPORT_STATISTICS(); TAU_REPORT_THREAD_STATISTICS(); The TAU Performance System 23 TAU Tutorial ORNL Mar. 8, 2005

Manual Instrumentation – C++ Example #include <TAU. h> int main(int argc, char **argv) { TAU_PROFILE(“int main(int, char **)”, “ ”, TAU_DEFAULT); TAU_PROFILE_INIT(argc, argv); TAU_PROFILE_SET_NODE(0); /* for sequential programs */ foo(); return 0; } int foo(void) { TAU_PROFILE(“int foo(void)”, “ ”, TAU_DEFAULT); // measures entire foo() TAU_PROFILE_TIMER(t, “foo(): for loop”, “[23: 45 file. cpp]”, TAU_USER); TAU_PROFILE_START(t); for(int i = 0; i < N ; i++){ work(i); } TAU_PROFILE_STOP(t); // other statements in foo … } The TAU Performance System 24 TAU Tutorial ORNL Mar. 8, 2005

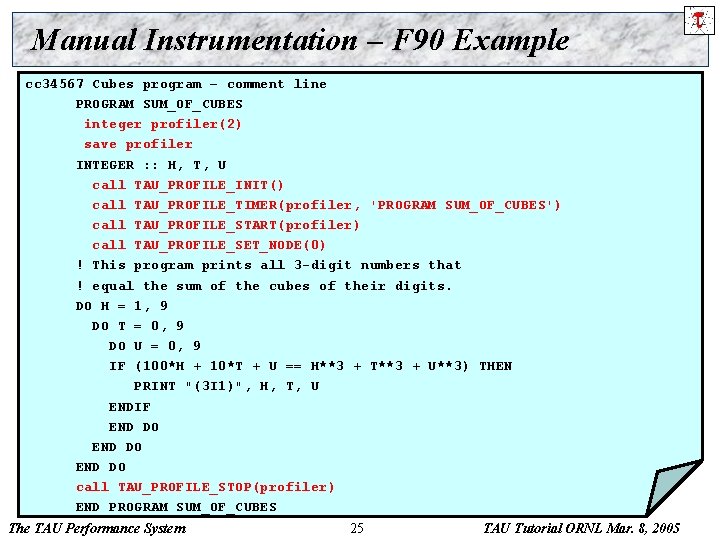
Manual Instrumentation – F 90 Example cc 34567 Cubes program – comment line PROGRAM SUM_OF_CUBES integer profiler(2) save profiler INTEGER : : H, T, U call TAU_PROFILE_INIT() call TAU_PROFILE_TIMER(profiler, 'PROGRAM SUM_OF_CUBES') call TAU_PROFILE_START(profiler) call TAU_PROFILE_SET_NODE(0) ! This program prints all 3 -digit numbers that ! equal the sum of the cubes of their digits. DO H = 1, 9 DO T = 0, 9 DO U = 0, 9 IF (100*H + 10*T + U == H**3 + T**3 + U**3) THEN PRINT "(3 I 1)", H, T, U ENDIF END DO call TAU_PROFILE_STOP(profiler) END PROGRAM SUM_OF_CUBES The TAU Performance System 25 TAU Tutorial ORNL Mar. 8, 2005
![Compiling configure options make clean install Creates archlibMakefile tauoptions stub Makefile and Compiling % configure [options] % make clean install Creates <arch>/lib/Makefile. tau<options> stub Makefile and](https://slidetodoc.com/presentation_image_h2/fd210204103b913623bfa6bc29bb02ec/image-26.jpg)
Compiling % configure [options] % make clean install Creates <arch>/lib/Makefile. tau<options> stub Makefile and <arch>/lib. Tau<options>. a [. so] libraries which defines a single configuration of TAU The TAU Performance System 26 TAU Tutorial ORNL Mar. 8, 2005

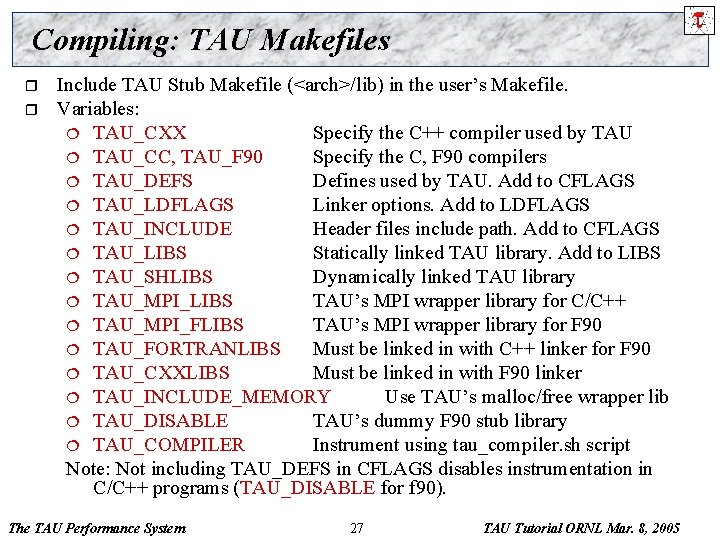
Compiling: TAU Makefiles r r Include TAU Stub Makefile (<arch>/lib) in the user’s Makefile. Variables: ¦ TAU_CXX Specify the C++ compiler used by TAU ¦ TAU_CC, TAU_F 90 Specify the C, F 90 compilers ¦ TAU_DEFS Defines used by TAU. Add to CFLAGS ¦ TAU_LDFLAGS Linker options. Add to LDFLAGS ¦ TAU_INCLUDE Header files include path. Add to CFLAGS ¦ TAU_LIBS Statically linked TAU library. Add to LIBS ¦ TAU_SHLIBS Dynamically linked TAU library ¦ TAU_MPI_LIBS TAU’s MPI wrapper library for C/C++ ¦ TAU_MPI_FLIBS TAU’s MPI wrapper library for F 90 ¦ TAU_FORTRANLIBS Must be linked in with C++ linker for F 90 ¦ TAU_CXXLIBS Must be linked in with F 90 linker ¦ TAU_INCLUDE_MEMORY Use TAU’s malloc/free wrapper lib ¦ TAU_DISABLE TAU’s dummy F 90 stub library ¦ TAU_COMPILER Instrument using tau_compiler. sh script Note: Not including TAU_DEFS in CFLAGS disables instrumentation in C/C++ programs (TAU_DISABLE for f 90). The TAU Performance System 27 TAU Tutorial ORNL Mar. 8, 2005

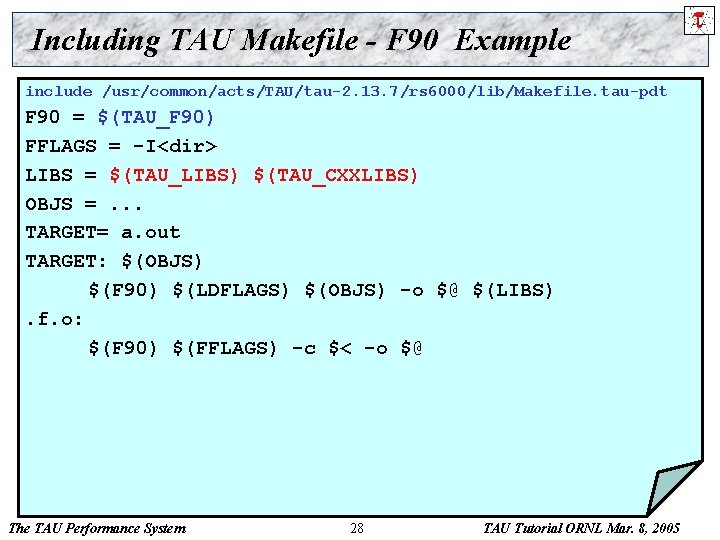
Including TAU Makefile - F 90 Example include /usr/common/acts/TAU/tau-2. 13. 7/rs 6000/lib/Makefile. tau-pdt F 90 = $(TAU_F 90) FFLAGS = -I<dir> LIBS = $(TAU_LIBS) $(TAU_CXXLIBS) OBJS =. . . TARGET= a. out TARGET: $(OBJS) $(F 90) $(LDFLAGS) $(OBJS) -o $@ $(LIBS). f. o: $(F 90) $(FFLAGS) -c $< -o $@ The TAU Performance System 28 TAU Tutorial ORNL Mar. 8, 2005

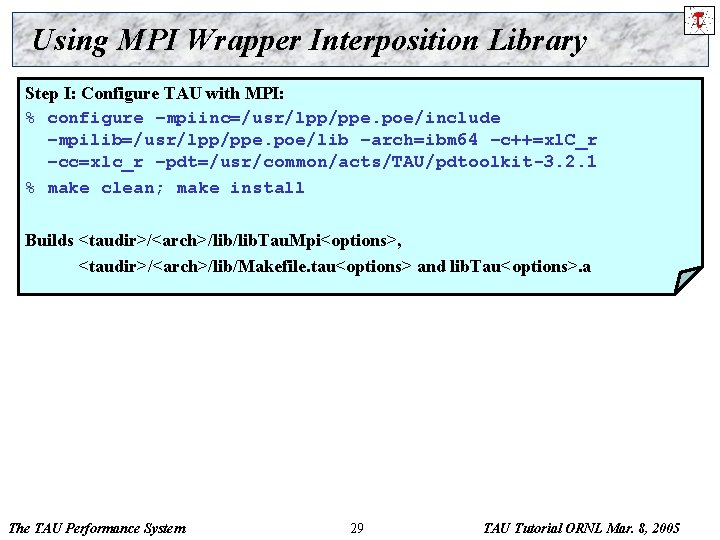
Using MPI Wrapper Interposition Library Step I: Configure TAU with MPI: % configure –mpiinc=/usr/lpp/ppe. poe/include –mpilib=/usr/lpp/ppe. poe/lib –arch=ibm 64 –c++=xl. C_r –cc=xlc_r –pdt=/usr/common/acts/TAU/pdtoolkit-3. 2. 1 % make clean; make install Builds <taudir>/<arch>/lib. Tau. Mpi<options>, <taudir>/<arch>/lib/Makefile. tau<options> and lib. Tau<options>. a The TAU Performance System 29 TAU Tutorial ORNL Mar. 8, 2005

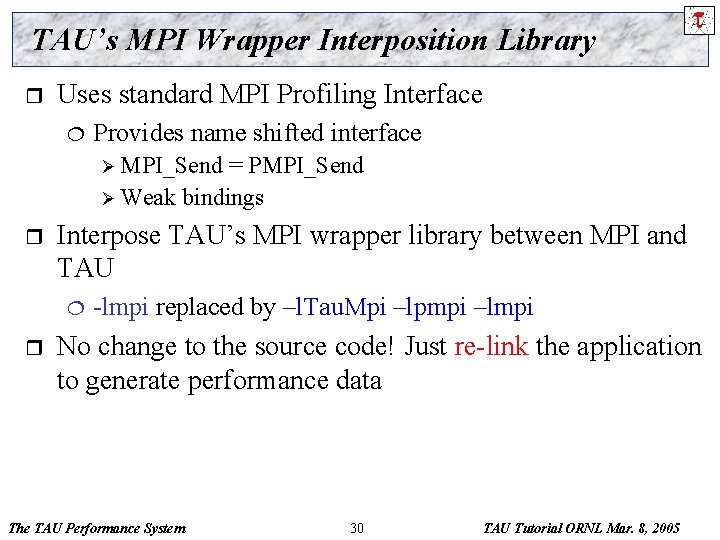
TAU’s MPI Wrapper Interposition Library r Uses standard MPI Profiling Interface ¦ Provides name shifted interface Ø MPI_Send = PMPI_Send Ø Weak bindings r Interpose TAU’s MPI wrapper library between MPI and TAU ¦ r -lmpi replaced by –l. Tau. Mpi –lpmpi –lmpi No change to the source code! Just re-link the application to generate performance data The TAU Performance System 30 TAU Tutorial ORNL Mar. 8, 2005

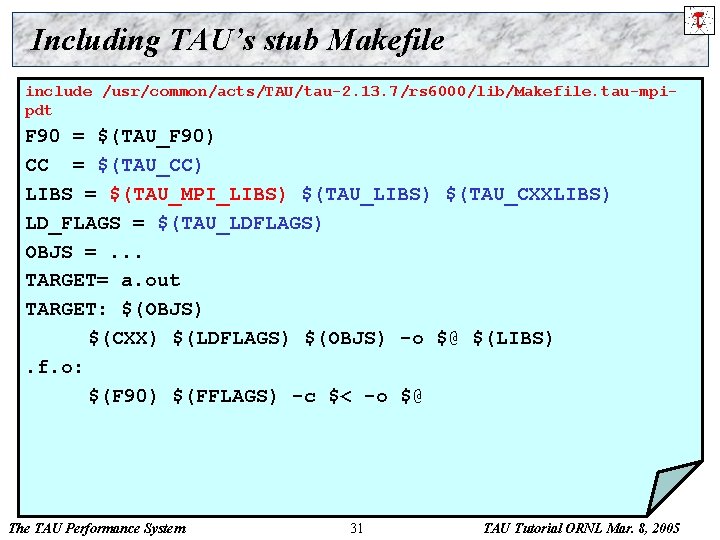
Including TAU’s stub Makefile include /usr/common/acts/TAU/tau-2. 13. 7/rs 6000/lib/Makefile. tau-mpipdt F 90 = $(TAU_F 90) CC = $(TAU_CC) LIBS = $(TAU_MPI_LIBS) $(TAU_CXXLIBS) LD_FLAGS = $(TAU_LDFLAGS) OBJS =. . . TARGET= a. out TARGET: $(OBJS) $(CXX) $(LDFLAGS) $(OBJS) -o $@ $(LIBS). f. o: $(F 90) $(FFLAGS) -c $< -o $@ The TAU Performance System 31 TAU Tutorial ORNL Mar. 8, 2005

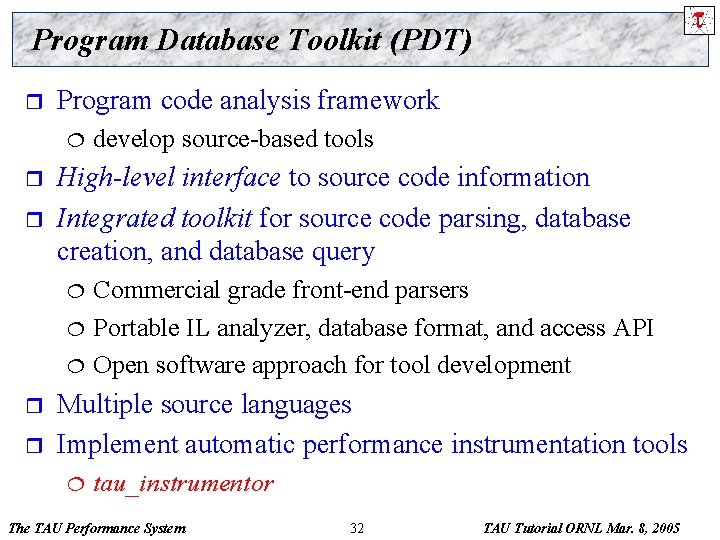
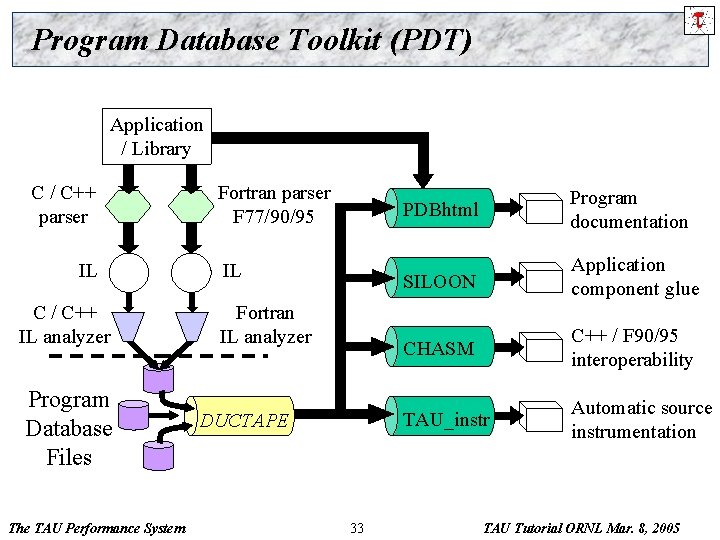
Program Database Toolkit (PDT) r Program code analysis framework ¦ r r High-level interface to source code information Integrated toolkit for source code parsing, database creation, and database query ¦ ¦ ¦ r r develop source-based tools Commercial grade front-end parsers Portable IL analyzer, database format, and access API Open software approach for tool development Multiple source languages Implement automatic performance instrumentation tools ¦ tau_instrumentor The TAU Performance System 32 TAU Tutorial ORNL Mar. 8, 2005

Program Database Toolkit (PDT) Application / Library C / C++ parser IL C / C++ IL analyzer Program Database Files The TAU Performance System Fortran parser F 77/90/95 IL Fortran IL analyzer DUCTAPE 33 PDBhtml Program documentation SILOON Application component glue CHASM C++ / F 90/95 interoperability TAU_instr Automatic source instrumentation TAU Tutorial ORNL Mar. 8, 2005

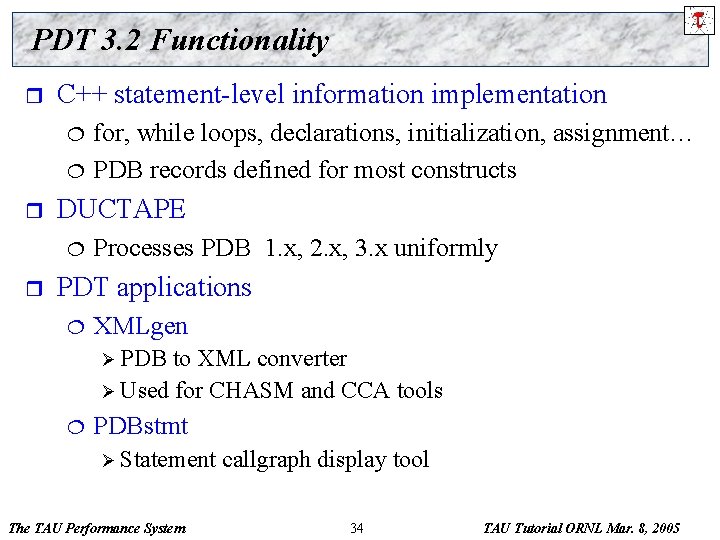
PDT 3. 2 Functionality r C++ statement-level information implementation ¦ ¦ r DUCTAPE ¦ r for, while loops, declarations, initialization, assignment… PDB records defined for most constructs Processes PDB 1. x, 2. x, 3. x uniformly PDT applications ¦ XMLgen Ø PDB to XML converter Ø Used for CHASM and CCA tools ¦ PDBstmt Ø Statement The TAU Performance System callgraph display tool 34 TAU Tutorial ORNL Mar. 8, 2005

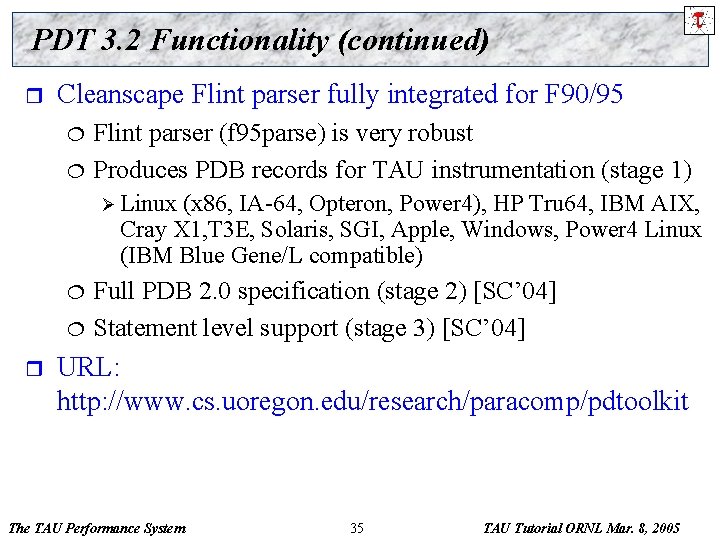
PDT 3. 2 Functionality (continued) r Cleanscape Flint parser fully integrated for F 90/95 ¦ ¦ Flint parser (f 95 parse) is very robust Produces PDB records for TAU instrumentation (stage 1) Ø Linux (x 86, IA-64, Opteron, Power 4), HP Tru 64, IBM AIX, Cray X 1, T 3 E, Solaris, SGI, Apple, Windows, Power 4 Linux (IBM Blue Gene/L compatible) ¦ ¦ r Full PDB 2. 0 specification (stage 2) [SC’ 04] Statement level support (stage 3) [SC’ 04] URL: http: //www. cs. uoregon. edu/research/paracomp/pdtoolkit The TAU Performance System 35 TAU Tutorial ORNL Mar. 8, 2005

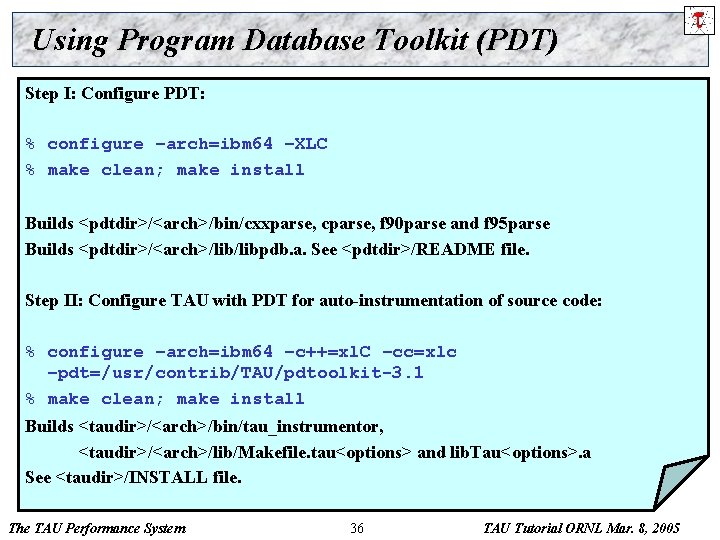
Using Program Database Toolkit (PDT) Step I: Configure PDT: % configure –arch=ibm 64 –XLC % make clean; make install Builds <pdtdir>/<arch>/bin/cxxparse, cparse, f 90 parse and f 95 parse Builds <pdtdir>/<arch>/libpdb. a. See <pdtdir>/README file. Step II: Configure TAU with PDT for auto-instrumentation of source code: % configure –arch=ibm 64 –c++=xl. C –cc=xlc –pdt=/usr/contrib/TAU/pdtoolkit-3. 1 % make clean; make install Builds <taudir>/<arch>/bin/tau_instrumentor, <taudir>/<arch>/lib/Makefile. tau<options> and lib. Tau<options>. a See <taudir>/INSTALL file. The TAU Performance System 36 TAU Tutorial ORNL Mar. 8, 2005

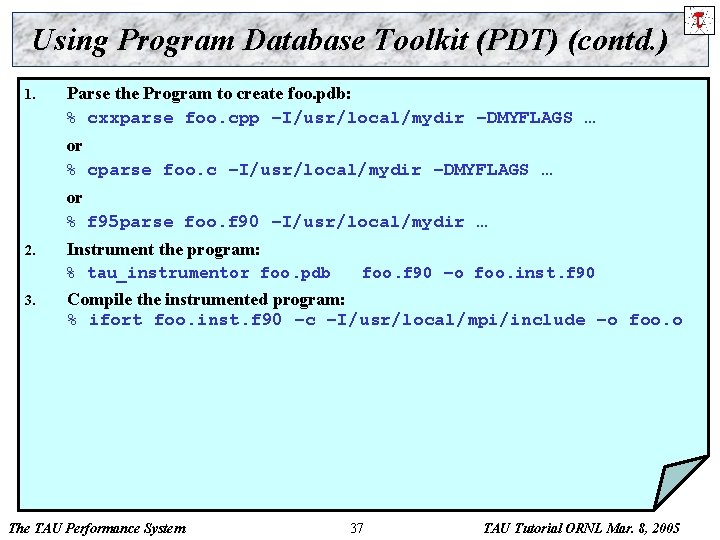
Using Program Database Toolkit (PDT) (contd. ) 1. Parse the Program to create foo. pdb: % cxxparse foo. cpp –I/usr/local/mydir –DMYFLAGS … or % cparse foo. c –I/usr/local/mydir –DMYFLAGS … or % f 95 parse foo. f 90 –I/usr/local/mydir … 2. Instrument the program: % tau_instrumentor foo. pdb 3. foo. f 90 –o foo. inst. f 90 Compile the instrumented program: % ifort foo. inst. f 90 –c –I/usr/local/mpi/include –o foo. o The TAU Performance System 37 TAU Tutorial ORNL Mar. 8, 2005

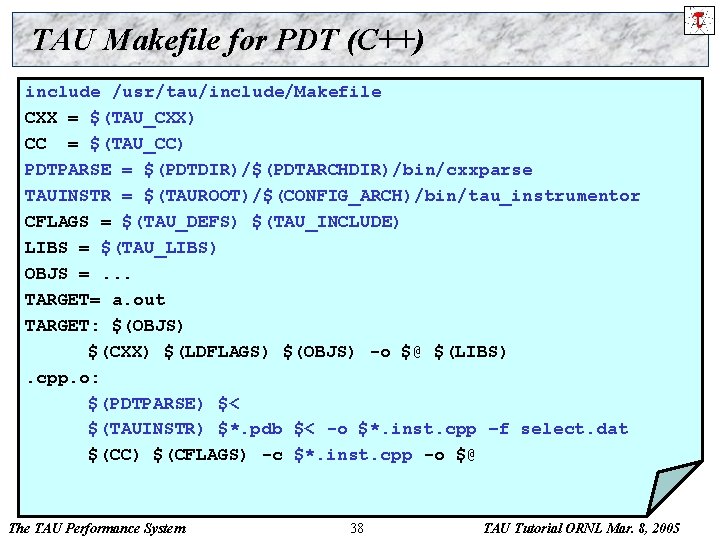
TAU Makefile for PDT (C++) include /usr/tau/include/Makefile CXX = $(TAU_CXX) CC = $(TAU_CC) PDTPARSE = $(PDTDIR)/$(PDTARCHDIR)/bin/cxxparse TAUINSTR = $(TAUROOT)/$(CONFIG_ARCH)/bin/tau_instrumentor CFLAGS = $(TAU_DEFS) $(TAU_INCLUDE) LIBS = $(TAU_LIBS) OBJS =. . . TARGET= a. out TARGET: $(OBJS) $(CXX) $(LDFLAGS) $(OBJS) -o $@ $(LIBS). cpp. o: $(PDTPARSE) $< $(TAUINSTR) $*. pdb $< -o $*. inst. cpp –f select. dat $(CC) $(CFLAGS) -c $*. inst. cpp -o $@ The TAU Performance System 38 TAU Tutorial ORNL Mar. 8, 2005

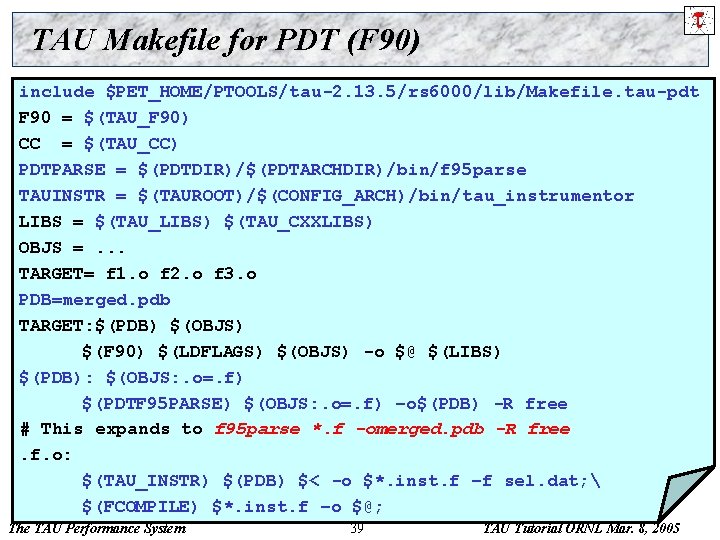
TAU Makefile for PDT (F 90) include $PET_HOME/PTOOLS/tau-2. 13. 5/rs 6000/lib/Makefile. tau-pdt F 90 = $(TAU_F 90) CC = $(TAU_CC) PDTPARSE = $(PDTDIR)/$(PDTARCHDIR)/bin/f 95 parse TAUINSTR = $(TAUROOT)/$(CONFIG_ARCH)/bin/tau_instrumentor LIBS = $(TAU_LIBS) $(TAU_CXXLIBS) OBJS =. . . TARGET= f 1. o f 2. o f 3. o PDB=merged. pdb TARGET: $(PDB) $(OBJS) $(F 90) $(LDFLAGS) $(OBJS) -o $@ $(LIBS) $(PDB): $(OBJS: . o=. f) $(PDTF 95 PARSE) $(OBJS: . o=. f) –o$(PDB) -R free # This expands to f 95 parse *. f -omerged. pdb -R free. f. o: $(TAU_INSTR) $(PDB) $< -o $*. inst. f –f sel. dat; $(FCOMPILE) $*. inst. f –o $@; The TAU Performance System 39 TAU Tutorial ORNL Mar. 8, 2005

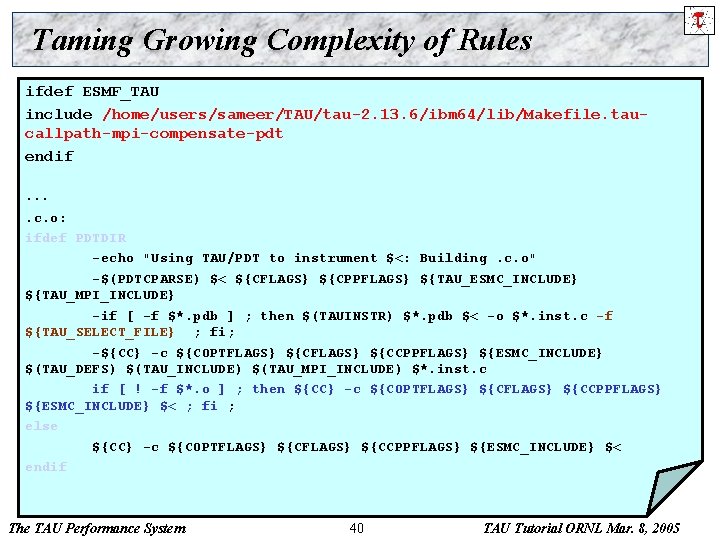
Taming Growing Complexity of Rules ifdef ESMF_TAU include /home/users/sameer/TAU/tau-2. 13. 6/ibm 64/lib/Makefile. taucallpath-mpi-compensate-pdt endif …. c. o: ifdef PDTDIR -echo "Using TAU/PDT to instrument $<: Building. c. o" -$(PDTCPARSE) $< ${CFLAGS} ${CPPFLAGS} ${TAU_ESMC_INCLUDE} ${TAU_MPI_INCLUDE} -if [ -f $*. pdb ] ; then $(TAUINSTR) $*. pdb $< -o $*. inst. c -f ${TAU_SELECT_FILE} ; fi; -${CC} -c ${COPTFLAGS} ${CCPPFLAGS} ${ESMC_INCLUDE} $(TAU_DEFS) $(TAU_INCLUDE) $(TAU_MPI_INCLUDE) $*. inst. c if [ ! -f $*. o ] ; then ${CC} -c ${COPTFLAGS} ${CCPPFLAGS} ${ESMC_INCLUDE} $< ; fi ; else ${CC} -c ${COPTFLAGS} ${CCPPFLAGS} ${ESMC_INCLUDE} $< endif The TAU Performance System 40 TAU Tutorial ORNL Mar. 8, 2005

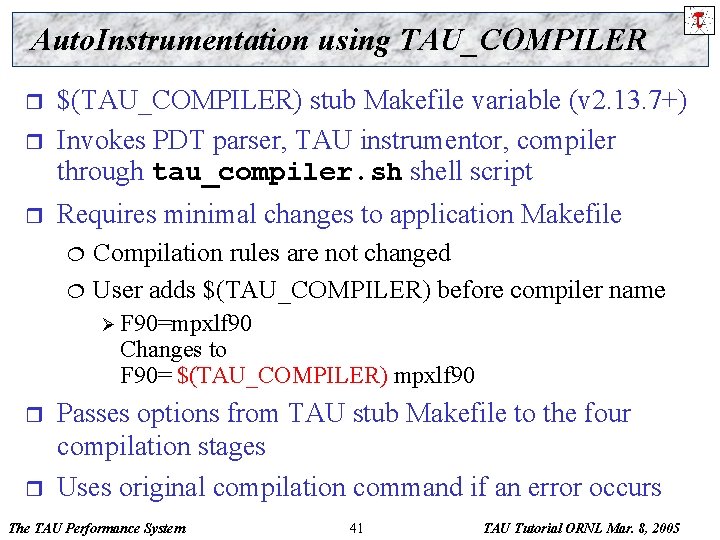
Auto. Instrumentation using TAU_COMPILER r $(TAU_COMPILER) stub Makefile variable (v 2. 13. 7+) Invokes PDT parser, TAU instrumentor, compiler through tau_compiler. sh shell script r Requires minimal changes to application Makefile r ¦ ¦ Compilation rules are not changed User adds $(TAU_COMPILER) before compiler name Ø F 90=mpxlf 90 Changes to F 90= $(TAU_COMPILER) mpxlf 90 r r Passes options from TAU stub Makefile to the four compilation stages Uses original compilation command if an error occurs The TAU Performance System 41 TAU Tutorial ORNL Mar. 8, 2005

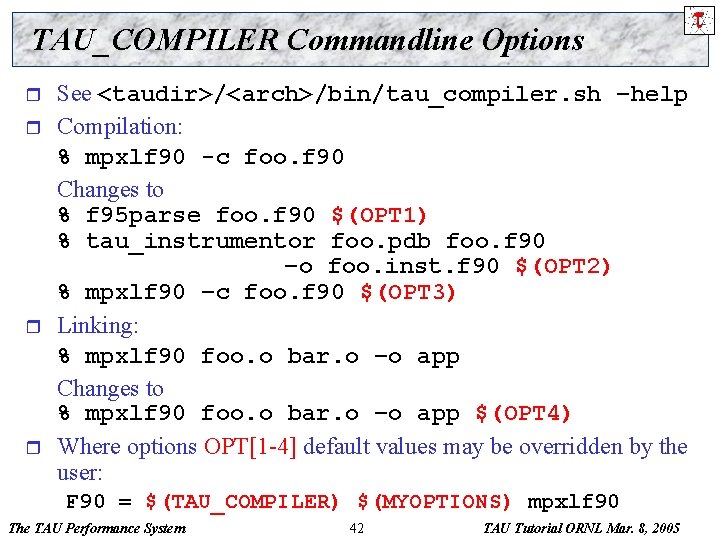
TAU_COMPILER Commandline Options r r See <taudir>/<arch>/bin/tau_compiler. sh –help Compilation: % mpxlf 90 -c foo. f 90 Changes to % f 95 parse foo. f 90 $(OPT 1) % tau_instrumentor foo. pdb foo. f 90 –o foo. inst. f 90 $(OPT 2) % mpxlf 90 –c foo. f 90 $(OPT 3) Linking: % mpxlf 90 foo. o bar. o –o app Changes to % mpxlf 90 foo. o bar. o –o app $(OPT 4) Where options OPT[1 -4] default values may be overridden by the user: F 90 = $(TAU_COMPILER) $(MYOPTIONS) mpxlf 90 The TAU Performance System 42 TAU Tutorial ORNL Mar. 8, 2005

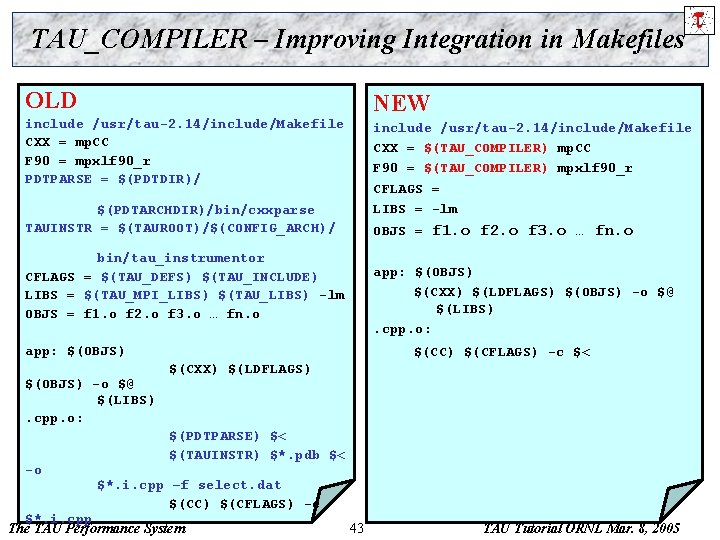
TAU_COMPILER – Improving Integration in Makefiles OLD NEW include /usr/tau-2. 14/include/Makefile CXX = mp. CC F 90 = mpxlf 90_r PDTPARSE = $(PDTDIR)/ include /usr/tau-2. 14/include/Makefile CXX = $(TAU_COMPILER) mp. CC F 90 = $(TAU_COMPILER) mpxlf 90_r CFLAGS = LIBS = -lm $(PDTARCHDIR)/bin/cxxparse TAUINSTR = $(TAUROOT)/$(CONFIG_ARCH)/ OBJS = f 1. o f 2. o f 3. o … fn. o bin/tau_instrumentor CFLAGS = $(TAU_DEFS) $(TAU_INCLUDE) LIBS = $(TAU_MPI_LIBS) $(TAU_LIBS) -lm OBJS = f 1. o f 2. o f 3. o … fn. o app: $(OBJS) $(CXX) $(LDFLAGS) $(OBJS) -o $@ $(LIBS). cpp. o: app: $(OBJS) -o $@ $(LIBS). cpp. o: -o $(CC) $(CFLAGS) -c $< $(CXX) $(LDFLAGS) $(PDTPARSE) $< $(TAUINSTR) $*. pdb $< $*. i. cpp –f select. dat $(CC) $(CFLAGS) -c $*. i. cpp The TAU Performance System 43 TAU Tutorial ORNL Mar. 8, 2005

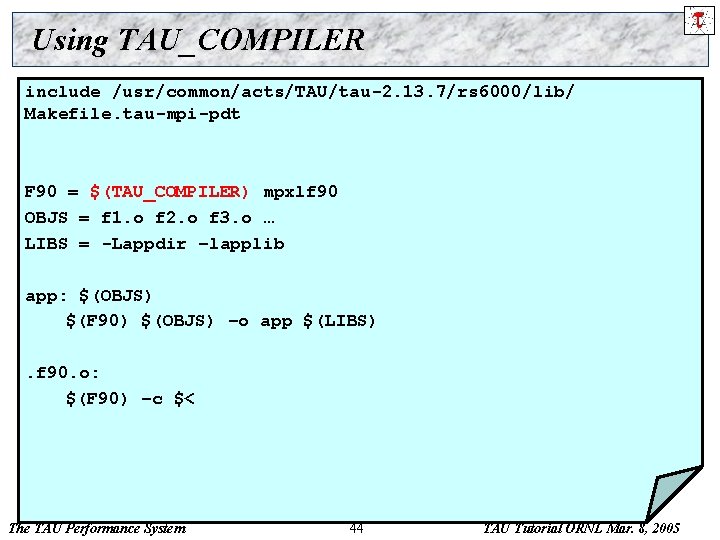
Using TAU_COMPILER include /usr/common/acts/TAU/tau-2. 13. 7/rs 6000/lib/ Makefile. tau-mpi-pdt F 90 = $(TAU_COMPILER) mpxlf 90 OBJS = f 1. o f 2. o f 3. o … LIBS = -Lappdir –lapplib app: $(OBJS) $(F 90) $(OBJS) –o app $(LIBS). f 90. o: $(F 90) –c $< The TAU Performance System 44 TAU Tutorial ORNL Mar. 8, 2005

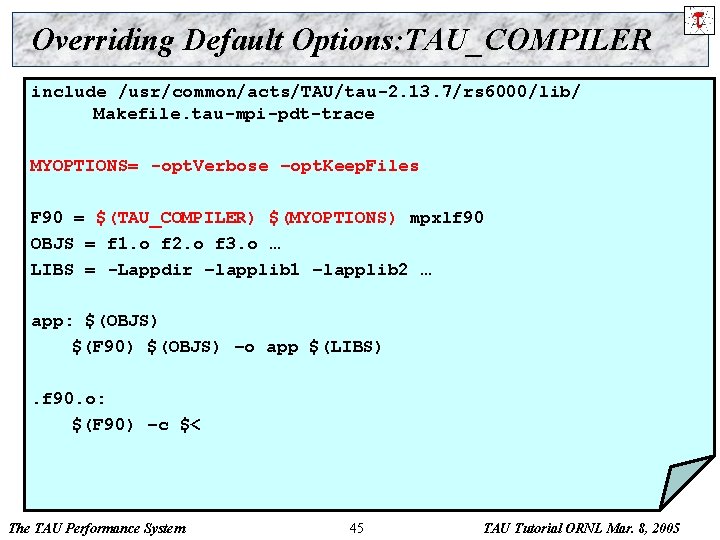
Overriding Default Options: TAU_COMPILER include /usr/common/acts/TAU/tau-2. 13. 7/rs 6000/lib/ Makefile. tau-mpi-pdt-trace MYOPTIONS= -opt. Verbose –opt. Keep. Files F 90 = $(TAU_COMPILER) $(MYOPTIONS) mpxlf 90 OBJS = f 1. o f 2. o f 3. o … LIBS = -Lappdir –lapplib 1 –lapplib 2 … app: $(OBJS) $(F 90) $(OBJS) –o app $(LIBS). f 90. o: $(F 90) –c $< The TAU Performance System 45 TAU Tutorial ORNL Mar. 8, 2005
![Using PDT tauinstrumentor tauinstrumentor Usage tauinstrumentor pdbfile sourcefile o outputfile noinline Using PDT: tau_instrumentor % tau_instrumentor Usage : tau_instrumentor <pdbfile> <sourcefile> [-o <outputfile>] [-noinline] [](https://slidetodoc.com/presentation_image_h2/fd210204103b913623bfa6bc29bb02ec/image-46.jpg)
Using PDT: tau_instrumentor % tau_instrumentor Usage : tau_instrumentor <pdbfile> <sourcefile> [-o <outputfile>] [-noinline] [ -g groupname] [-i headerfile] [-c|-c++|-fortran] [-f <instr_req_file> ] For selective instrumentation, use –f option % tau_instrumentor foo. pdb foo. cpp –o foo. inst. cpp –f selective. dat % cat selective. dat # Selective instrumentation: Specify an exclude/include list of routines/files. BEGIN_EXCLUDE_LIST void quicksort(int *, int) void sort_5 elements(int *) void interchange(int *, int *) END_EXCLUDE_LIST BEGIN_FILE_INCLUDE_LIST Main. cpp Foo? . c *. C END_FILE_INCLUDE_LIST # Instruments routines in Main. cpp, Foo? . c and *. C files only # Use BEGIN_[FILE]_INCLUDE_LIST with END_[FILE]_INCLUDE_LIST The TAU Performance System 46 TAU Tutorial ORNL Mar. 8, 2005

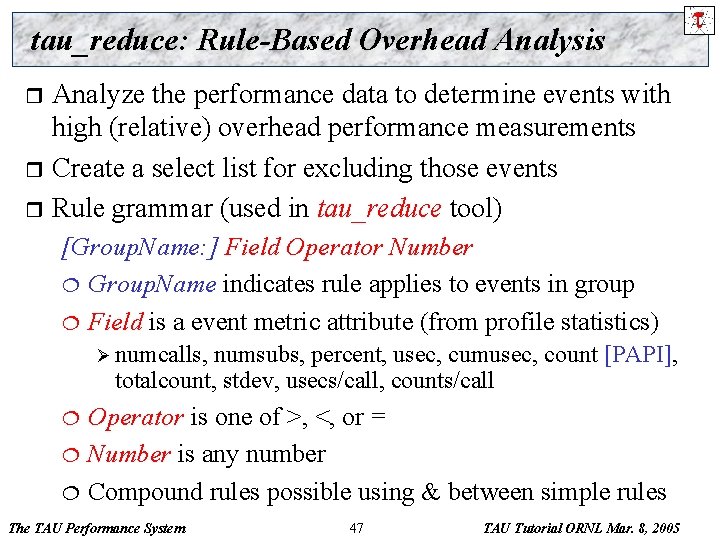
tau_reduce: Rule-Based Overhead Analysis Analyze the performance data to determine events with high (relative) overhead performance measurements r Create a select list for excluding those events r Rule grammar (used in tau_reduce tool) r [Group. Name: ] Field Operator Number ¦ Group. Name indicates rule applies to events in group ¦ Field is a event metric attribute (from profile statistics) Ø numcalls, numsubs, percent, usec, cumusec, count [PAPI], totalcount, stdev, usecs/call, counts/call Operator is one of >, <, or = ¦ Number is any number ¦ Compound rules possible using & between simple rules ¦ The TAU Performance System 47 TAU Tutorial ORNL Mar. 8, 2005

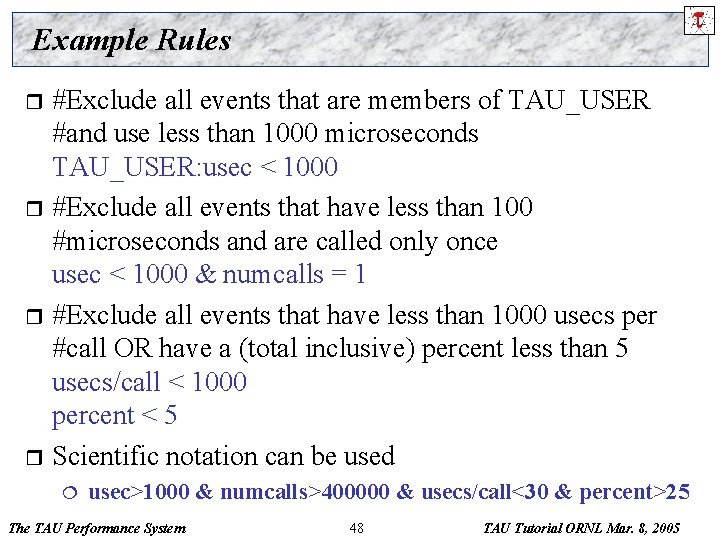
Example Rules #Exclude all events that are members of TAU_USER #and use less than 1000 microseconds TAU_USER: usec < 1000 r #Exclude all events that have less than 100 #microseconds and are called only once usec < 1000 & numcalls = 1 r #Exclude all events that have less than 1000 usecs per #call OR have a (total inclusive) percent less than 5 usecs/call < 1000 percent < 5 r Scientific notation can be used r ¦ usec>1000 & numcalls>400000 & usecs/call<30 & percent>25 The TAU Performance System 48 TAU Tutorial ORNL Mar. 8, 2005

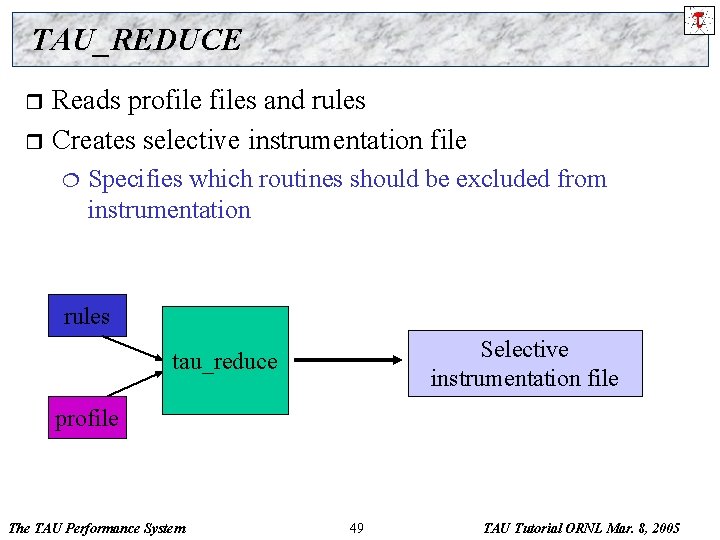
TAU_REDUCE Reads profiles and rules r Creates selective instrumentation file r ¦ Specifies which routines should be excluded from instrumentation rules Selective instrumentation file tau_reduce profile The TAU Performance System 49 TAU Tutorial ORNL Mar. 8, 2005

Using TAU – A tutorial r r Configuration Instrumentation ¦ ¦ ¦ Manual MPI – Wrapper interposition library PDT- Source rewriting for C, C++, F 77/90/95 Open. MP – Directive rewriting Component based instrumentation – Proxy components Binary Instrumentation Dyninst. API – Runtime Instrumentation/Rewriting binary Ø Java – Runtime instrumentation Ø Python – Runtime instrumentation Ø r r Measurement Performance Analysis The TAU Performance System 50 TAU Tutorial ORNL Mar. 8, 2005
![Using Opari with TAU Step I Configure KOJAKopari Download from http www fzjuelich dezamkojak Using Opari with TAU Step I: Configure KOJAK/opari [Download from http: //www. fz-juelich. de/zam/kojak/]](https://slidetodoc.com/presentation_image_h2/fd210204103b913623bfa6bc29bb02ec/image-51.jpg)
Using Opari with TAU Step I: Configure KOJAK/opari [Download from http: //www. fz-juelich. de/zam/kojak/] % cd kojak-1. 0; cp mf/Makefile. defs. ibm Makefile. defs; edit Makefile % make Builds opari Step II: Configure TAU with Opari (used here with MPI and PDT) % configure –opari=/usr/contrib/TAU/kojak-1. 0/opari -mpiinc=/usr/lpp/ppe. poe/include –mpilib=/usr/lpp/ppe. poe/lib –pdt=/usr/contrib/TAU/pdtoolkit-3. 2. 1 % make clean; make install The TAU Performance System 51 TAU Tutorial ORNL Mar. 8, 2005

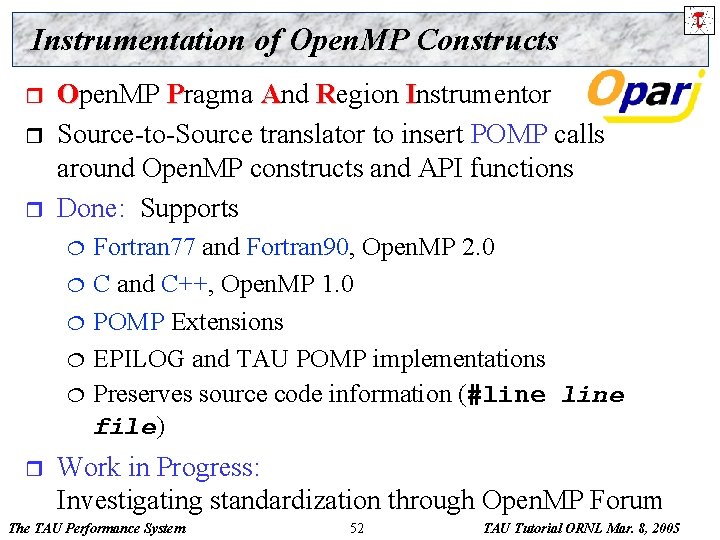
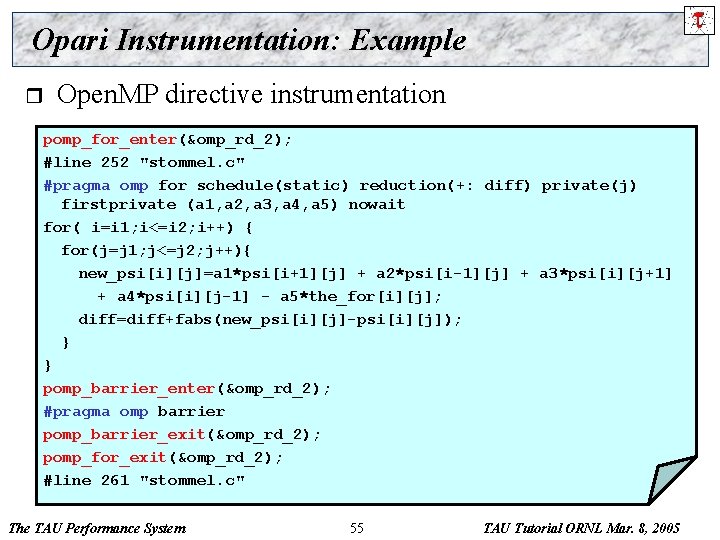
Instrumentation of Open. MP Constructs r r r Open. MP Pragma And Region Instrumentor Source-to-Source translator to insert POMP calls around Open. MP constructs and API functions Done: Supports ¦ ¦ ¦ r Fortran 77 and Fortran 90, Open. MP 2. 0 C and C++, Open. MP 1. 0 POMP Extensions EPILOG and TAU POMP implementations Preserves source code information (#line file) Work in Progress: Investigating standardization through Open. MP Forum The TAU Performance System 52 TAU Tutorial ORNL Mar. 8, 2005

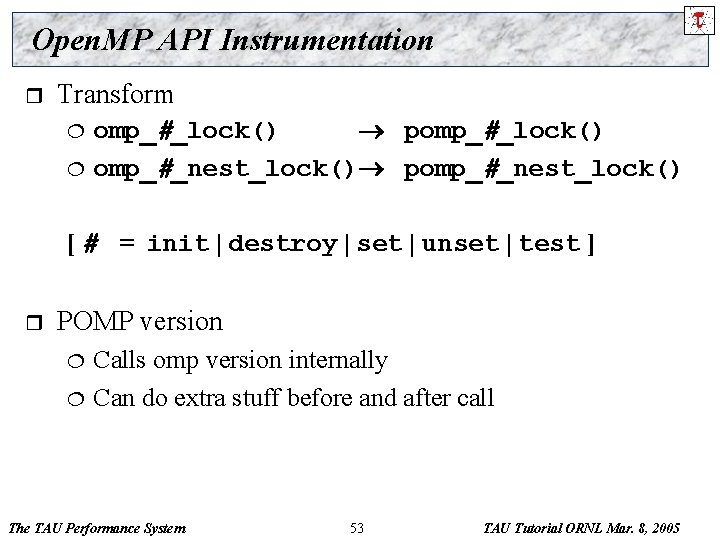
Open. MP API Instrumentation r Transform ¦ ¦ omp_#_lock() pomp_#_lock() omp_#_nest_lock() pomp_#_nest_lock() [ # = init | destroy | set | unset | test ] r POMP version ¦ ¦ Calls omp version internally Can do extra stuff before and after call The TAU Performance System 53 TAU Tutorial ORNL Mar. 8, 2005

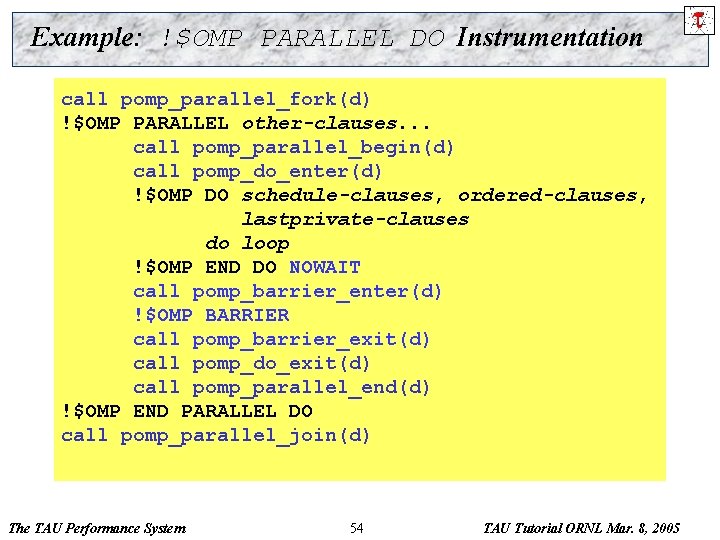
Example: !$OMP PARALLEL DO Instrumentation call pomp_parallel_fork(d) !$OMP PARALLEL DO other-clauses. . . call pomp_parallel_begin(d) call pomp_do_enter(d) !$OMP DO schedule-clauses, ordered-clauses, lastprivate-clauses do loop !$OMP END DO NOWAIT call pomp_barrier_enter(d) !$OMP BARRIER call pomp_barrier_exit(d) call pomp_do_exit(d) call pomp_parallel_end(d) !$OMP END PARALLEL DO call pomp_parallel_join(d) The TAU Performance System 54 TAU Tutorial ORNL Mar. 8, 2005

Opari Instrumentation: Example r Open. MP directive instrumentation pomp_for_enter(&omp_rd_2); #line 252 "stommel. c" #pragma omp for schedule(static) reduction(+: diff) private(j) firstprivate (a 1, a 2, a 3, a 4, a 5) nowait for( i=i 1; i<=i 2; i++) { for(j=j 1; j<=j 2; j++){ new_psi[i][j]=a 1*psi[i+1][j] + a 2*psi[i-1][j] + a 3*psi[i][j+1] + a 4*psi[i][j-1] - a 5*the_for[i][j]; diff=diff+fabs(new_psi[i][j]-psi[i][j]); } } pomp_barrier_enter(&omp_rd_2); #pragma omp barrier pomp_barrier_exit(&omp_rd_2); pomp_for_exit(&omp_rd_2); #line 261 "stommel. c" The TAU Performance System 55 TAU Tutorial ORNL Mar. 8, 2005

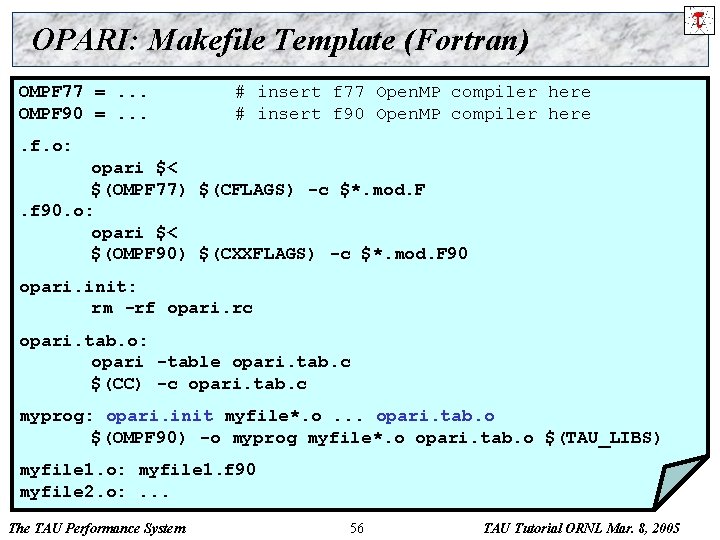
OPARI: Makefile Template (Fortran) OMPF 77 =. . . OMPF 90 =. . . # insert f 77 Open. MP compiler here # insert f 90 Open. MP compiler here . f. o: opari $< $(OMPF 77) $(CFLAGS) -c $*. mod. F. f 90. o: opari $< $(OMPF 90) $(CXXFLAGS) -c $*. mod. F 90 opari. init: rm -rf opari. rc opari. tab. o: opari -table opari. tab. c $(CC) -c opari. tab. c myprog: opari. init myfile*. o. . . opari. tab. o $(OMPF 90) -o myprog myfile*. o opari. tab. o $(TAU_LIBS) myfile 1. o: myfile 1. f 90 myfile 2. o: . . . The TAU Performance System 56 TAU Tutorial ORNL Mar. 8, 2005
![CCA Performance Observation Component Common Component Architecture for Scientific Components www ccaforum org r CCA Performance Observation Component Common Component Architecture for Scientific Components [www. cca-forum. org] r](https://slidetodoc.com/presentation_image_h2/fd210204103b913623bfa6bc29bb02ec/image-57.jpg)
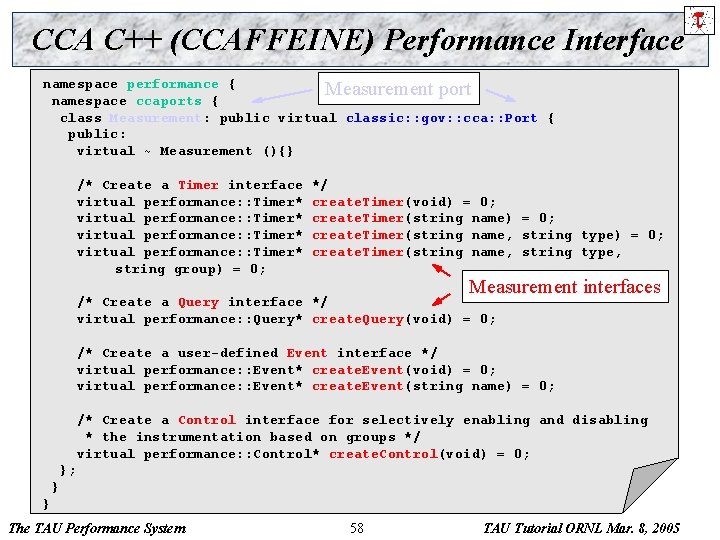
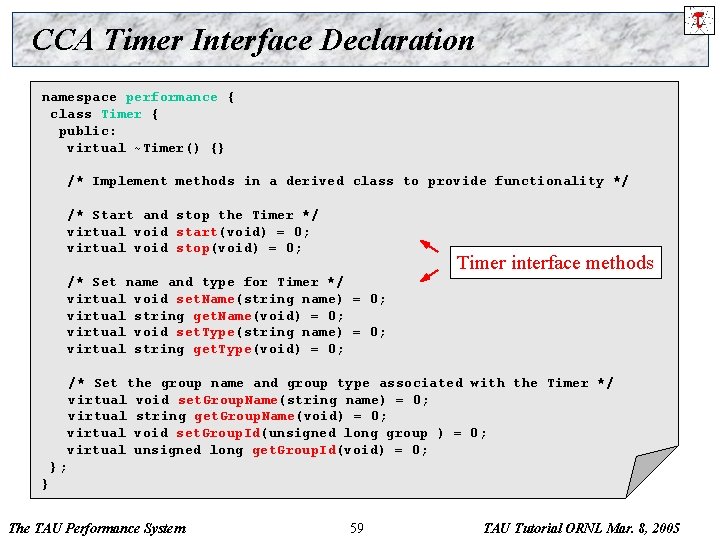
CCA Performance Observation Component Common Component Architecture for Scientific Components [www. cca-forum. org] r Design measurement port and measurement interfaces r ¦ Timer Ø start/stop Ø set ¦ name/type/group Control Ø enable/disable ¦ groups Query Ø get timer names Ø metrics, counters, dump to disk ¦ Event Ø user-defined The TAU Performance System events 57 TAU Tutorial ORNL Mar. 8, 2005

CCA C++ (CCAFFEINE) Performance Interface namespace performance { Measurement port namespace ccaports { class Measurement: public virtual classic: : gov: : cca: : Port { public: virtual ~ Measurement (){} /* Create a Timer interface virtual performance: : Timer* string group) = 0; */ create. Timer(void) = 0; create. Timer(string name, string type) = 0; create. Timer(string name, string type, Measurement interfaces /* Create a Query interface */ virtual performance: : Query* create. Query(void) = 0; /* Create a user-defined Event interface */ virtual performance: : Event* create. Event(void) = 0; virtual performance: : Event* create. Event(string name) = 0; /* Create a Control interface for selectively enabling and disabling * the instrumentation based on groups */ virtual performance: : Control* create. Control(void) = 0; }; } } The TAU Performance System 58 TAU Tutorial ORNL Mar. 8, 2005

CCA Timer Interface Declaration namespace performance { class Timer { public: virtual ~Timer() {} /* Implement methods in a derived class to provide functionality */ /* Start and stop the Timer */ virtual void start(void) = 0; virtual void stop(void) = 0; Timer interface methods /* Set name and type for Timer */ virtual void set. Name(string name) = 0; virtual string get. Name(void) = 0; virtual void set. Type(string name) = 0; virtual string get. Type(void) = 0; /* Set the group name and group type associated with the Timer */ virtual void set. Group. Name(string name) = 0; virtual string get. Group. Name(void) = 0; virtual void set. Group. Id(unsigned long group ) = 0; virtual unsigned long get. Group. Id(void) = 0; }; } The TAU Performance System 59 TAU Tutorial ORNL Mar. 8, 2005

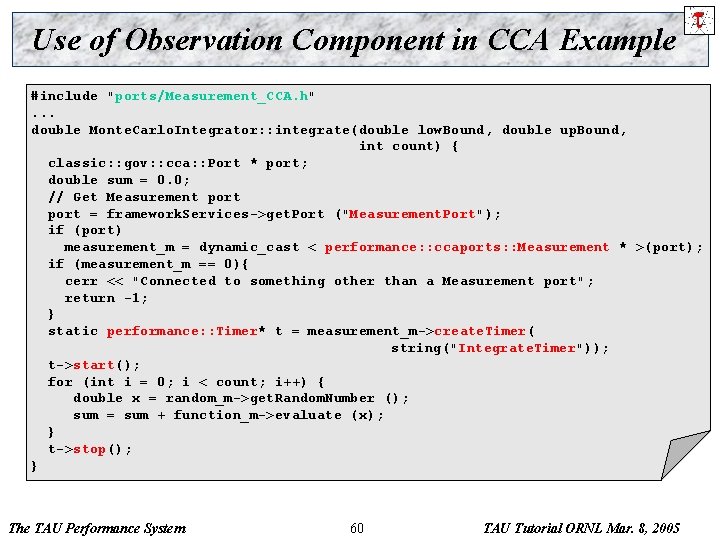
Use of Observation Component in CCA Example #include "ports/Measurement_CCA. h". . . double Monte. Carlo. Integrator: : integrate(double low. Bound, double up. Bound, int count) { classic: : gov: : cca: : Port * port; double sum = 0. 0; // Get Measurement port = framework. Services->get. Port ("Measurement. Port"); if (port) measurement_m = dynamic_cast < performance: : ccaports: : Measurement * >(port); if (measurement_m == 0){ cerr << "Connected to something other than a Measurement port"; return -1; } static performance: : Timer* t = measurement_m->create. Timer( string("Integrate. Timer")); t->start(); for (int i = 0; i < count; i++) { double x = random_m->get. Random. Number (); sum = sum + function_m->evaluate (x); } t->stop(); } The TAU Performance System 60 TAU Tutorial ORNL Mar. 8, 2005
![Using TAU Component in ESMFCCA S Zhou The TAU Performance System 61 TAU Tutorial Using TAU Component in ESMF/CCA [S. Zhou] The TAU Performance System 61 TAU Tutorial](https://slidetodoc.com/presentation_image_h2/fd210204103b913623bfa6bc29bb02ec/image-61.jpg)
Using TAU Component in ESMF/CCA [S. Zhou] The TAU Performance System 61 TAU Tutorial ORNL Mar. 8, 2005

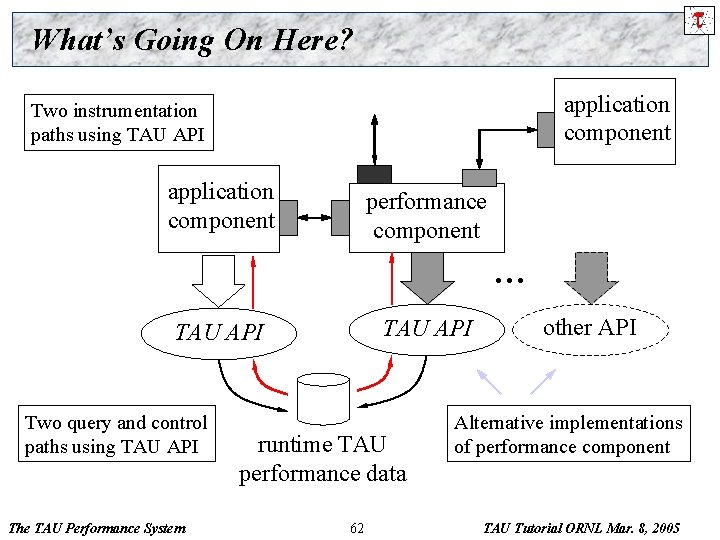
What’s Going On Here? application component Two instrumentation paths using TAU API application component performance component … TAU API Two query and control paths using TAU API The TAU Performance System runtime TAU performance data 62 other API Alternative implementations of performance component TAU Tutorial ORNL Mar. 8, 2005

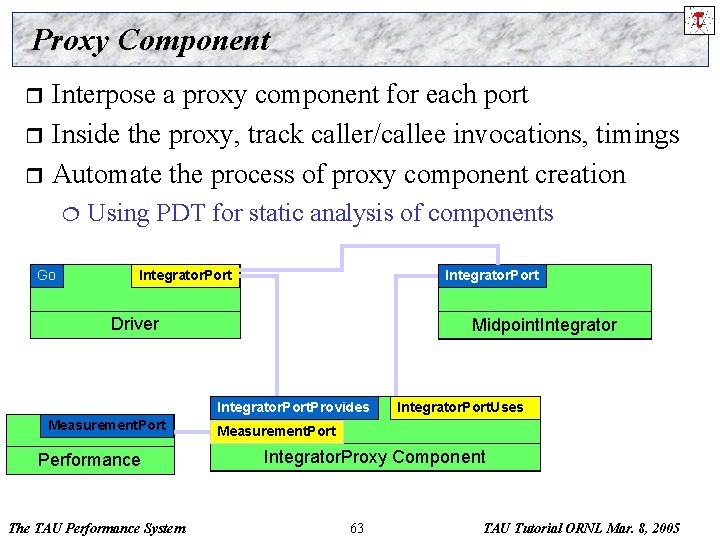
Proxy Component Interpose a proxy component for each port r Inside the proxy, track caller/callee invocations, timings r Automate the process of proxy component creation r ¦ Go Using PDT for static analysis of components Integrator. Port Driver Midpoint. Integrator. Port. Provides Measurement. Port Performance The TAU Performance System Integrator. Port. Uses Measurement. Port Integrator. Proxy Component 63 TAU Tutorial ORNL Mar. 8, 2005

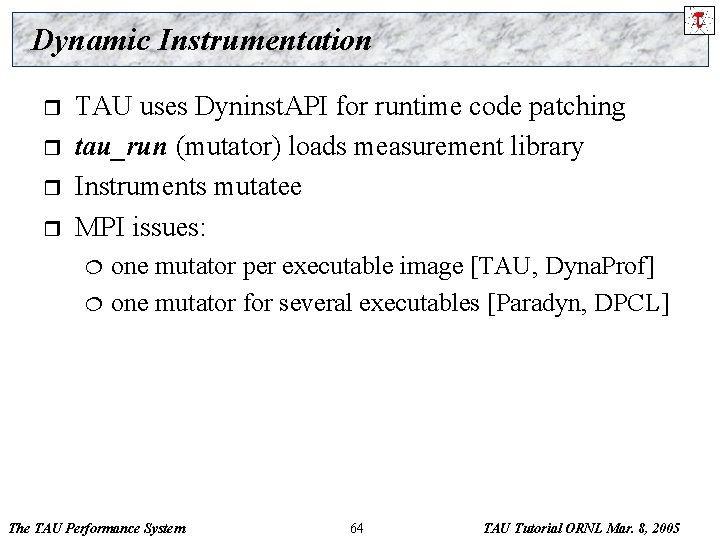
Dynamic Instrumentation r r TAU uses Dyninst. API for runtime code patching tau_run (mutator) loads measurement library Instruments mutatee MPI issues: ¦ ¦ one mutator per executable image [TAU, Dyna. Prof] one mutator for several executables [Paradyn, DPCL] The TAU Performance System 64 TAU Tutorial ORNL Mar. 8, 2005

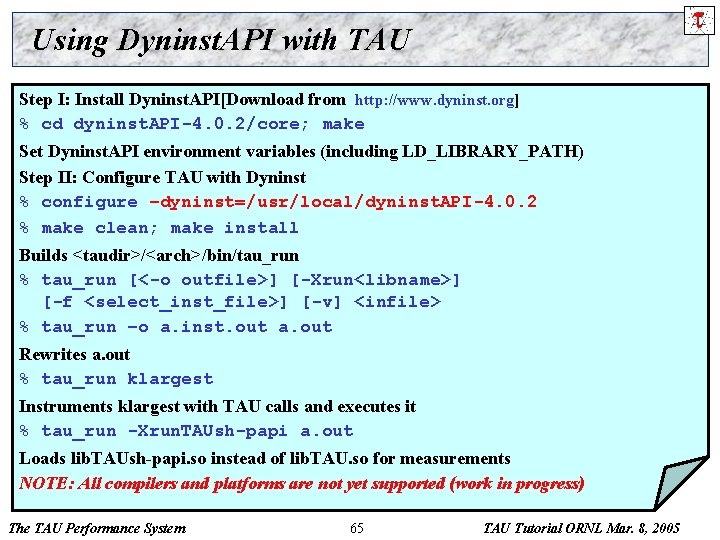
Using Dyninst. API with TAU Step I: Install Dyninst. API[Download from http: //www. dyninst. org] % cd dyninst. API-4. 0. 2/core; make Set Dyninst. API environment variables (including LD_LIBRARY_PATH) Step II: Configure TAU with Dyninst % configure –dyninst=/usr/local/dyninst. API-4. 0. 2 % make clean; make install Builds <taudir>/<arch>/bin/tau_run % tau_run [<-o outfile>] [-Xrun<libname>] [-f <select_inst_file>] [-v] <infile> % tau_run –o a. inst. out a. out Rewrites a. out % tau_run klargest Instruments klargest with TAU calls and executes it % tau_run -Xrun. TAUsh-papi a. out Loads lib. TAUsh-papi. so instead of lib. TAU. so for measurements NOTE: All compilers and platforms are not yet supported (work in progress) The TAU Performance System 65 TAU Tutorial ORNL Mar. 8, 2005

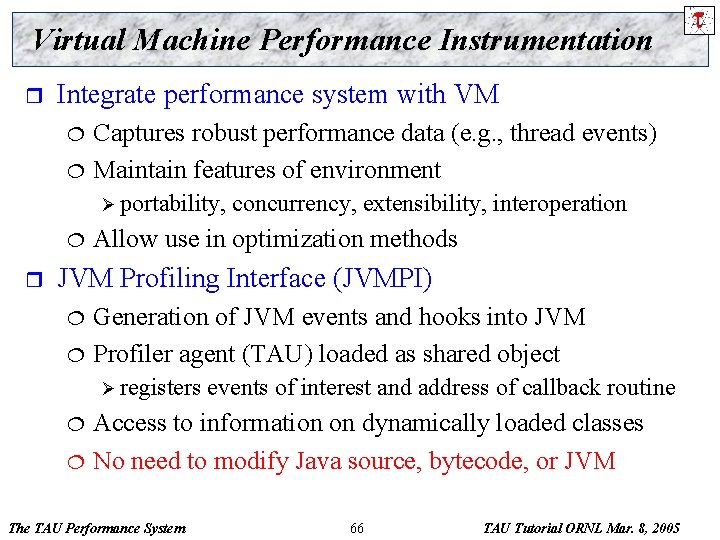
Virtual Machine Performance Instrumentation r Integrate performance system with VM ¦ ¦ Captures robust performance data (e. g. , thread events) Maintain features of environment Ø portability, ¦ r concurrency, extensibility, interoperation Allow use in optimization methods JVM Profiling Interface (JVMPI) ¦ ¦ Generation of JVM events and hooks into JVM Profiler agent (TAU) loaded as shared object Ø registers ¦ ¦ events of interest and address of callback routine Access to information on dynamically loaded classes No need to modify Java source, bytecode, or JVM The TAU Performance System 66 TAU Tutorial ORNL Mar. 8, 2005

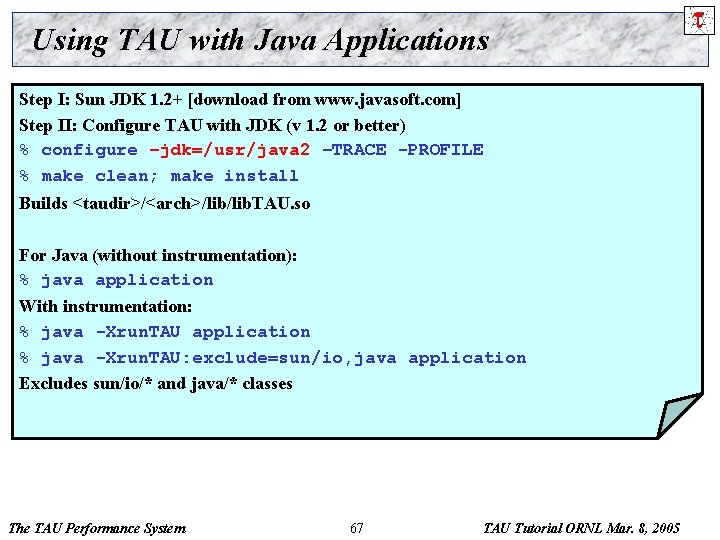
Using TAU with Java Applications Step I: Sun JDK 1. 2+ [download from www. javasoft. com] Step II: Configure TAU with JDK (v 1. 2 or better) % configure –jdk=/usr/java 2 –TRACE -PROFILE % make clean; make install Builds <taudir>/<arch>/lib. TAU. so For Java (without instrumentation): % java application With instrumentation: % java -Xrun. TAU application % java -Xrun. TAU: exclude=sun/io, java application Excludes sun/io/* and java/* classes The TAU Performance System 67 TAU Tutorial ORNL Mar. 8, 2005

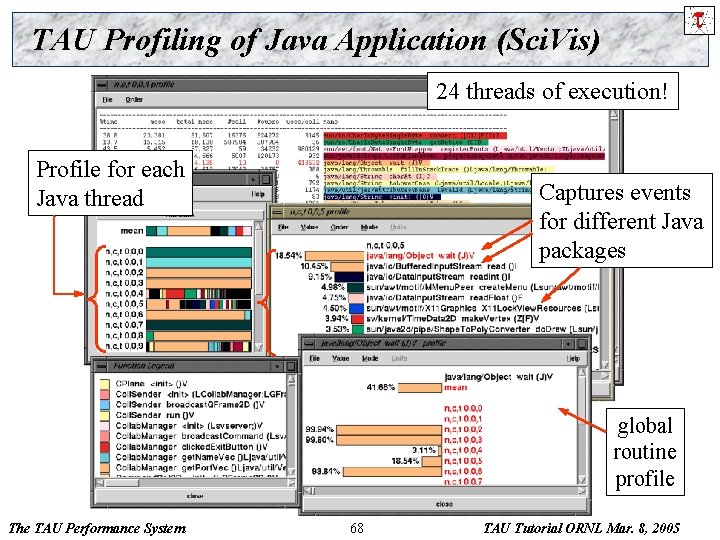
TAU Profiling of Java Application (Sci. Vis) 24 threads of execution! Profile for each Java thread Captures events for different Java packages global routine profile The TAU Performance System 68 TAU Tutorial ORNL Mar. 8, 2005

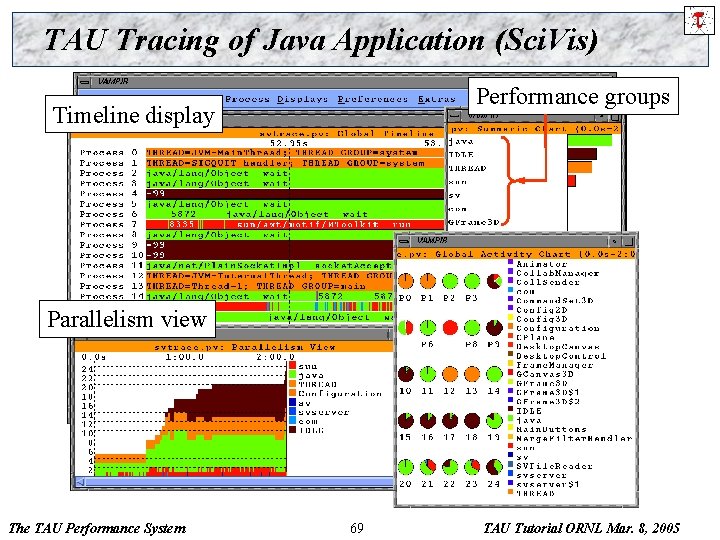
TAU Tracing of Java Application (Sci. Vis) Performance groups Timeline display Parallelism view The TAU Performance System 69 TAU Tutorial ORNL Mar. 8, 2005

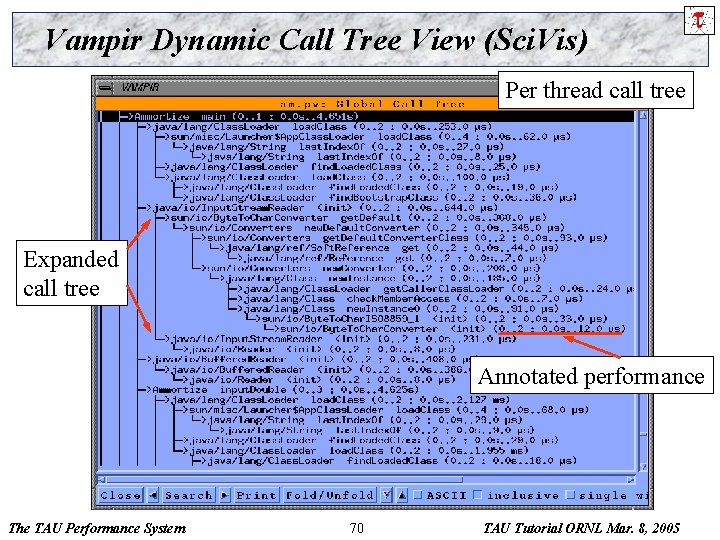
Vampir Dynamic Call Tree View (Sci. Vis) Per thread call tree Expanded call tree Annotated performance The TAU Performance System 70 TAU Tutorial ORNL Mar. 8, 2005

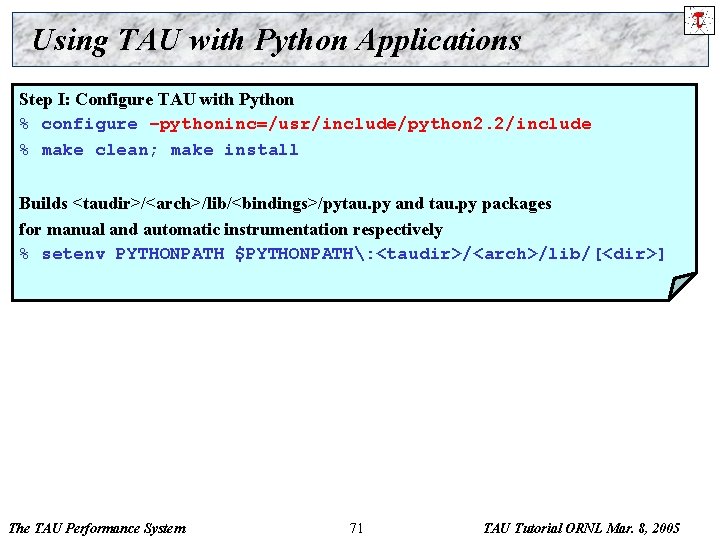
Using TAU with Python Applications Step I: Configure TAU with Python % configure –pythoninc=/usr/include/python 2. 2/include % make clean; make install Builds <taudir>/<arch>/lib/<bindings>/pytau. py and tau. py packages for manual and automatic instrumentation respectively % setenv PYTHONPATH $PYTHONPATH: <taudir>/<arch>/lib/[<dir>] The TAU Performance System 71 TAU Tutorial ORNL Mar. 8, 2005

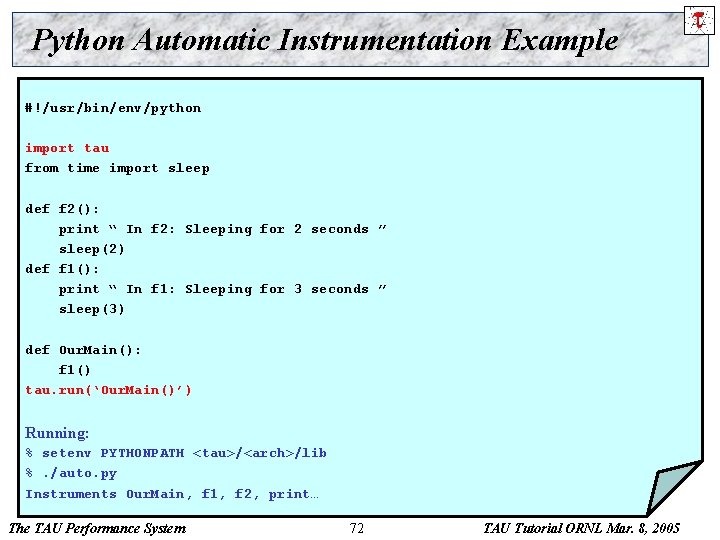
Python Automatic Instrumentation Example #!/usr/bin/env/python import tau from time import sleep def f 2(): print “ In f 2: Sleeping for 2 seconds ” sleep(2) def f 1(): print “ In f 1: Sleeping for 3 seconds ” sleep(3) def Our. Main(): f 1() tau. run(‘Our. Main()’) Running: % setenv PYTHONPATH <tau>/<arch>/lib %. /auto. py Instruments Our. Main, f 1, f 2, print… The TAU Performance System 72 TAU Tutorial ORNL Mar. 8, 2005

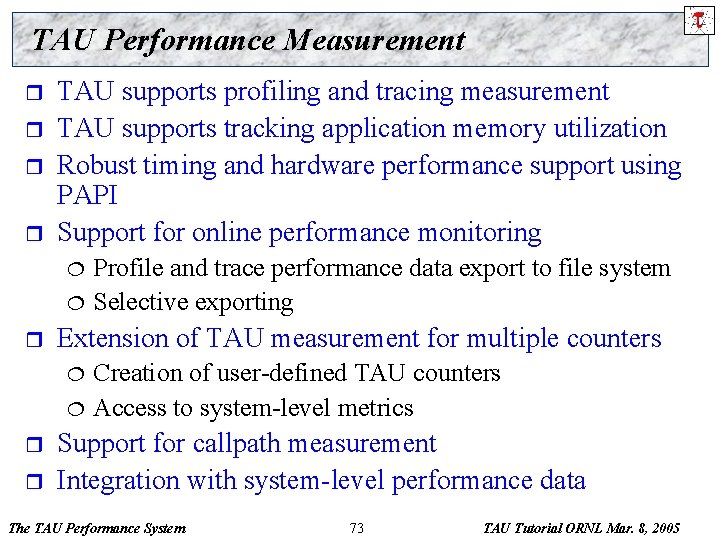
TAU Performance Measurement r r TAU supports profiling and tracing measurement TAU supports tracking application memory utilization Robust timing and hardware performance support using PAPI Support for online performance monitoring ¦ ¦ r Extension of TAU measurement for multiple counters ¦ ¦ r r Profile and trace performance data export to file system Selective exporting Creation of user-defined TAU counters Access to system-level metrics Support for callpath measurement Integration with system-level performance data The TAU Performance System 73 TAU Tutorial ORNL Mar. 8, 2005

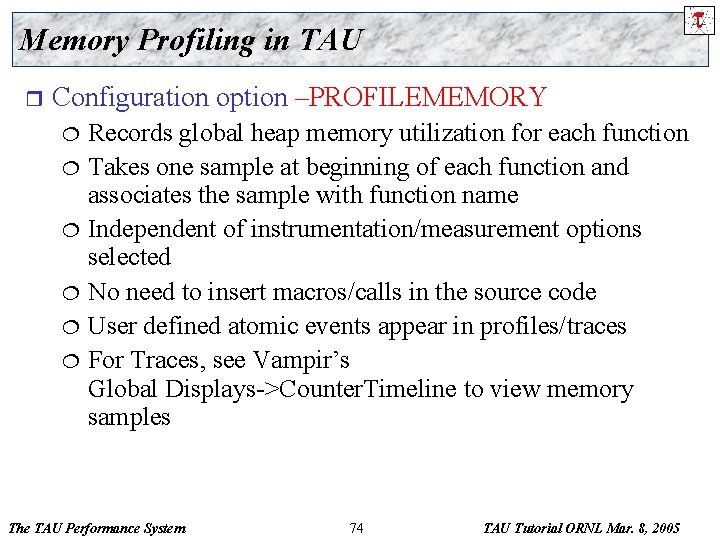
Memory Profiling in TAU r Configuration option –PROFILEMEMORY Records global heap memory utilization for each function ¦ Takes one sample at beginning of each function and associates the sample with function name ¦ Independent of instrumentation/measurement options selected ¦ No need to insert macros/calls in the source code ¦ User defined atomic events appear in profiles/traces ¦ For Traces, see Vampir’s Global Displays->Counter. Timeline to view memory samples ¦ The TAU Performance System 74 TAU Tutorial ORNL Mar. 8, 2005

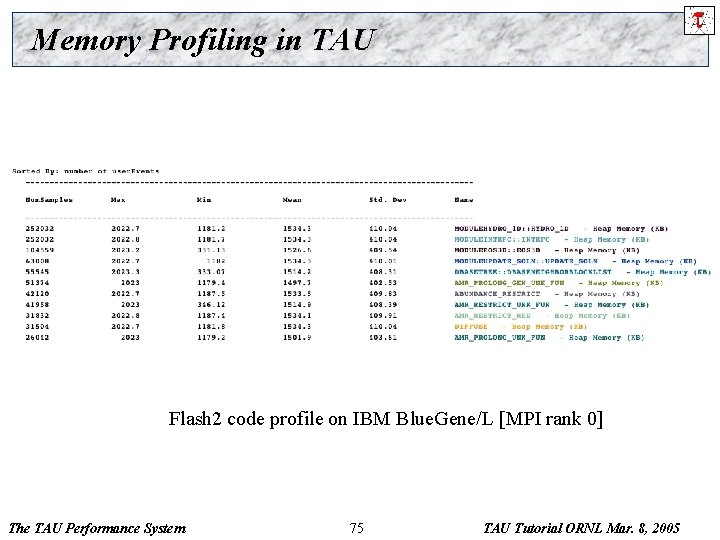
Memory Profiling in TAU Flash 2 code profile on IBM Blue. Gene/L [MPI rank 0] The TAU Performance System 75 TAU Tutorial ORNL Mar. 8, 2005

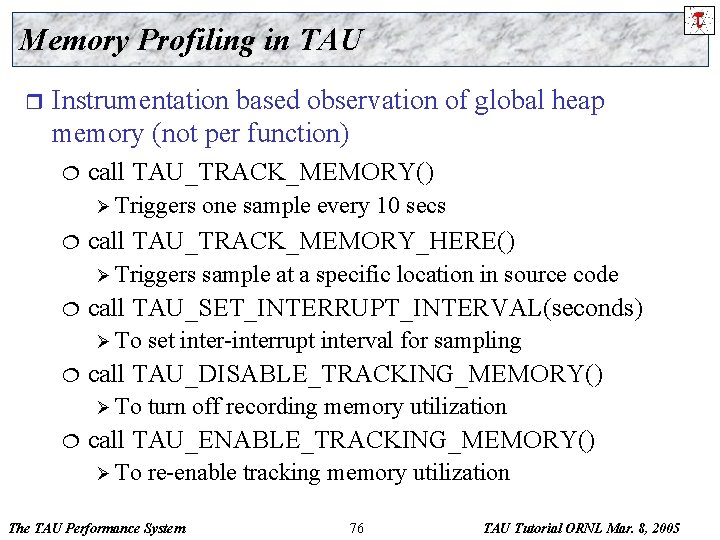
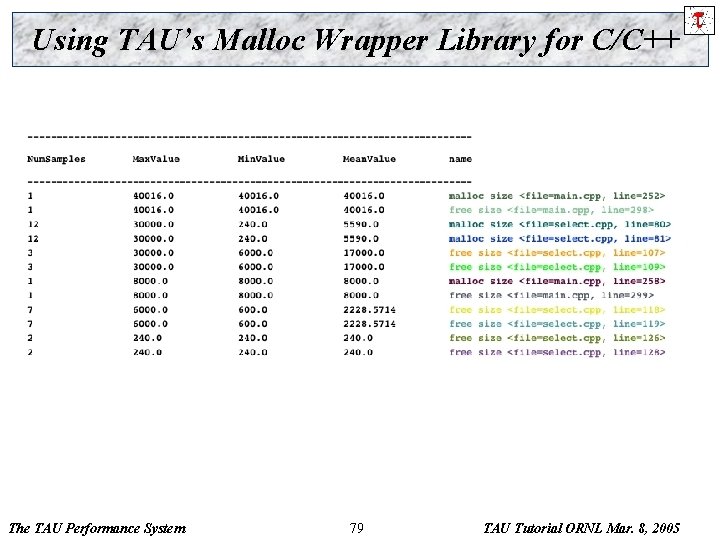
Memory Profiling in TAU r Instrumentation based observation of global heap memory (not per function) ¦ call TAU_TRACK_MEMORY() Ø Triggers ¦ call TAU_TRACK_MEMORY_HERE() Ø Triggers ¦ set inter-interrupt interval for sampling call TAU_DISABLE_TRACKING_MEMORY() Ø To ¦ sample at a specific location in source code call TAU_SET_INTERRUPT_INTERVAL(seconds) Ø To ¦ one sample every 10 secs turn off recording memory utilization call TAU_ENABLE_TRACKING_MEMORY() Ø To re-enable tracking memory utilization The TAU Performance System 76 TAU Tutorial ORNL Mar. 8, 2005

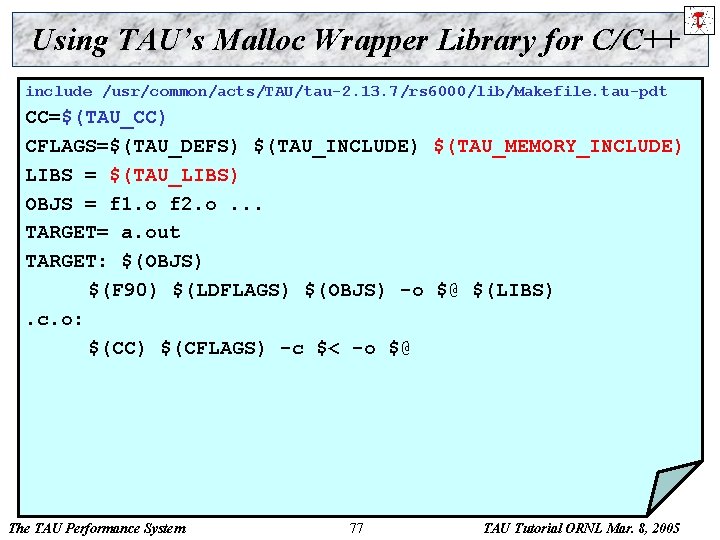
Using TAU’s Malloc Wrapper Library for C/C++ include /usr/common/acts/TAU/tau-2. 13. 7/rs 6000/lib/Makefile. tau-pdt CC=$(TAU_CC) CFLAGS=$(TAU_DEFS) $(TAU_INCLUDE) $(TAU_MEMORY_INCLUDE) LIBS = $(TAU_LIBS) OBJS = f 1. o f 2. o. . . TARGET= a. out TARGET: $(OBJS) $(F 90) $(LDFLAGS) $(OBJS) -o $@ $(LIBS). c. o: $(CC) $(CFLAGS) -c $< -o $@ The TAU Performance System 77 TAU Tutorial ORNL Mar. 8, 2005

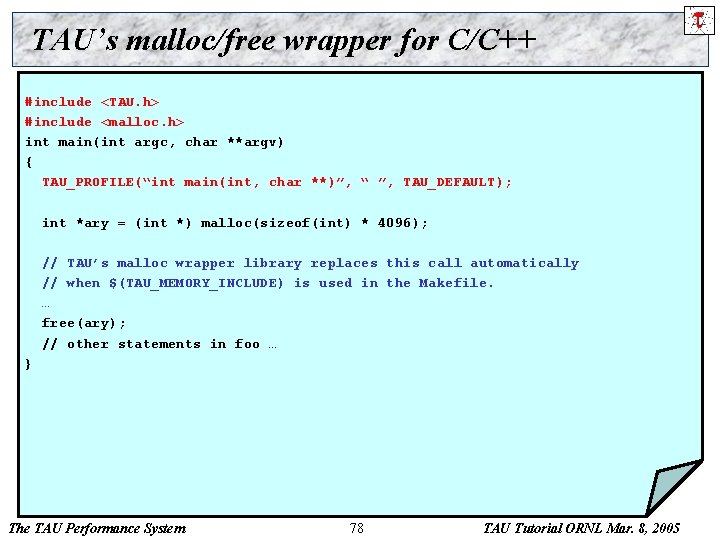
TAU’s malloc/free wrapper for C/C++ #include <TAU. h> #include <malloc. h> int main(int argc, char **argv) { TAU_PROFILE(“int main(int, char **)”, “ ”, TAU_DEFAULT); int *ary = (int *) malloc(sizeof(int) * 4096); // TAU’s malloc wrapper library replaces this call automatically // when $(TAU_MEMORY_INCLUDE) is used in the Makefile. … free(ary); // other statements in foo … } The TAU Performance System 78 TAU Tutorial ORNL Mar. 8, 2005

Using TAU’s Malloc Wrapper Library for C/C++ The TAU Performance System 79 TAU Tutorial ORNL Mar. 8, 2005

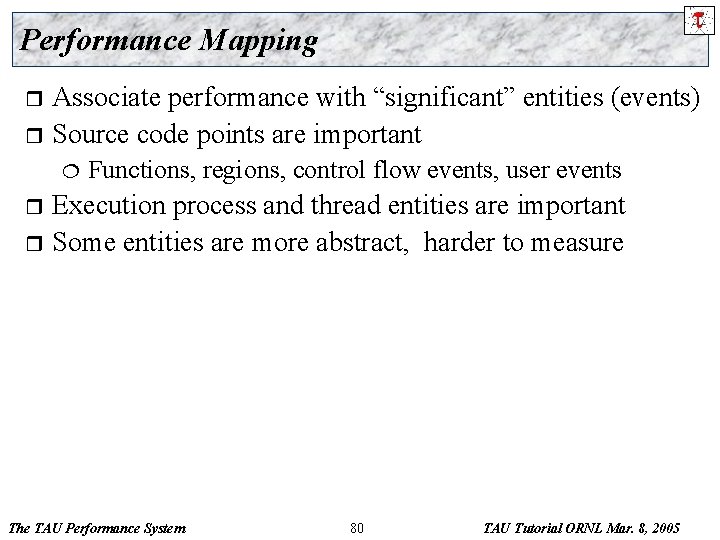
Performance Mapping Associate performance with “significant” entities (events) r Source code points are important r ¦ Functions, regions, control flow events, user events Execution process and thread entities are important r Some entities are more abstract, harder to measure r The TAU Performance System 80 TAU Tutorial ORNL Mar. 8, 2005

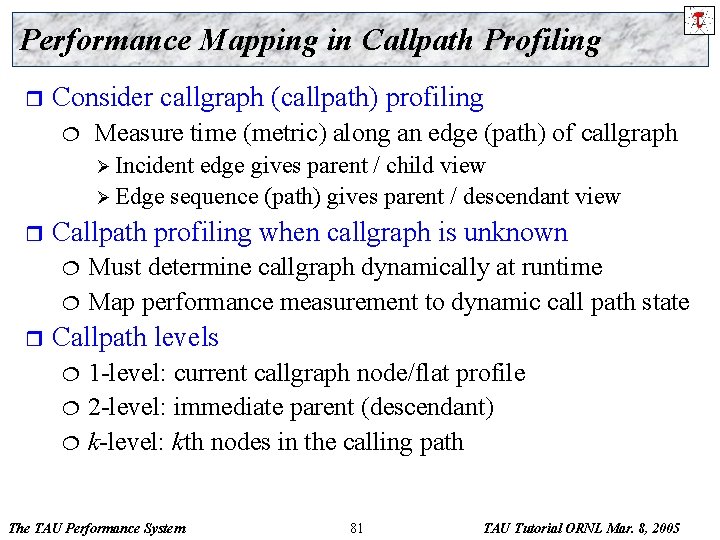
Performance Mapping in Callpath Profiling r Consider callgraph (callpath) profiling ¦ Measure time (metric) along an edge (path) of callgraph Ø Incident edge gives parent / child view Ø Edge sequence (path) gives parent / descendant view r Callpath profiling when callgraph is unknown Must determine callgraph dynamically at runtime ¦ Map performance measurement to dynamic call path state ¦ r Callpath levels 1 -level: current callgraph node/flat profile ¦ 2 -level: immediate parent (descendant) ¦ k-level: kth nodes in the calling path ¦ The TAU Performance System 81 TAU Tutorial ORNL Mar. 8, 2005

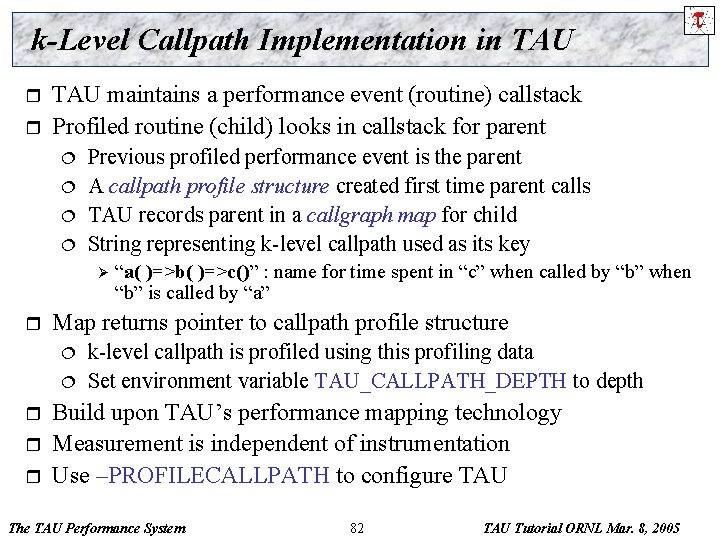
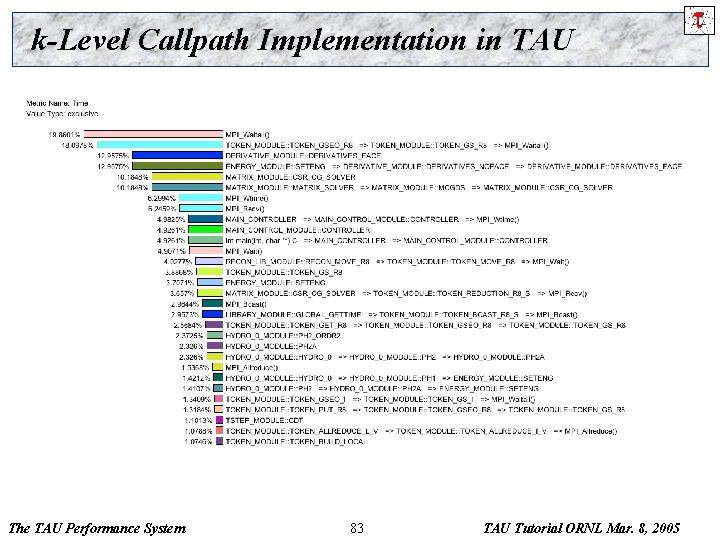
k-Level Callpath Implementation in TAU r r TAU maintains a performance event (routine) callstack Profiled routine (child) looks in callstack for parent ¦ ¦ Previous profiled performance event is the parent A callpath profile structure created first time parent calls TAU records parent in a callgraph map for child String representing k-level callpath used as its key Ø r Map returns pointer to callpath profile structure ¦ ¦ r r r “a( )=>b( )=>c()” : name for time spent in “c” when called by “b” when “b” is called by “a” k-level callpath is profiled using this profiling data Set environment variable TAU_CALLPATH_DEPTH to depth Build upon TAU’s performance mapping technology Measurement is independent of instrumentation Use –PROFILECALLPATH to configure TAU The TAU Performance System 82 TAU Tutorial ORNL Mar. 8, 2005

k-Level Callpath Implementation in TAU The TAU Performance System 83 TAU Tutorial ORNL Mar. 8, 2005

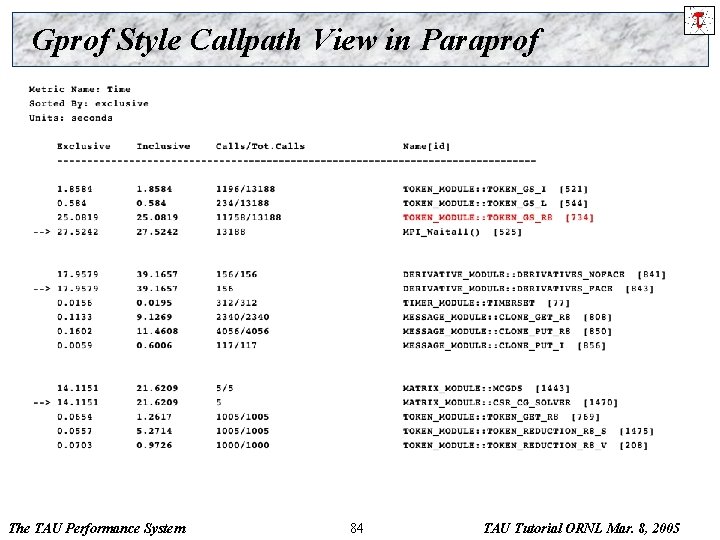
Gprof Style Callpath View in Paraprof The TAU Performance System 84 TAU Tutorial ORNL Mar. 8, 2005

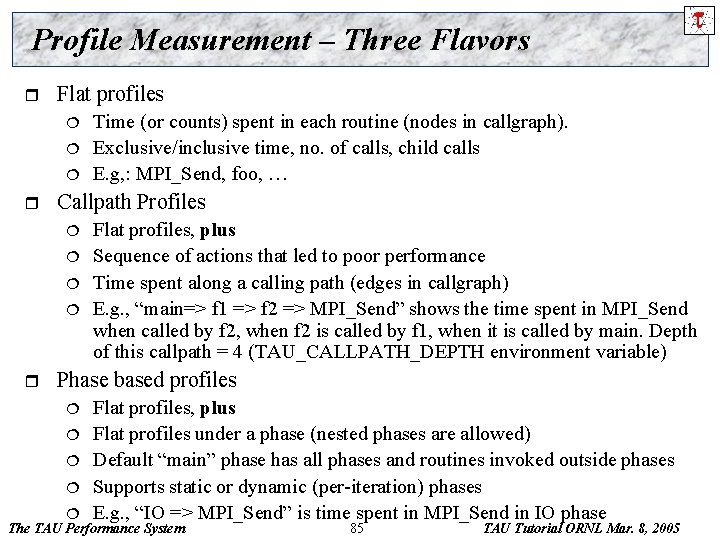
Profile Measurement – Three Flavors r Flat profiles ¦ ¦ ¦ r Callpath Profiles ¦ ¦ r Time (or counts) spent in each routine (nodes in callgraph). Exclusive/inclusive time, no. of calls, child calls E. g, : MPI_Send, foo, … Flat profiles, plus Sequence of actions that led to poor performance Time spent along a calling path (edges in callgraph) E. g. , “main=> f 1 => f 2 => MPI_Send” shows the time spent in MPI_Send when called by f 2, when f 2 is called by f 1, when it is called by main. Depth of this callpath = 4 (TAU_CALLPATH_DEPTH environment variable) Phase based profiles ¦ ¦ ¦ Flat profiles, plus Flat profiles under a phase (nested phases are allowed) Default “main” phase has all phases and routines invoked outside phases Supports static or dynamic (per-iteration) phases E. g. , “IO => MPI_Send” is time spent in MPI_Send in IO phase The TAU Performance System 85 TAU Tutorial ORNL Mar. 8, 2005

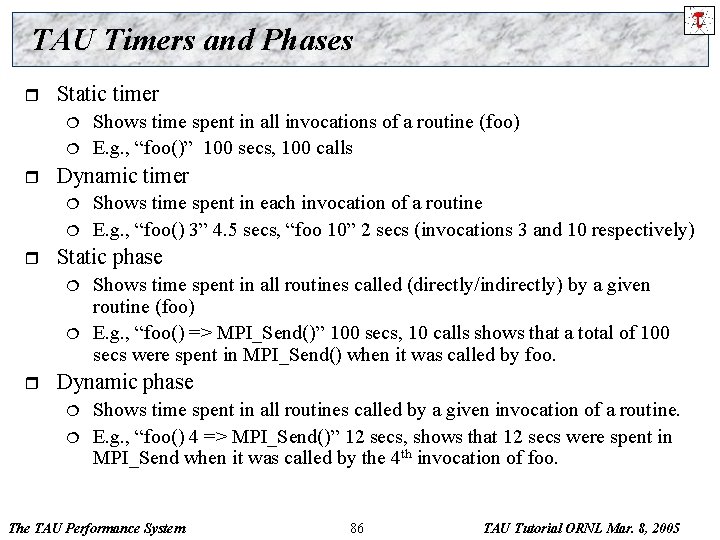
TAU Timers and Phases r Static timer ¦ ¦ r Dynamic timer ¦ ¦ r Shows time spent in each invocation of a routine E. g. , “foo() 3” 4. 5 secs, “foo 10” 2 secs (invocations 3 and 10 respectively) Static phase ¦ ¦ r Shows time spent in all invocations of a routine (foo) E. g. , “foo()” 100 secs, 100 calls Shows time spent in all routines called (directly/indirectly) by a given routine (foo) E. g. , “foo() => MPI_Send()” 100 secs, 10 calls shows that a total of 100 secs were spent in MPI_Send() when it was called by foo. Dynamic phase ¦ ¦ Shows time spent in all routines called by a given invocation of a routine. E. g. , “foo() 4 => MPI_Send()” 12 secs, shows that 12 secs were spent in MPI_Send when it was called by the 4 th invocation of foo. The TAU Performance System 86 TAU Tutorial ORNL Mar. 8, 2005

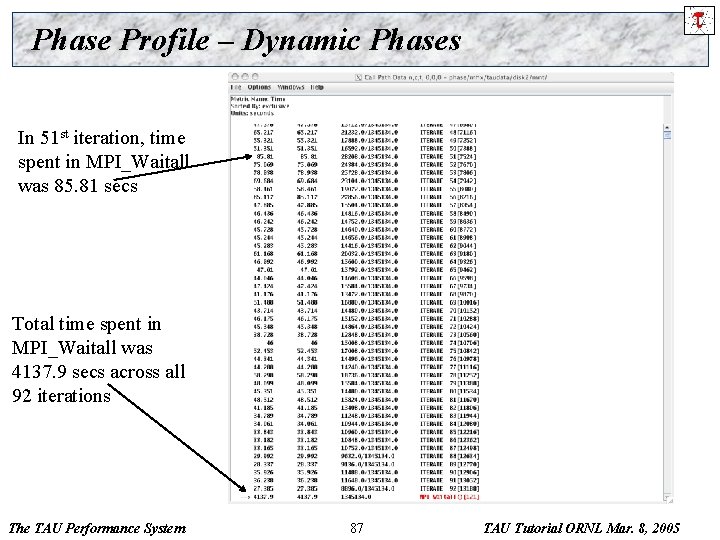
Phase Profile – Dynamic Phases In 51 st iteration, time spent in MPI_Waitall was 85. 81 secs Total time spent in MPI_Waitall was 4137. 9 secs across all 92 iterations The TAU Performance System 87 TAU Tutorial ORNL Mar. 8, 2005

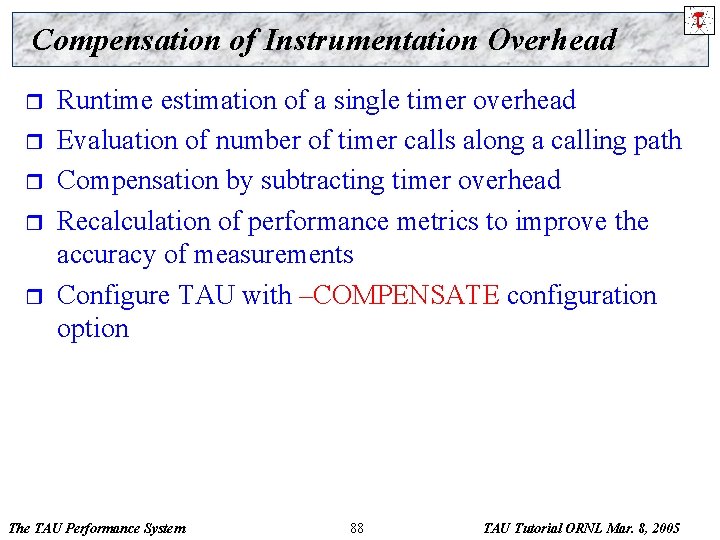
Compensation of Instrumentation Overhead r r r Runtime estimation of a single timer overhead Evaluation of number of timer calls along a calling path Compensation by subtracting timer overhead Recalculation of performance metrics to improve the accuracy of measurements Configure TAU with –COMPENSATE configuration option The TAU Performance System 88 TAU Tutorial ORNL Mar. 8, 2005

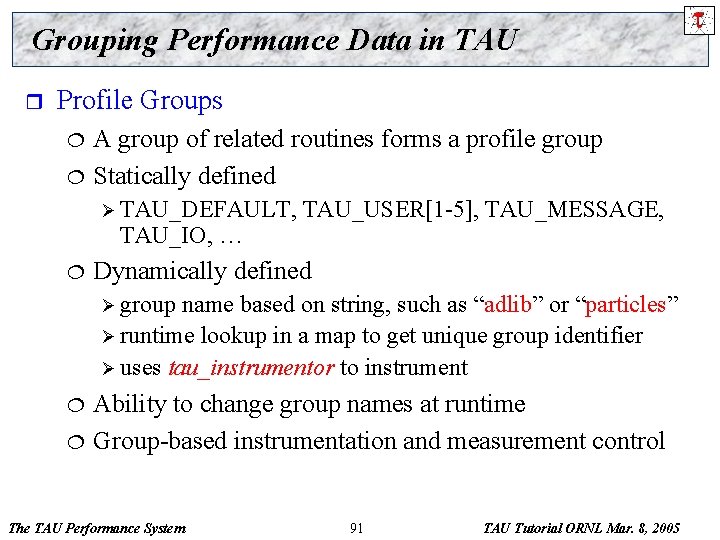
Grouping Performance Data in TAU r Profile Groups ¦ ¦ A group of related routines forms a profile group Statically defined Ø TAU_DEFAULT, TAU_IO, … ¦ TAU_USER[1 -5], TAU_MESSAGE, Dynamically defined Ø group name based on string, such as “adlib” or “particles” Ø runtime lookup in a map to get unique group identifier Ø uses tau_instrumentor to instrument ¦ ¦ Ability to change group names at runtime Group-based instrumentation and measurement control The TAU Performance System 91 TAU Tutorial ORNL Mar. 8, 2005

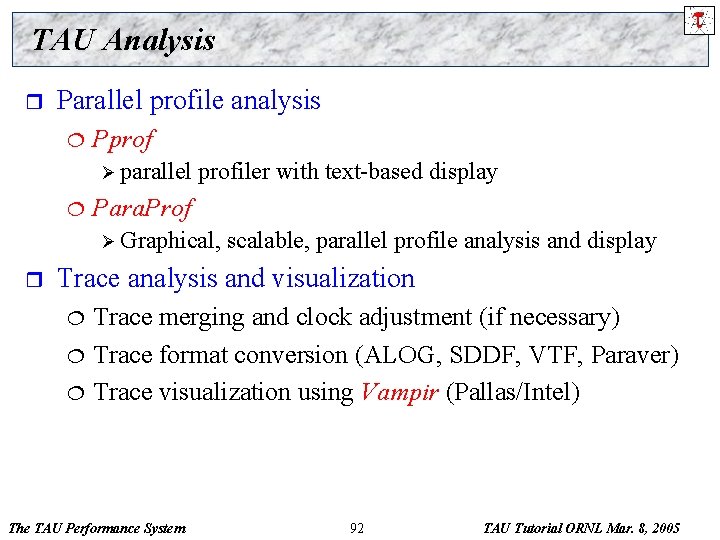
TAU Analysis r Parallel profile analysis ¦ Pprof Ø parallel ¦ profiler with text-based display Para. Prof Ø Graphical, r scalable, parallel profile analysis and display Trace analysis and visualization ¦ ¦ ¦ Trace merging and clock adjustment (if necessary) Trace format conversion (ALOG, SDDF, VTF, Paraver) Trace visualization using Vampir (Pallas/Intel) The TAU Performance System 92 TAU Tutorial ORNL Mar. 8, 2005

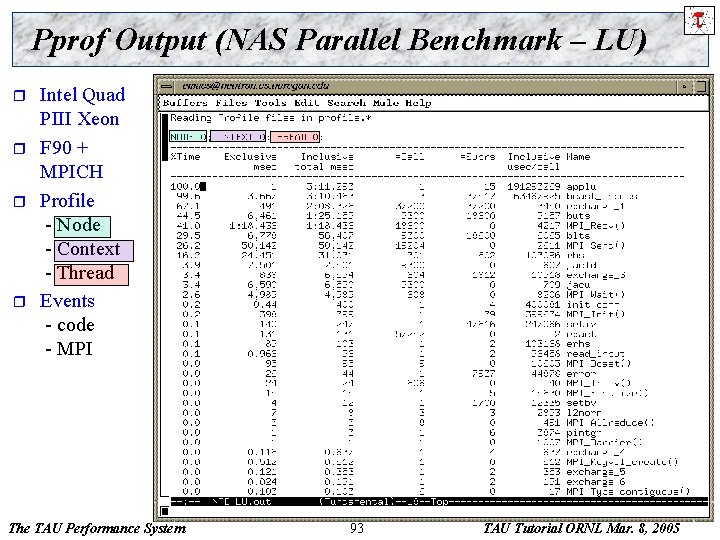
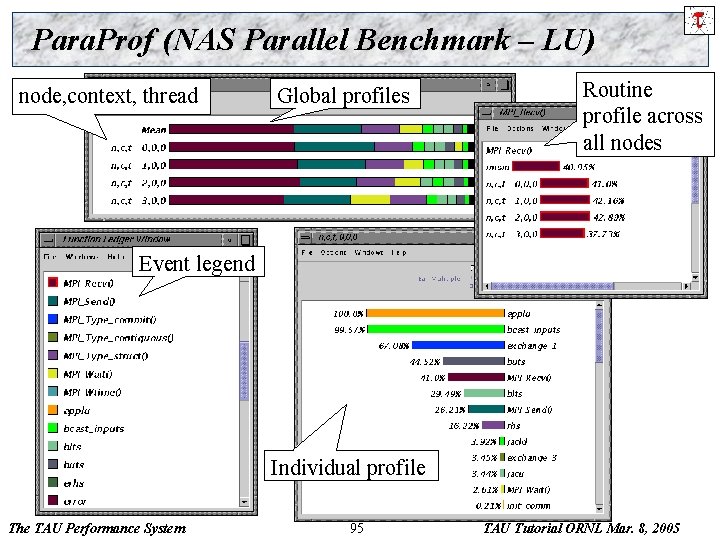
Pprof Output (NAS Parallel Benchmark – LU) r r Intel Quad PIII Xeon F 90 + MPICH Profile - Node - Context - Thread Events - code - MPI The TAU Performance System 93 TAU Tutorial ORNL Mar. 8, 2005

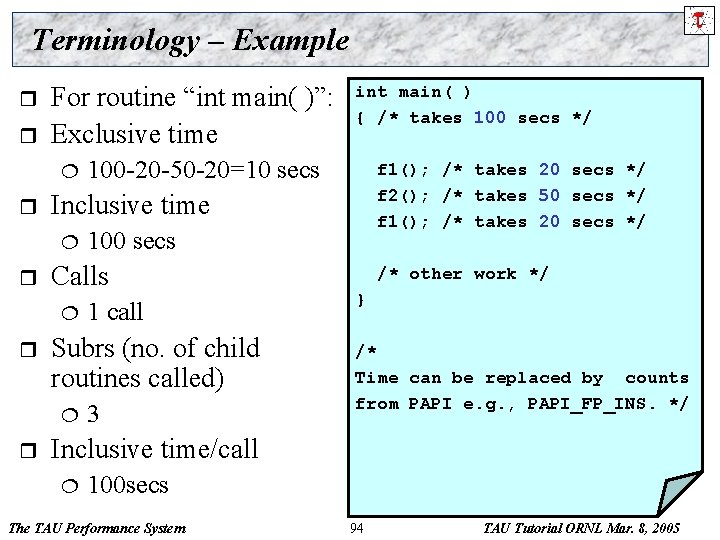
Terminology – Example r r For routine “int main( )”: Exclusive time ¦ r 1 call Subrs (no. of child routines called) ¦ r f 1(); /* takes 20 secs */ f 2(); /* takes 50 secs */ f 1(); /* takes 20 secs */ 100 secs Calls ¦ r 100 -20 -50 -20=10 secs Inclusive time ¦ r int main( ) { /* takes 100 secs */ 3 /* other work */ } /* Time can be replaced by counts from PAPI e. g. , PAPI_FP_INS. */ Inclusive time/call ¦ 100 secs The TAU Performance System 94 TAU Tutorial ORNL Mar. 8, 2005

Para. Prof (NAS Parallel Benchmark – LU) node, context, thread Global profiles Routine profile across all nodes Event legend Individual profile The TAU Performance System 95 TAU Tutorial ORNL Mar. 8, 2005

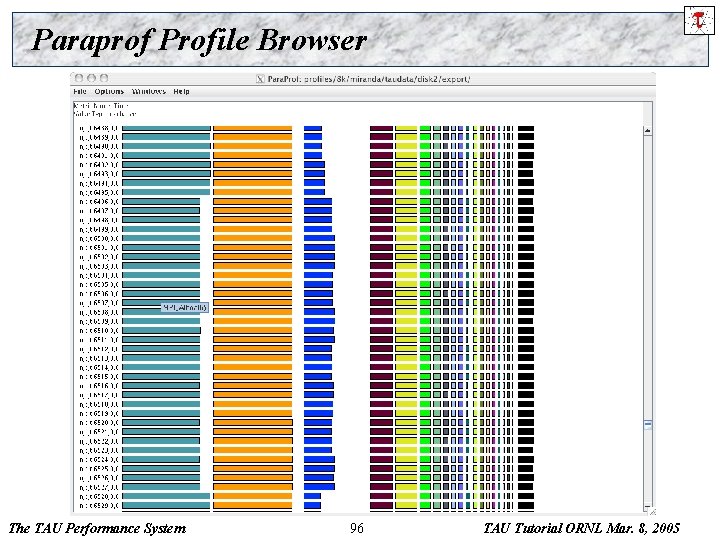
Paraprof Profile Browser The TAU Performance System 96 TAU Tutorial ORNL Mar. 8, 2005

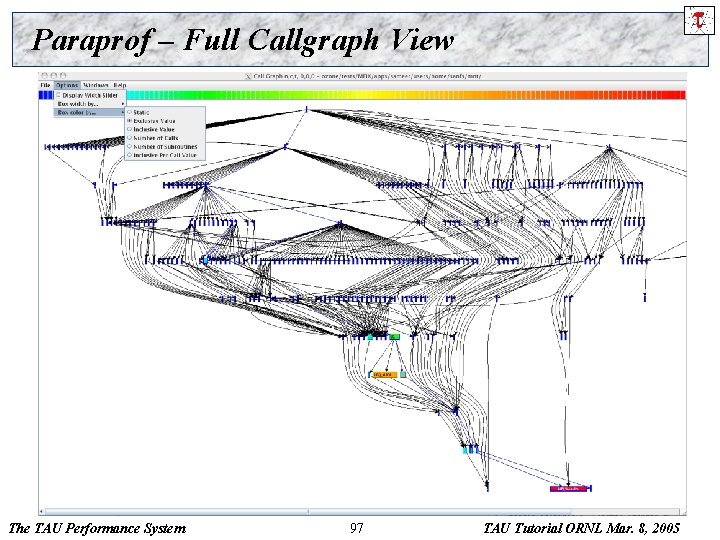
Paraprof – Full Callgraph View The TAU Performance System 97 TAU Tutorial ORNL Mar. 8, 2005

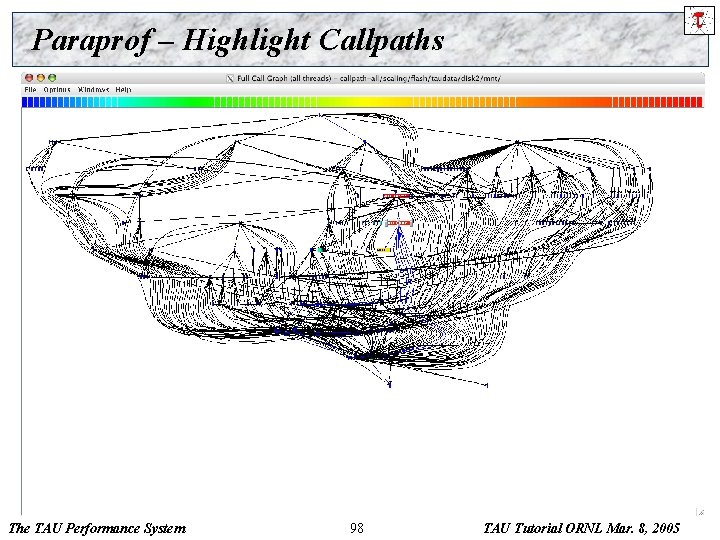
Paraprof – Highlight Callpaths The TAU Performance System 98 TAU Tutorial ORNL Mar. 8, 2005

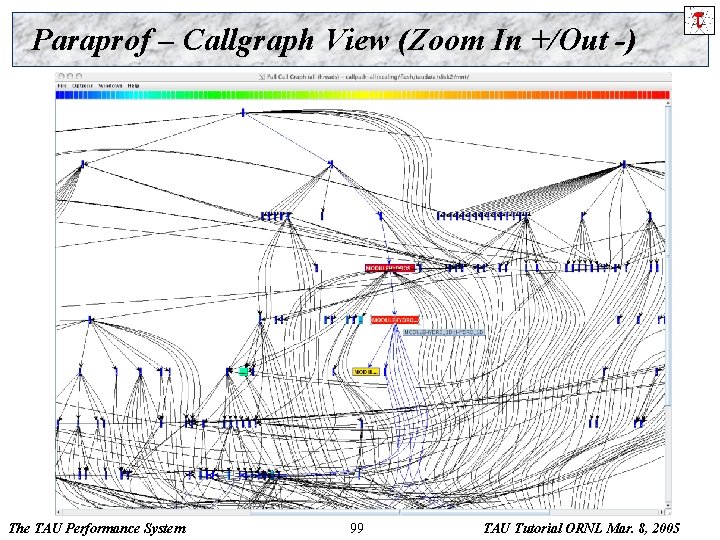
Paraprof – Callgraph View (Zoom In +/Out -) The TAU Performance System 99 TAU Tutorial ORNL Mar. 8, 2005

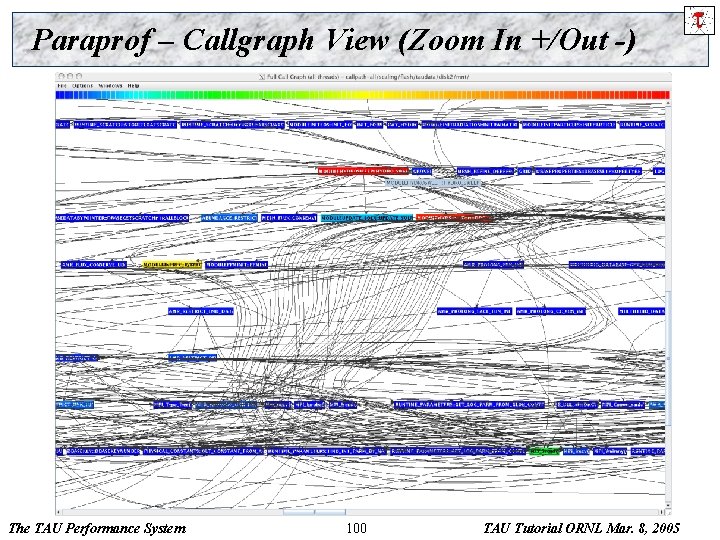
Paraprof – Callgraph View (Zoom In +/Out -) The TAU Performance System 100 TAU Tutorial ORNL Mar. 8, 2005

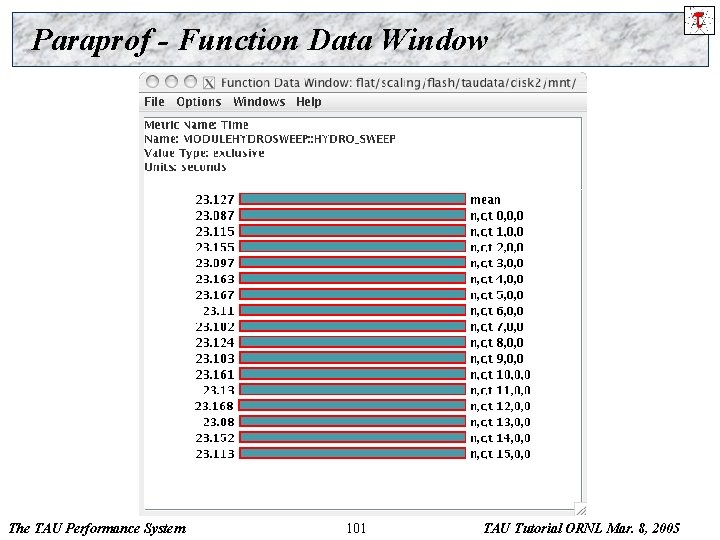
Paraprof - Function Data Window The TAU Performance System 101 TAU Tutorial ORNL Mar. 8, 2005

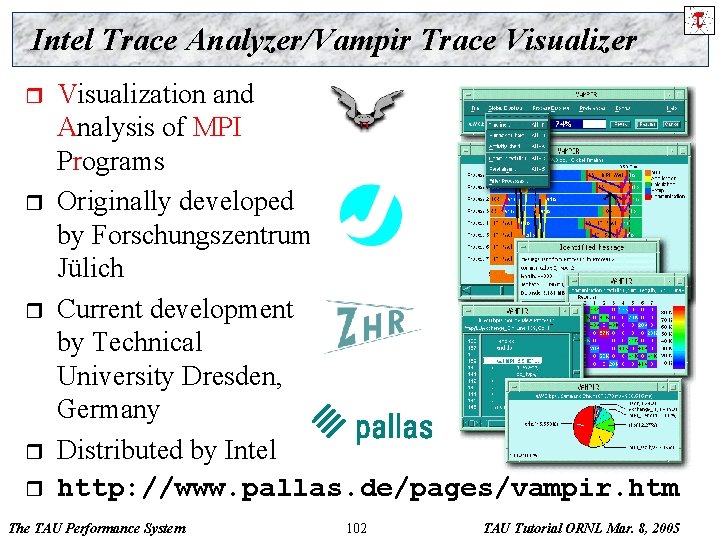
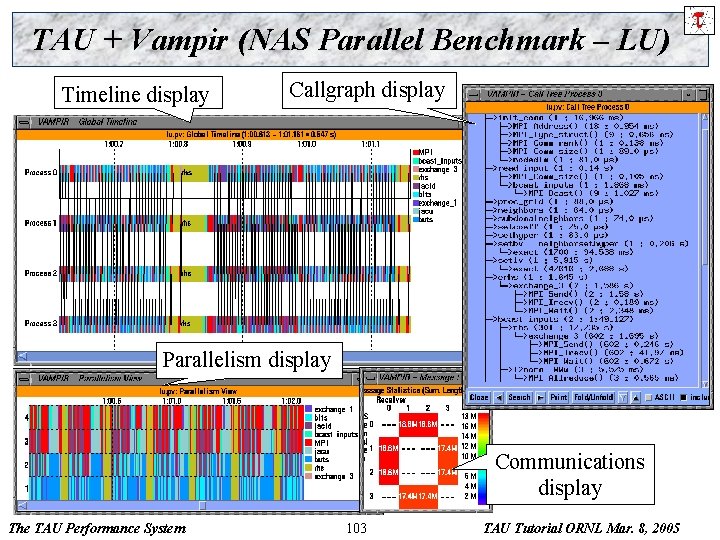
Intel Trace Analyzer/Vampir Trace Visualizer r r Visualization and Analysis of MPI Programs Originally developed by Forschungszentrum Jülich Current development by Technical University Dresden, Germany Distributed by Intel http: //www. pallas. de/pages/vampir. htm The TAU Performance System 102 TAU Tutorial ORNL Mar. 8, 2005

TAU + Vampir (NAS Parallel Benchmark – LU) Timeline display Callgraph display Parallelism display Communications display The TAU Performance System 103 TAU Tutorial ORNL Mar. 8, 2005

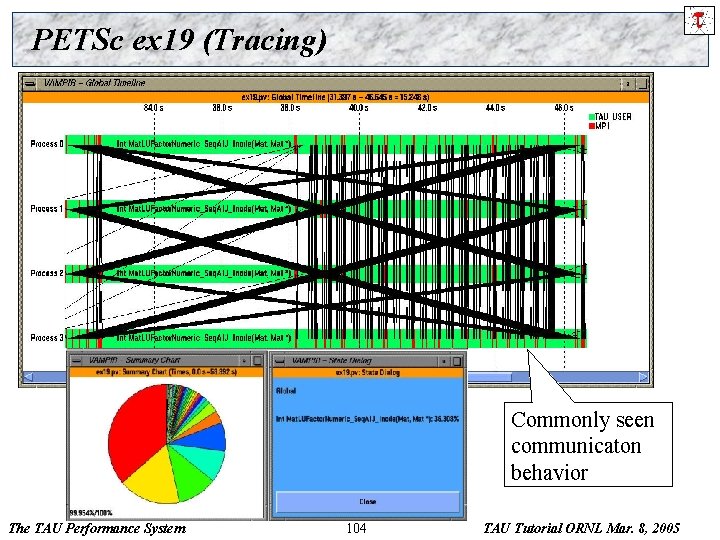
PETSc ex 19 (Tracing) Commonly seen communicaton behavior The TAU Performance System 104 TAU Tutorial ORNL Mar. 8, 2005

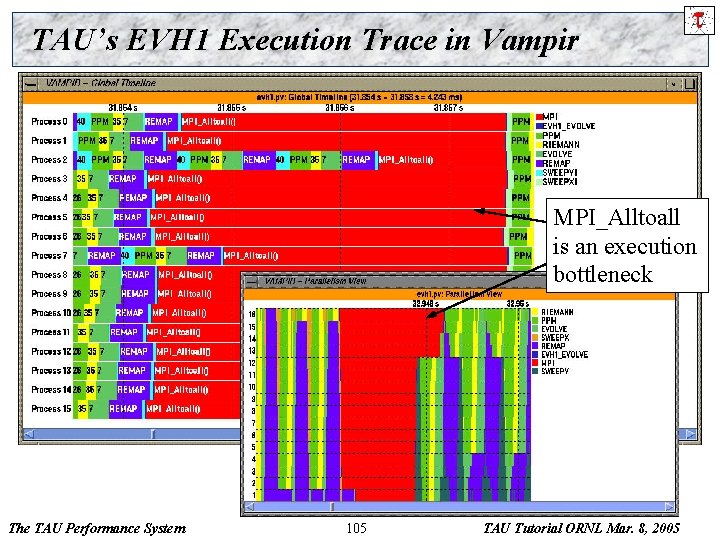
TAU’s EVH 1 Execution Trace in Vampir MPI_Alltoall is an execution bottleneck The TAU Performance System 105 TAU Tutorial ORNL Mar. 8, 2005

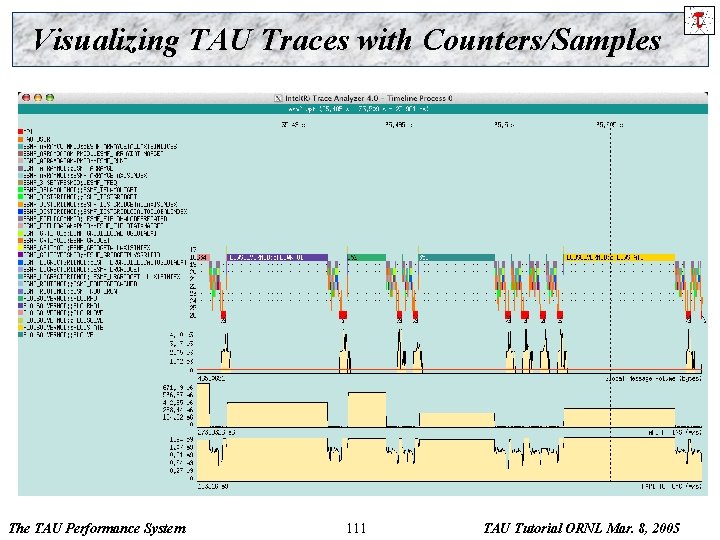
Using TAU with Vampir r Configure TAU with -TRACE –vtf=dir option % configure –TRACE –vtf=<dir> -MULTIPLECOUNTERS –papi=<dir> -mpi –pdt=dir … r Set environment variables % setenv TAU_TRACEFILE foo. vpt. gz % setenv COUNTER 1 GET_TIME_OF_DAY (reqd) % setenv COUNTER 2 PAPI_FP_INS… r Execute application (automatic merge/convert) % poe a. out –procs 4 % vampir foo. vpt. gz The TAU Performance System 106 TAU Tutorial ORNL Mar. 8, 2005

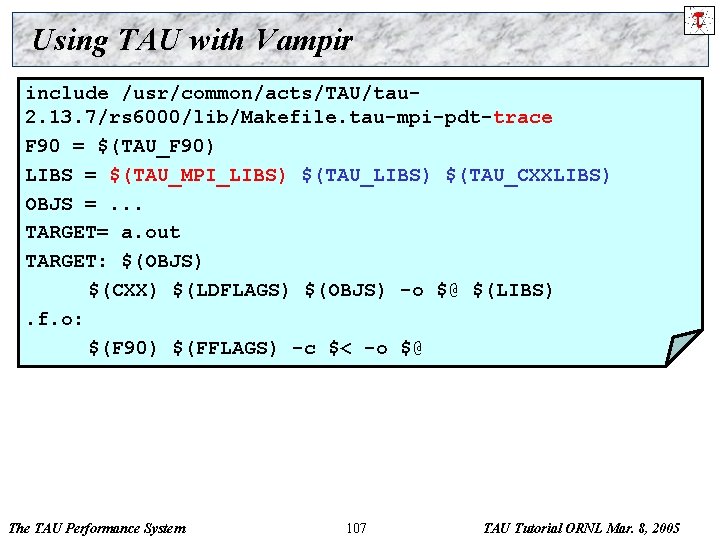
Using TAU with Vampir include /usr/common/acts/TAU/tau 2. 13. 7/rs 6000/lib/Makefile. tau-mpi-pdt-trace F 90 = $(TAU_F 90) LIBS = $(TAU_MPI_LIBS) $(TAU_CXXLIBS) OBJS =. . . TARGET= a. out TARGET: $(OBJS) $(CXX) $(LDFLAGS) $(OBJS) -o $@ $(LIBS). f. o: $(F 90) $(FFLAGS) -c $< -o $@ The TAU Performance System 107 TAU Tutorial ORNL Mar. 8, 2005

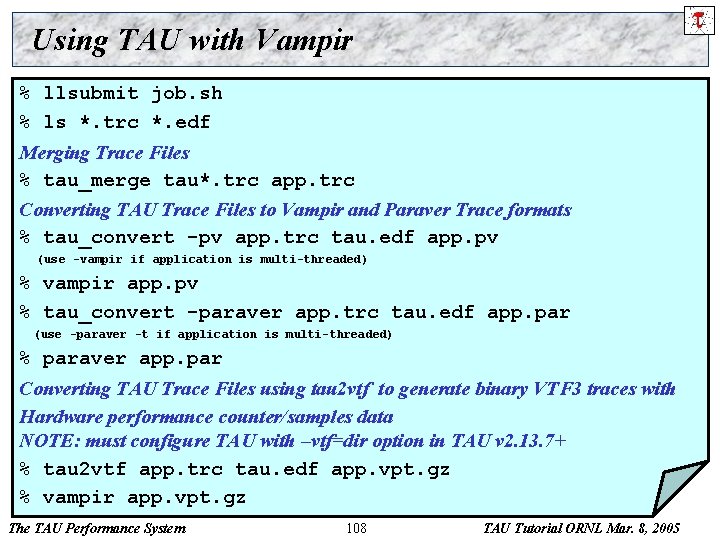
Using TAU with Vampir % llsubmit job. sh % ls *. trc *. edf Merging Trace Files % tau_merge tau*. trc app. trc Converting TAU Trace Files to Vampir and Paraver Trace formats % tau_convert -pv app. trc tau. edf app. pv (use -vampir if application is multi-threaded) % vampir app. pv % tau_convert -paraver app. trc tau. edf app. par (use -paraver -t if application is multi-threaded) % paraver app. par Converting TAU Trace Files using tau 2 vtf to generate binary VTF 3 traces with Hardware performance counter/samples data NOTE: must configure TAU with –vtf=dir option in TAU v 2. 13. 7+ % tau 2 vtf app. trc tau. edf app. vpt. gz % vampir app. vpt. gz The TAU Performance System 108 TAU Tutorial ORNL Mar. 8, 2005

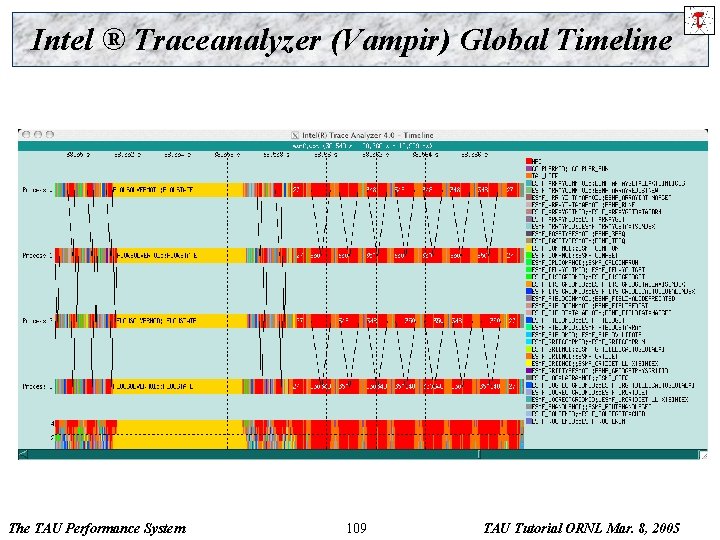
Intel ® Traceanalyzer (Vampir) Global Timeline The TAU Performance System 109 TAU Tutorial ORNL Mar. 8, 2005

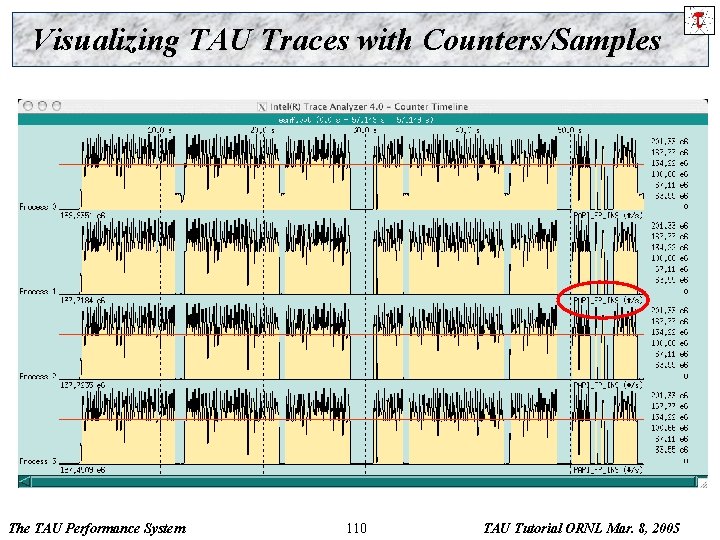
Visualizing TAU Traces with Counters/Samples The TAU Performance System 110 TAU Tutorial ORNL Mar. 8, 2005

Visualizing TAU Traces with Counters/Samples The TAU Performance System 111 TAU Tutorial ORNL Mar. 8, 2005

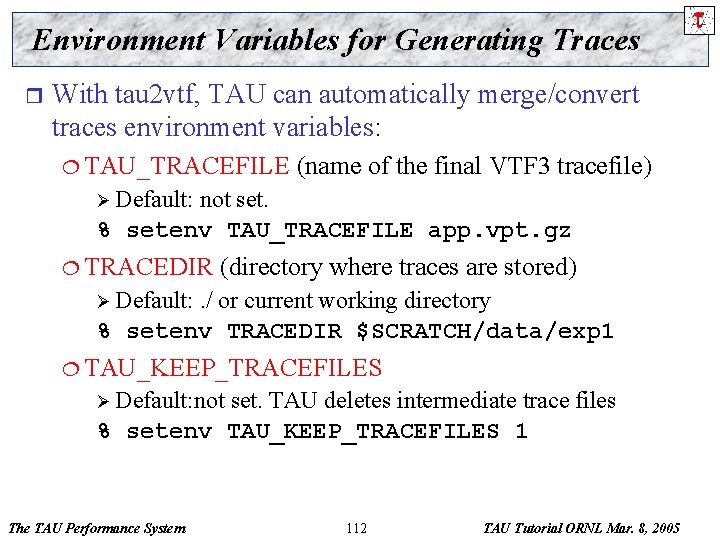
Environment Variables for Generating Traces r With tau 2 vtf, TAU can automatically merge/convert traces environment variables: ¦ TAU_TRACEFILE (name of the final VTF 3 tracefile) Ø Default: not set. % setenv TAU_TRACEFILE app. vpt. gz ¦ TRACEDIR (directory where traces are stored) Ø Default: . / or current working directory % setenv TRACEDIR $SCRATCH/data/exp 1 ¦ TAU_KEEP_TRACEFILES Ø Default: not set. TAU deletes intermediate trace files % setenv TAU_KEEP_TRACEFILES 1 The TAU Performance System 112 TAU Tutorial ORNL Mar. 8, 2005

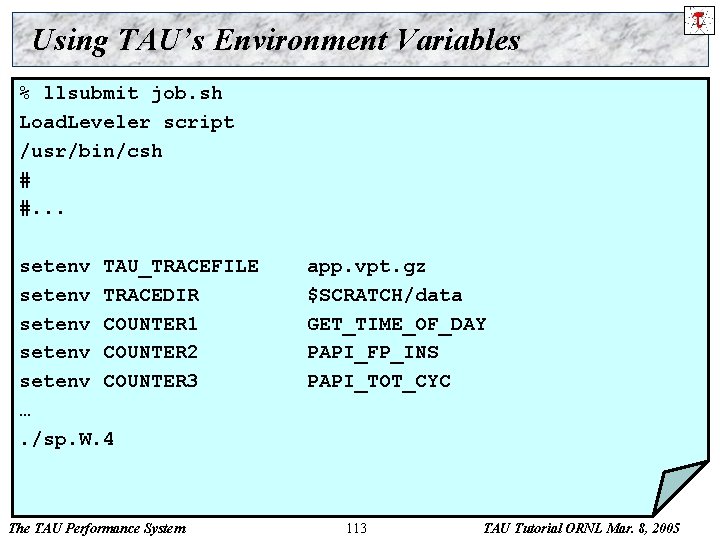
Using TAU’s Environment Variables % llsubmit job. sh Load. Leveler script /usr/bin/csh # #. . . setenv TAU_TRACEFILE setenv TRACEDIR setenv COUNTER 1 setenv COUNTER 2 setenv COUNTER 3 …. /sp. W. 4 The TAU Performance System app. vpt. gz $SCRATCH/data GET_TIME_OF_DAY PAPI_FP_INS PAPI_TOT_CYC 113 TAU Tutorial ORNL Mar. 8, 2005

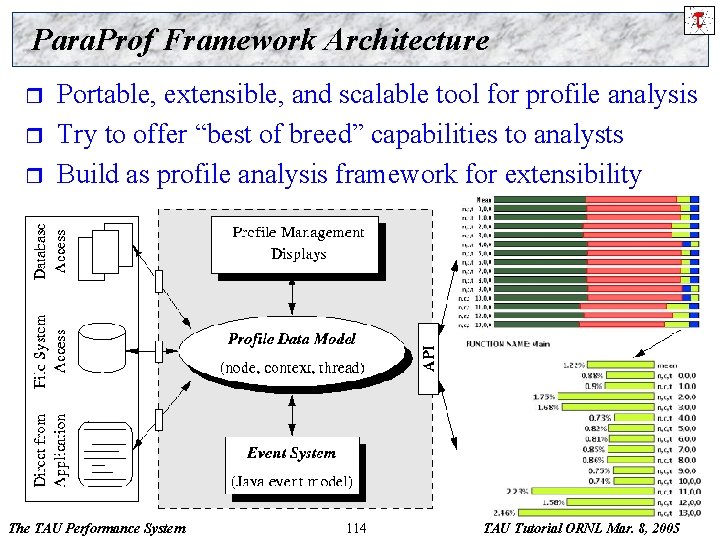
Para. Prof Framework Architecture r r r Portable, extensible, and scalable tool for profile analysis Try to offer “best of breed” capabilities to analysts Build as profile analysis framework for extensibility The TAU Performance System 114 TAU Tutorial ORNL Mar. 8, 2005

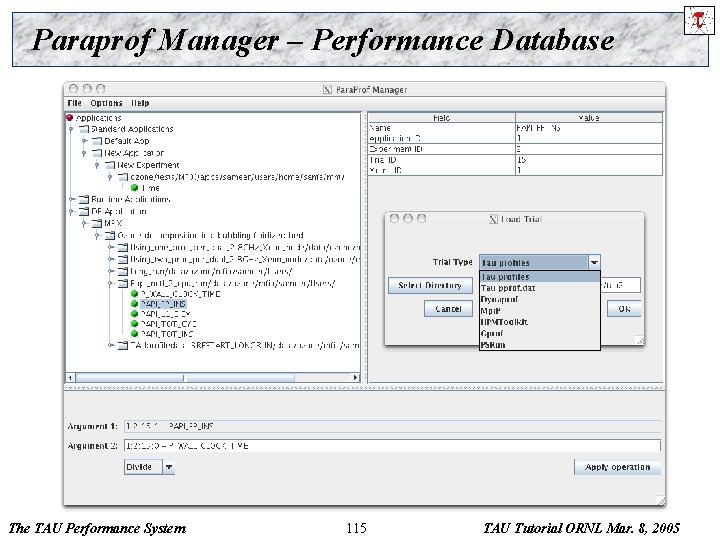
Paraprof Manager – Performance Database The TAU Performance System 115 TAU Tutorial ORNL Mar. 8, 2005

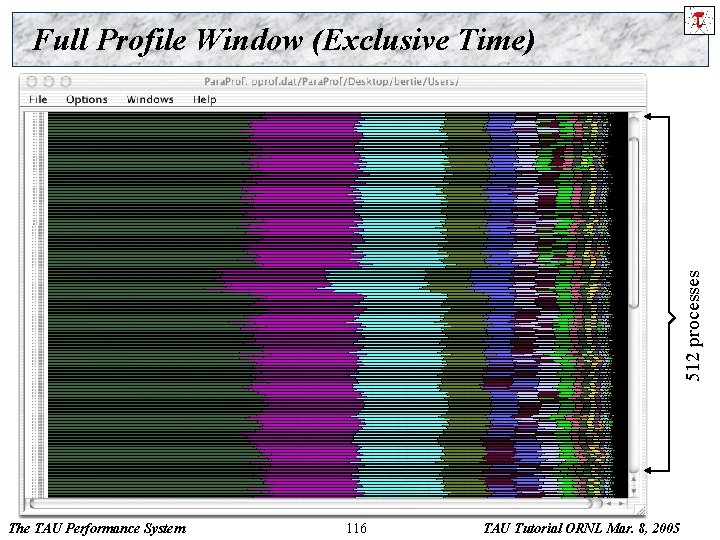
512 processes Full Profile Window (Exclusive Time) The TAU Performance System 116 TAU Tutorial ORNL Mar. 8, 2005

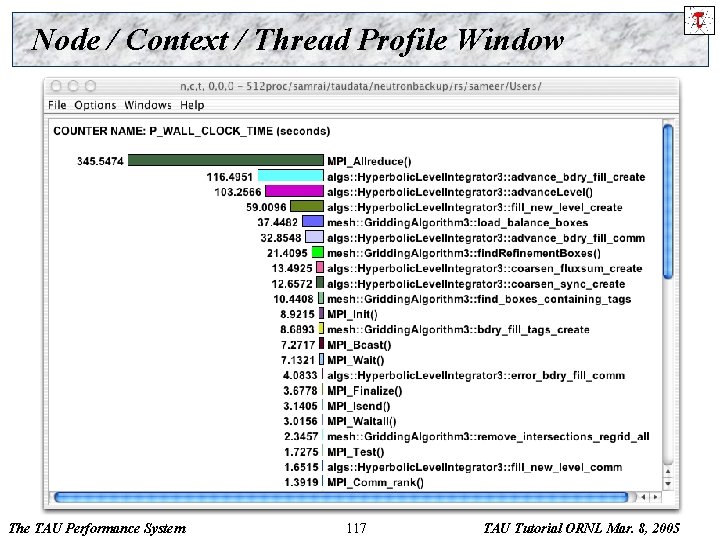
Node / Context / Thread Profile Window The TAU Performance System 117 TAU Tutorial ORNL Mar. 8, 2005

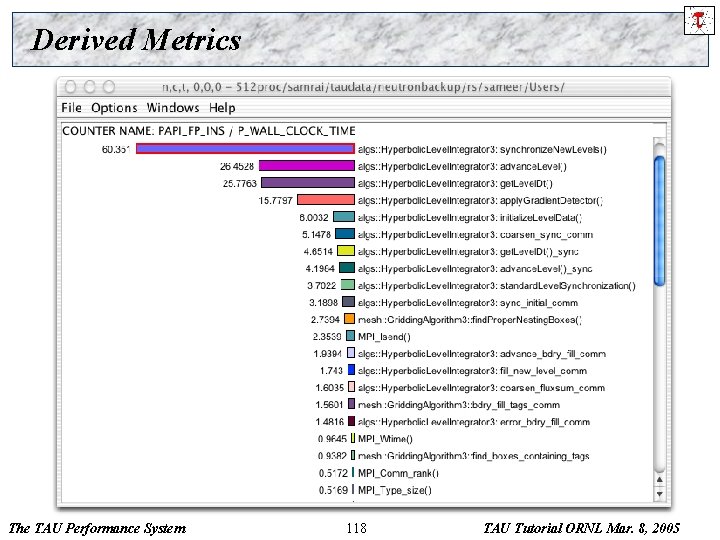
Derived Metrics The TAU Performance System 118 TAU Tutorial ORNL Mar. 8, 2005

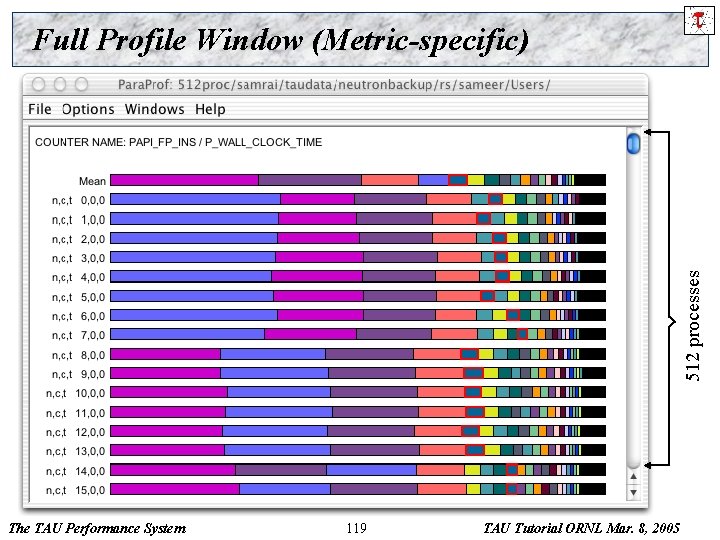
512 processes Full Profile Window (Metric-specific) The TAU Performance System 119 TAU Tutorial ORNL Mar. 8, 2005

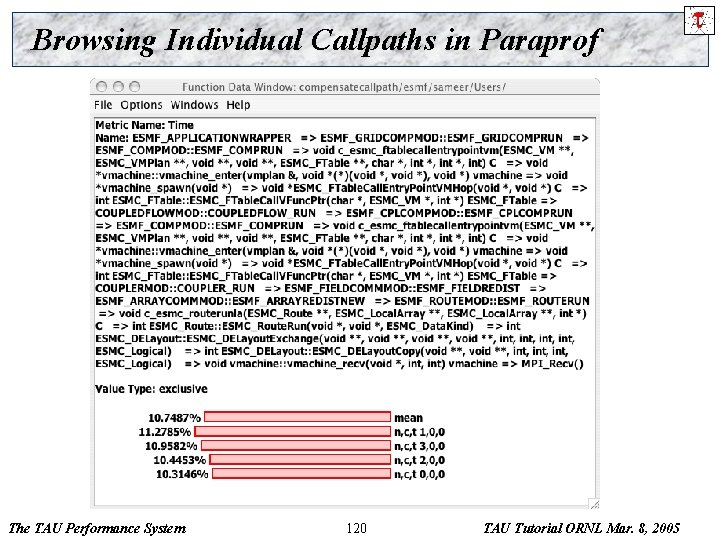
Browsing Individual Callpaths in Paraprof The TAU Performance System 120 TAU Tutorial ORNL Mar. 8, 2005

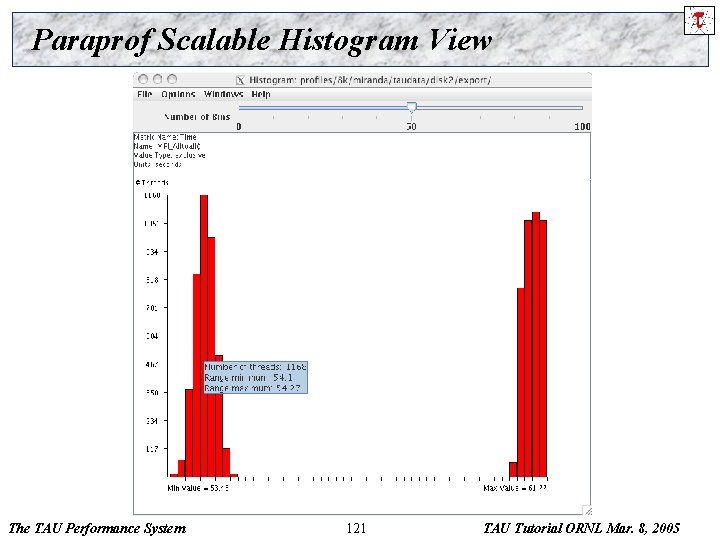
Paraprof Scalable Histogram View The TAU Performance System 121 TAU Tutorial ORNL Mar. 8, 2005

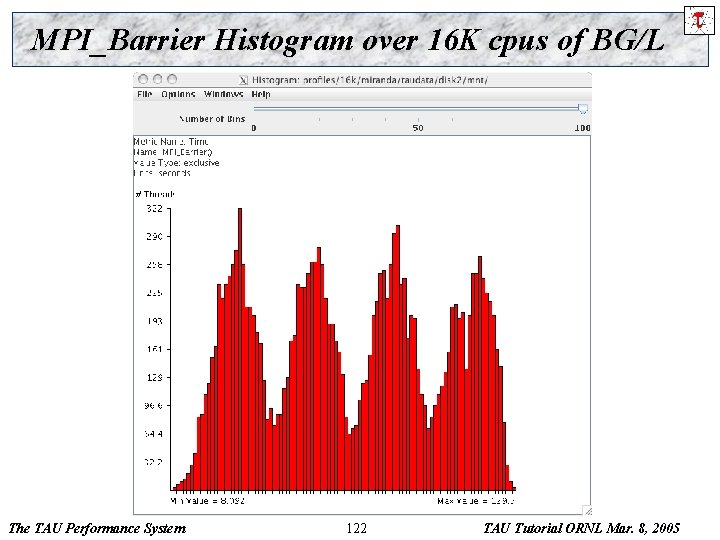
MPI_Barrier Histogram over 16 K cpus of BG/L The TAU Performance System 122 TAU Tutorial ORNL Mar. 8, 2005
![CUBE UTK FZJ Browser Sept 2004 The TAU Performance System 123 TAU Tutorial ORNL CUBE (UTK, FZJ) Browser [Sept. 2004] The TAU Performance System 123 TAU Tutorial ORNL](https://slidetodoc.com/presentation_image_h2/fd210204103b913623bfa6bc29bb02ec/image-121.jpg)
CUBE (UTK, FZJ) Browser [Sept. 2004] The TAU Performance System 123 TAU Tutorial ORNL Mar. 8, 2005

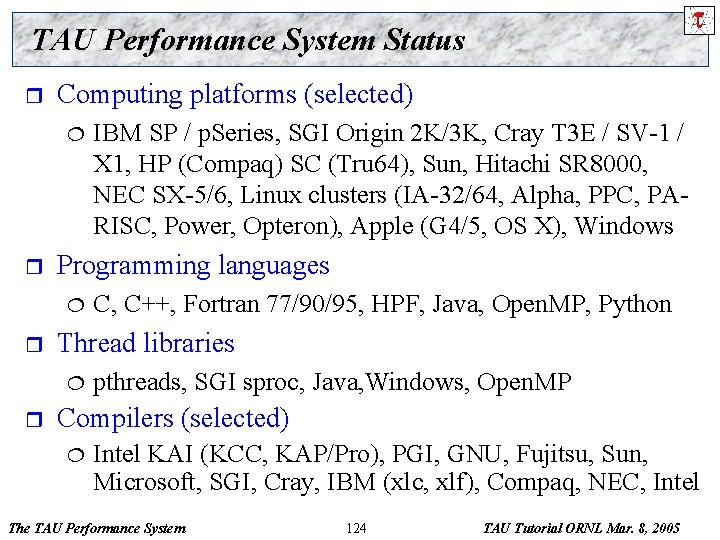
TAU Performance System Status r Computing platforms (selected) ¦ r Programming languages ¦ r C, C++, Fortran 77/90/95, HPF, Java, Open. MP, Python Thread libraries ¦ r IBM SP / p. Series, SGI Origin 2 K/3 K, Cray T 3 E / SV-1 / X 1, HP (Compaq) SC (Tru 64), Sun, Hitachi SR 8000, NEC SX-5/6, Linux clusters (IA-32/64, Alpha, PPC, PARISC, Power, Opteron), Apple (G 4/5, OS X), Windows pthreads, SGI sproc, Java, Windows, Open. MP Compilers (selected) ¦ Intel KAI (KCC, KAP/Pro), PGI, GNU, Fujitsu, Sun, Microsoft, SGI, Cray, IBM (xlc, xlf), Compaq, NEC, Intel The TAU Performance System 124 TAU Tutorial ORNL Mar. 8, 2005

Concluding Remarks Complex parallel systems and software pose challenging performance analysis problems that require robust methodologies and tools r To build more sophisticated performance tools, existing proven performance technology must be utilized r Performance tools must be integrated with software and systems models and technology r Performance engineered software ¦ Function consistently and coherently in software and system environments ¦ r TAU performance system offers robust performance technology that can be broadly integrated The TAU Performance System 125 TAU Tutorial ORNL Mar. 8, 2005

Support Acknowledgements r r Department of Energy (DOE) ¦ Office of Science contracts ¦ University of Utah DOE ASCI Level 1 sub-contract ¦ DOE ASC/NNSA Level 3 contract NSF Software and Tools for High-End Computing Grant Research Centre Juelich ¦ John von Neumann Institute for Computing ¦ Dr. Bernd Mohr Los Alamos National Laboratory The TAU Performance System 126 TAU Tutorial ORNL Mar. 8, 2005