The TAU Performance System Allen D Malony malonycs
![TAU Measurement System Configuration r configure [OPTIONS] {-c++=<CC>, -cc=<cc>} Specify C++ and C compilers TAU Measurement System Configuration r configure [OPTIONS] {-c++=<CC>, -cc=<cc>} Specify C++ and C compilers](https://slidetodoc.com/presentation_image_h2/a91d52fc4a0c0bf3706ac079fb4b5f31/image-21.jpg)
![Pprof Command pprof [-c|-b|-m|-t|-e|-i] [-r] [-s] [-n num] [-f file] [-l] [nodes] ¦ -c Pprof Command pprof [-c|-b|-m|-t|-e|-i] [-r] [-s] [-n num] [-f file] [-l] [nodes] ¦ -c](https://slidetodoc.com/presentation_image_h2/a91d52fc4a0c0bf3706ac079fb4b5f31/image-25.jpg)
![Hypothetical Mapping Example q Particles distributed on surfaces of a cube Particle* P[MAX]; /* Hypothetical Mapping Example q Particles distributed on surfaces of a cube Particle* P[MAX]; /*](https://slidetodoc.com/presentation_image_h2/a91d52fc4a0c0bf3706ac079fb4b5f31/image-35.jpg)
- Slides: 48

The TAU Performance System Allen D. Malony malony@cs. uoregon. edu Department of Computer and Information Science Computational Science Institute University of Oregon

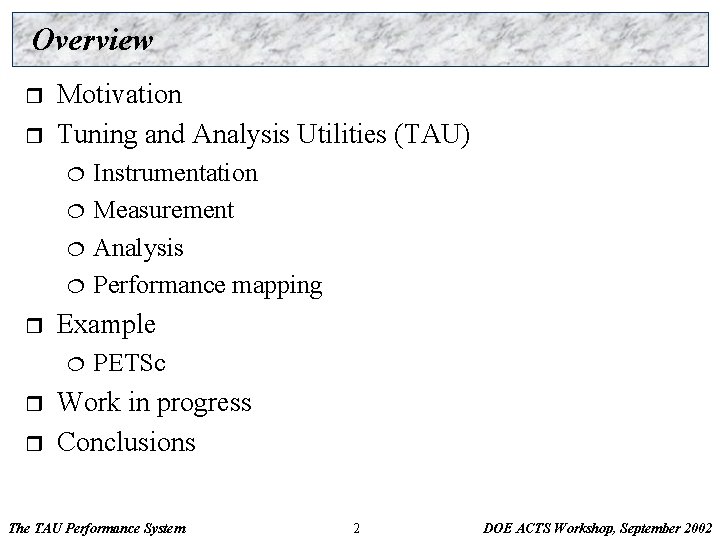
Overview r r Motivation Tuning and Analysis Utilities (TAU) ¦ ¦ r Example ¦ r r Instrumentation Measurement Analysis Performance mapping PETSc Work in progress Conclusions The TAU Performance System 2 DOE ACTS Workshop, September 2002

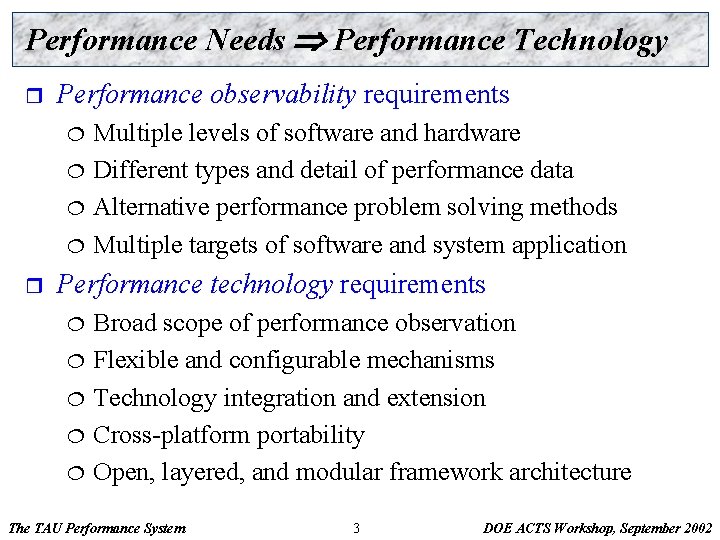
Performance Needs Performance Technology r Performance observability requirements ¦ ¦ r Multiple levels of software and hardware Different types and detail of performance data Alternative performance problem solving methods Multiple targets of software and system application Performance technology requirements ¦ ¦ ¦ Broad scope of performance observation Flexible and configurable mechanisms Technology integration and extension Cross-platform portability Open, layered, and modular framework architecture The TAU Performance System 3 DOE ACTS Workshop, September 2002

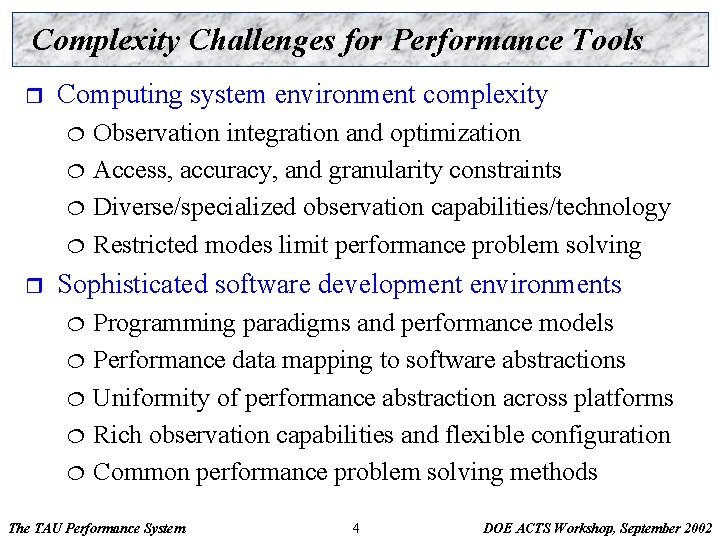
Complexity Challenges for Performance Tools r Computing system environment complexity ¦ ¦ r Observation integration and optimization Access, accuracy, and granularity constraints Diverse/specialized observation capabilities/technology Restricted modes limit performance problem solving Sophisticated software development environments ¦ ¦ ¦ Programming paradigms and performance models Performance data mapping to software abstractions Uniformity of performance abstraction across platforms Rich observation capabilities and flexible configuration Common performance problem solving methods The TAU Performance System 4 DOE ACTS Workshop, September 2002

General Problems (Performance Technology) How do we create robust and ubiquitous performance technology for the analysis and tuning of parallel and distributed software and systems in the presence of (evolving) complexity challenges? How do we apply performance technology effectively for the variety and diversity of performance problems that arise in the context of complex parallel and distributed computer systems? The TAU Performance System 5 DOE ACTS Workshop, September 2002

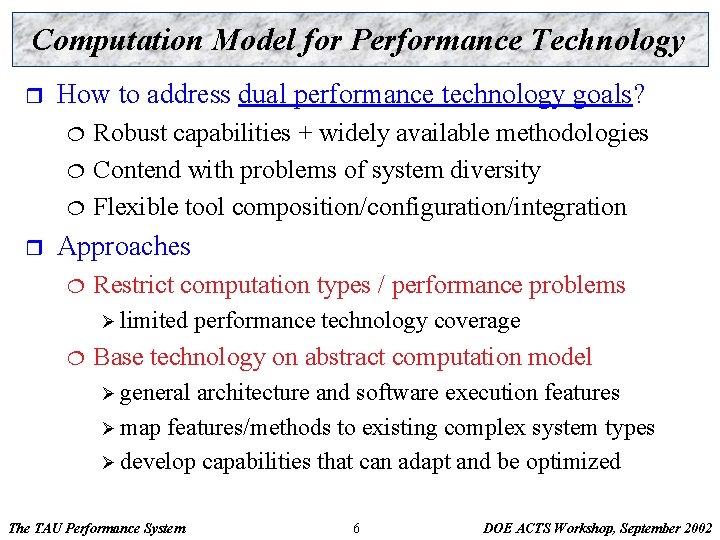
Computation Model for Performance Technology r How to address dual performance technology goals? ¦ ¦ ¦ r Robust capabilities + widely available methodologies Contend with problems of system diversity Flexible tool composition/configuration/integration Approaches ¦ Restrict computation types / performance problems Ø limited ¦ performance technology coverage Base technology on abstract computation model Ø general architecture and software execution features Ø map features/methods to existing complex system types Ø develop capabilities that can adapt and be optimized The TAU Performance System 6 DOE ACTS Workshop, September 2002

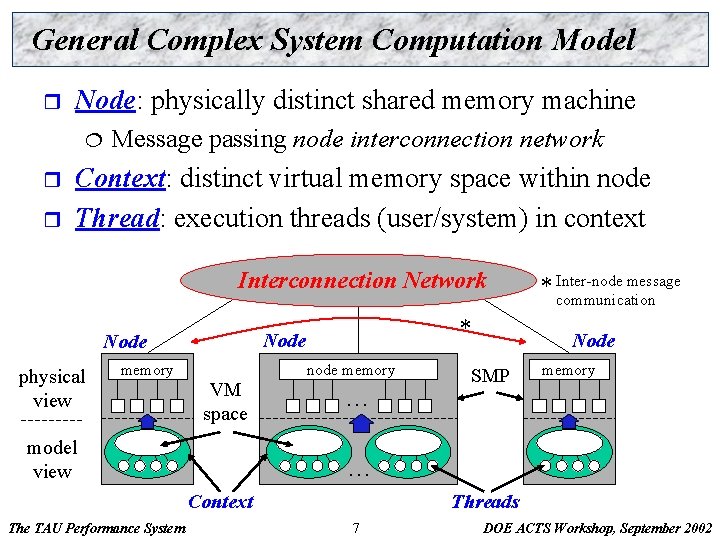
General Complex System Computation Model r Node: physically distinct shared memory machine ¦ r r Message passing node interconnection network Context: distinct virtual memory space within node Thread: execution threads (user/system) in context Interconnection Network physical view memory * Node VM space model view node memory … Node SMP memory … Context The TAU Performance System message * Inter-node communication Threads 7 DOE ACTS Workshop, September 2002

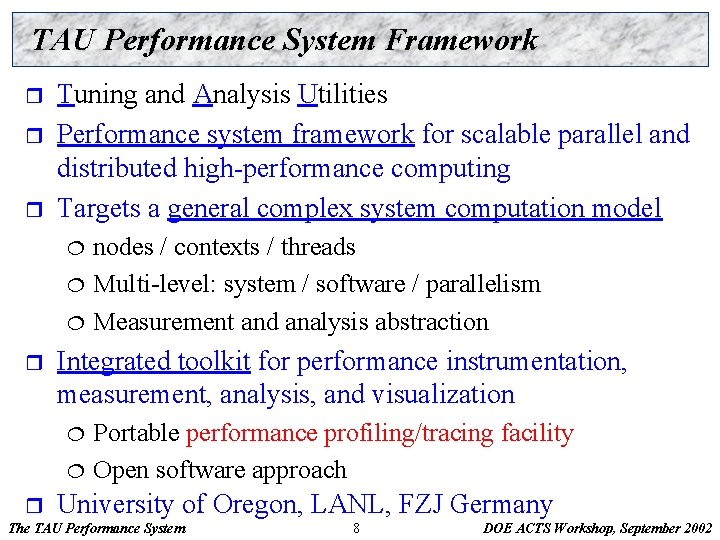
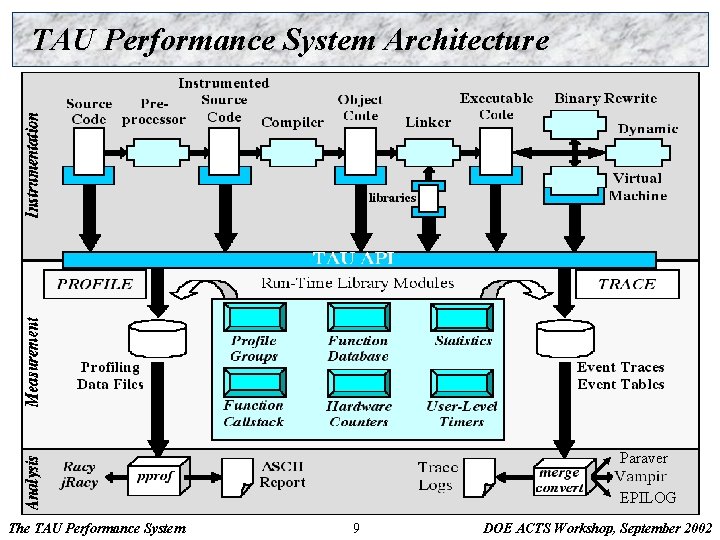
TAU Performance System Framework r r r Tuning and Analysis Utilities Performance system framework for scalable parallel and distributed high-performance computing Targets a general complex system computation model ¦ ¦ ¦ r Integrated toolkit for performance instrumentation, measurement, analysis, and visualization ¦ ¦ r nodes / contexts / threads Multi-level: system / software / parallelism Measurement and analysis abstraction Portable performance profiling/tracing facility Open software approach University of Oregon, LANL, FZJ Germany The TAU Performance System 8 DOE ACTS Workshop, September 2002

TAU Performance System Architecture Paraver EPILOG The TAU Performance System 9 DOE ACTS Workshop, September 2002

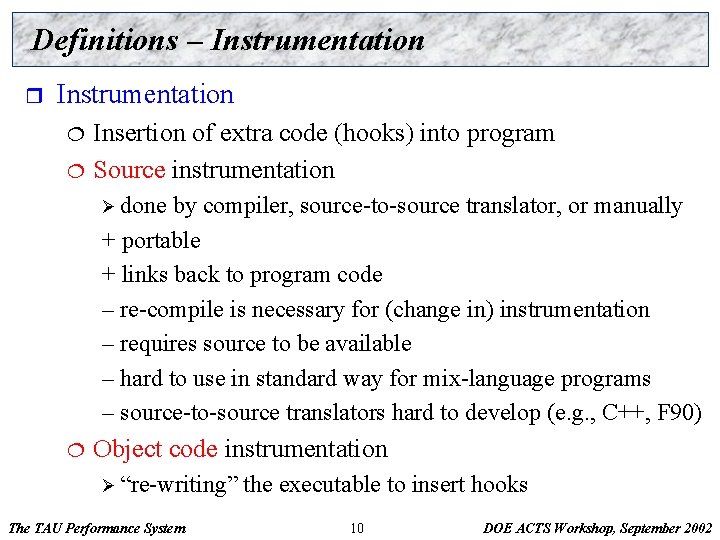
Definitions – Instrumentation r Instrumentation ¦ ¦ Insertion of extra code (hooks) into program Source instrumentation Ø done by compiler, source-to-source translator, or manually + portable + links back to program code – re-compile is necessary for (change in) instrumentation – requires source to be available – hard to use in standard way for mix-language programs – source-to-source translators hard to develop (e. g. , C++, F 90) ¦ Object code instrumentation Ø “re-writing” The TAU Performance System the executable to insert hooks 10 DOE ACTS Workshop, September 2002

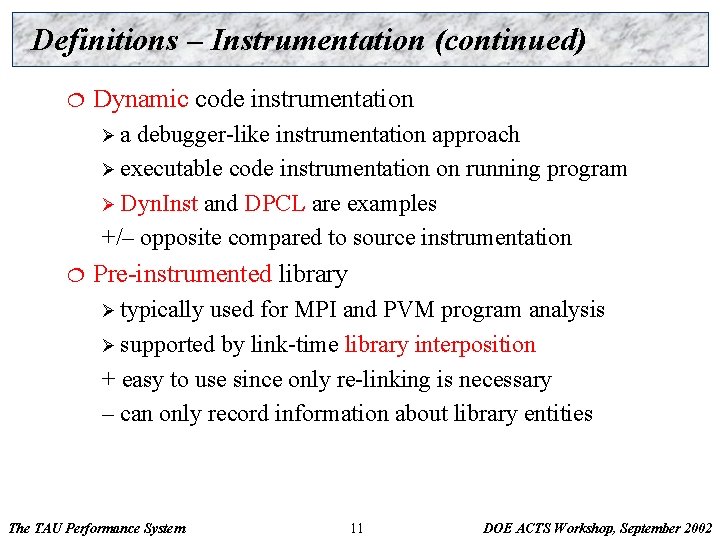
Definitions – Instrumentation (continued) ¦ Dynamic code instrumentation Øa debugger-like instrumentation approach Ø executable code instrumentation on running program Ø Dyn. Inst and DPCL are examples +/– opposite compared to source instrumentation ¦ Pre-instrumented library Ø typically used for MPI and PVM program analysis Ø supported by link-time library interposition + easy to use since only re-linking is necessary – can only record information about library entities The TAU Performance System 11 DOE ACTS Workshop, September 2002

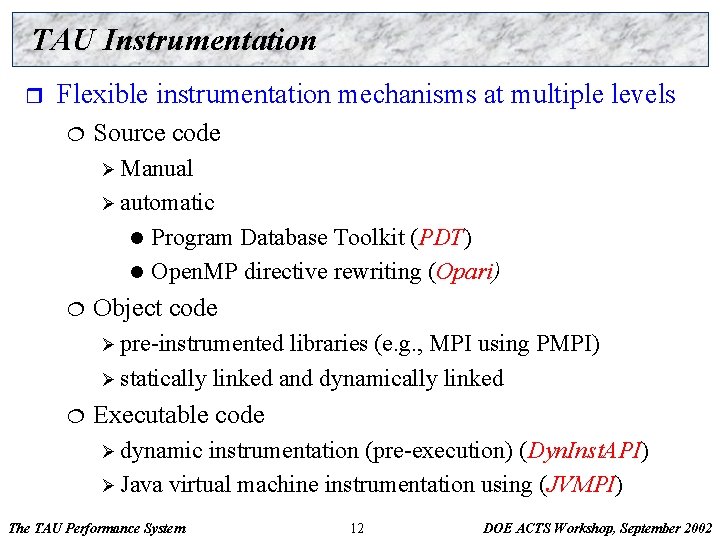
TAU Instrumentation r Flexible instrumentation mechanisms at multiple levels ¦ Source code Ø Manual Ø automatic Program Database Toolkit (PDT) l Open. MP directive rewriting (Opari) l ¦ Object code Ø pre-instrumented libraries (e. g. , MPI using PMPI) Ø statically linked and dynamically linked ¦ Executable code Ø dynamic instrumentation (pre-execution) (Dyn. Inst. API) Ø Java virtual machine instrumentation using (JVMPI) The TAU Performance System 12 DOE ACTS Workshop, September 2002

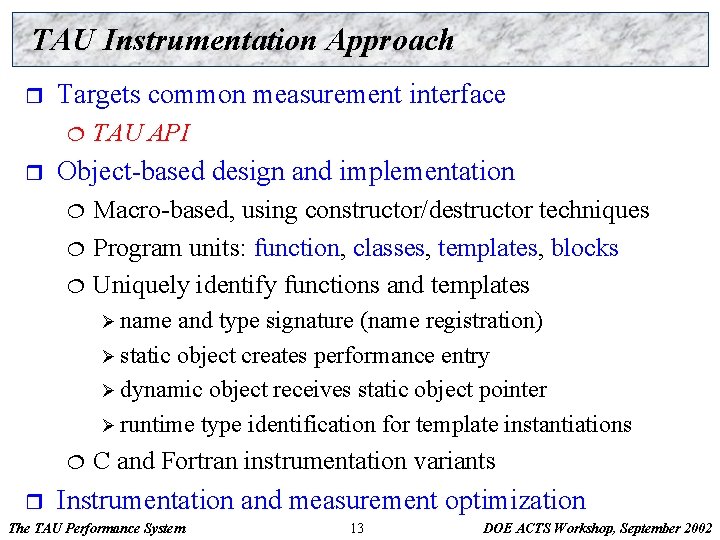
TAU Instrumentation Approach r Targets common measurement interface ¦ r TAU API Object-based design and implementation ¦ ¦ ¦ Macro-based, using constructor/destructor techniques Program units: function, classes, templates, blocks Uniquely identify functions and templates Ø name and type signature (name registration) Ø static object creates performance entry Ø dynamic object receives static object pointer Ø runtime type identification for template instantiations ¦ r C and Fortran instrumentation variants Instrumentation and measurement optimization The TAU Performance System 13 DOE ACTS Workshop, September 2002

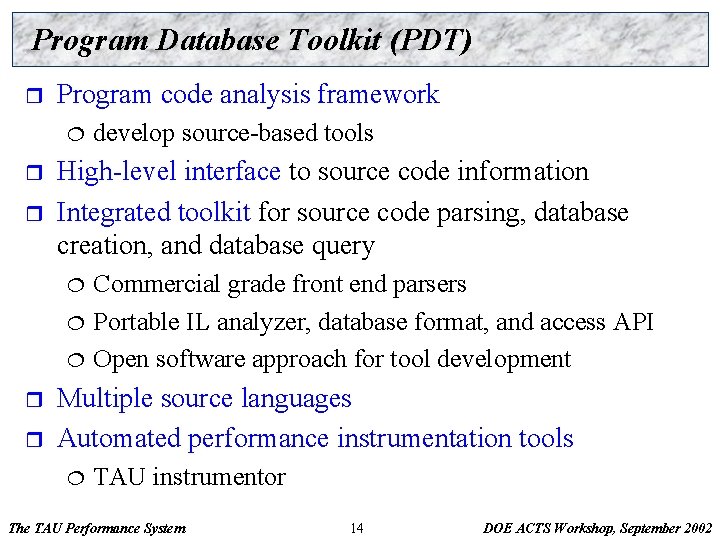
Program Database Toolkit (PDT) r Program code analysis framework ¦ r r High-level interface to source code information Integrated toolkit for source code parsing, database creation, and database query ¦ ¦ ¦ r r develop source-based tools Commercial grade front end parsers Portable IL analyzer, database format, and access API Open software approach for tool development Multiple source languages Automated performance instrumentation tools ¦ TAU instrumentor The TAU Performance System 14 DOE ACTS Workshop, September 2002

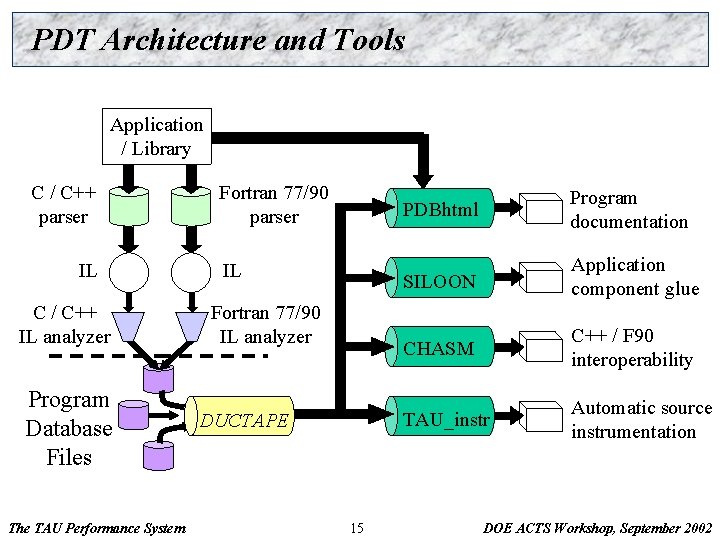
PDT Architecture and Tools Application / Library C / C++ parser IL C / C++ IL analyzer Program Database Files The TAU Performance System Fortran 77/90 parser IL Fortran 77/90 IL analyzer DUCTAPE 15 PDBhtml Program documentation SILOON Application component glue CHASM C++ / F 90 interoperability TAU_instr Automatic source instrumentation DOE ACTS Workshop, September 2002

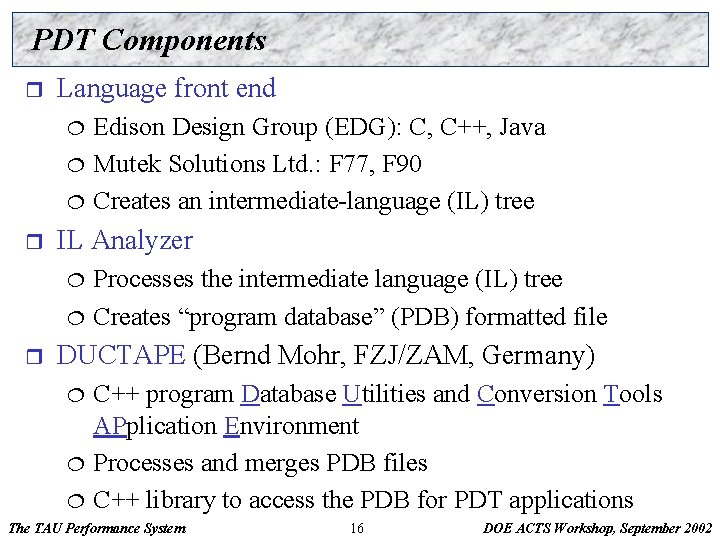
PDT Components r Language front end ¦ ¦ ¦ r IL Analyzer ¦ ¦ r Edison Design Group (EDG): C, C++, Java Mutek Solutions Ltd. : F 77, F 90 Creates an intermediate-language (IL) tree Processes the intermediate language (IL) tree Creates “program database” (PDB) formatted file DUCTAPE (Bernd Mohr, FZJ/ZAM, Germany) ¦ ¦ ¦ C++ program Database Utilities and Conversion Tools APplication Environment Processes and merges PDB files C++ library to access the PDB for PDT applications The TAU Performance System 16 DOE ACTS Workshop, September 2002

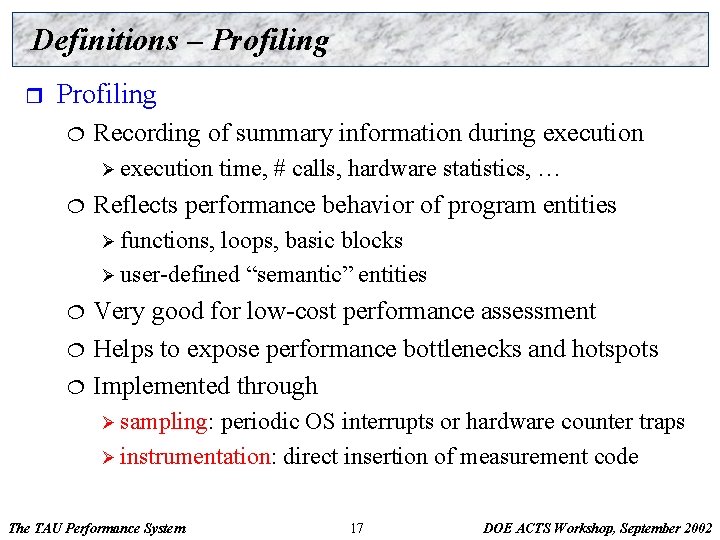
Definitions – Profiling r Profiling ¦ Recording of summary information during execution Ø execution ¦ time, # calls, hardware statistics, … Reflects performance behavior of program entities Ø functions, loops, basic blocks Ø user-defined “semantic” entities ¦ ¦ ¦ Very good for low-cost performance assessment Helps to expose performance bottlenecks and hotspots Implemented through Ø sampling: periodic OS interrupts or hardware counter traps Ø instrumentation: direct insertion of measurement code The TAU Performance System 17 DOE ACTS Workshop, September 2002

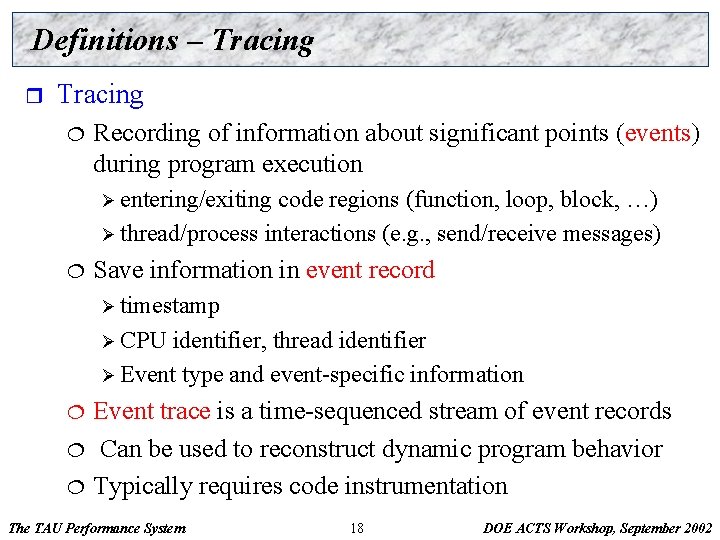
Definitions – Tracing r Tracing ¦ Recording of information about significant points (events) during program execution Ø entering/exiting code regions (function, loop, block, …) Ø thread/process interactions (e. g. , send/receive messages) ¦ Save information in event record Ø timestamp Ø CPU identifier, thread identifier Ø Event type and event-specific information ¦ ¦ ¦ Event trace is a time-sequenced stream of event records Can be used to reconstruct dynamic program behavior Typically requires code instrumentation The TAU Performance System 18 DOE ACTS Workshop, September 2002

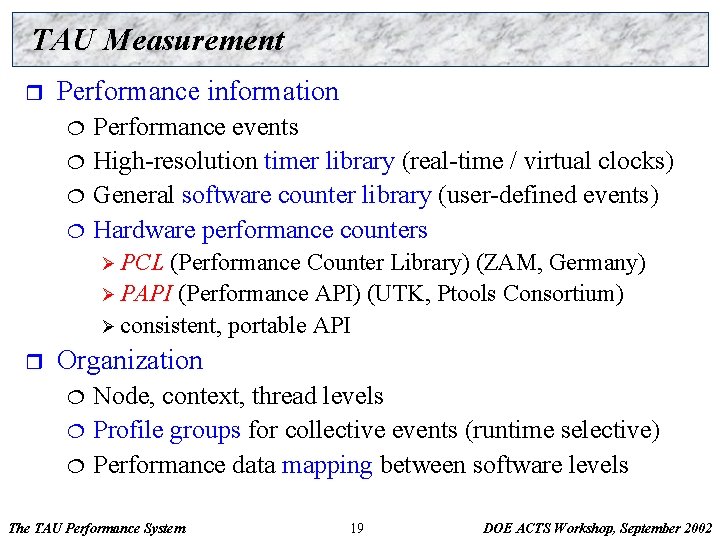
TAU Measurement r Performance information ¦ ¦ Performance events High-resolution timer library (real-time / virtual clocks) General software counter library (user-defined events) Hardware performance counters Ø PCL (Performance Counter Library) (ZAM, Germany) Ø PAPI (Performance API) (UTK, Ptools Consortium) Ø consistent, portable API r Organization ¦ ¦ ¦ Node, context, thread levels Profile groups for collective events (runtime selective) Performance data mapping between software levels The TAU Performance System 19 DOE ACTS Workshop, September 2002

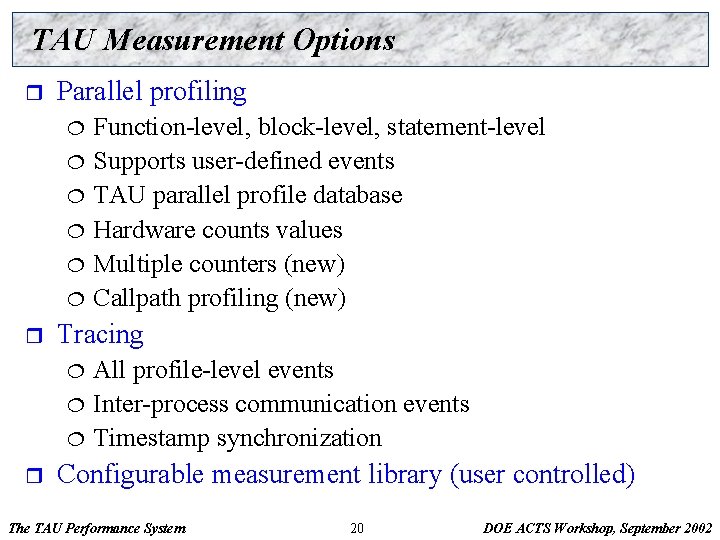
TAU Measurement Options r Parallel profiling ¦ ¦ ¦ r Tracing ¦ ¦ ¦ r Function-level, block-level, statement-level Supports user-defined events TAU parallel profile database Hardware counts values Multiple counters (new) Callpath profiling (new) All profile-level events Inter-process communication events Timestamp synchronization Configurable measurement library (user controlled) The TAU Performance System 20 DOE ACTS Workshop, September 2002
![TAU Measurement System Configuration r configure OPTIONS cCC cccc Specify C and C compilers TAU Measurement System Configuration r configure [OPTIONS] {-c++=<CC>, -cc=<cc>} Specify C++ and C compilers](https://slidetodoc.com/presentation_image_h2/a91d52fc4a0c0bf3706ac079fb4b5f31/image-21.jpg)
TAU Measurement System Configuration r configure [OPTIONS] {-c++=<CC>, -cc=<cc>} Specify C++ and C compilers ¦ {-pthread, -sproc , -smarts} Use pthread, SGI sproc, smarts threads ¦ -openmp Use Open. MP threads ¦ -opari=<dir> Specify location of Opari Open. MP tool ¦ {-papi , -pcl=<dir> Specify location of PAPI or PCL ¦ -pdt=<dir> Specify location of PDT ¦ {-mpiinc=<d>, mpilib=<d>} Specify MPI library instrumentation ¦ -TRACE Generate TAU event traces ¦ -PROFILE Generate TAU profiles ¦ -PROFILECALLPATH Generate Callpath profiles (1 -level) ¦ -MULTIPLECOUNTERS Use more than one hardware counter ¦ -CPUTIME Use usertime+system time ¦ The TAU Performance System 21 DOE ACTS Workshop, September 2002

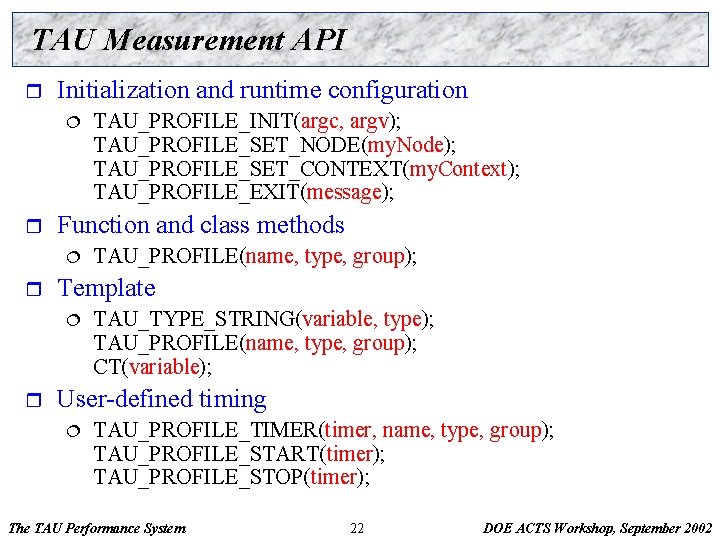
TAU Measurement API r Initialization and runtime configuration ¦ r Function and class methods ¦ r TAU_PROFILE(name, type, group); Template ¦ r TAU_PROFILE_INIT(argc, argv); TAU_PROFILE_SET_NODE(my. Node); TAU_PROFILE_SET_CONTEXT(my. Context); TAU_PROFILE_EXIT(message); TAU_TYPE_STRING(variable, type); TAU_PROFILE(name, type, group); CT(variable); User-defined timing ¦ TAU_PROFILE_TIMER(timer, name, type, group); TAU_PROFILE_START(timer); TAU_PROFILE_STOP(timer); The TAU Performance System 22 DOE ACTS Workshop, September 2002

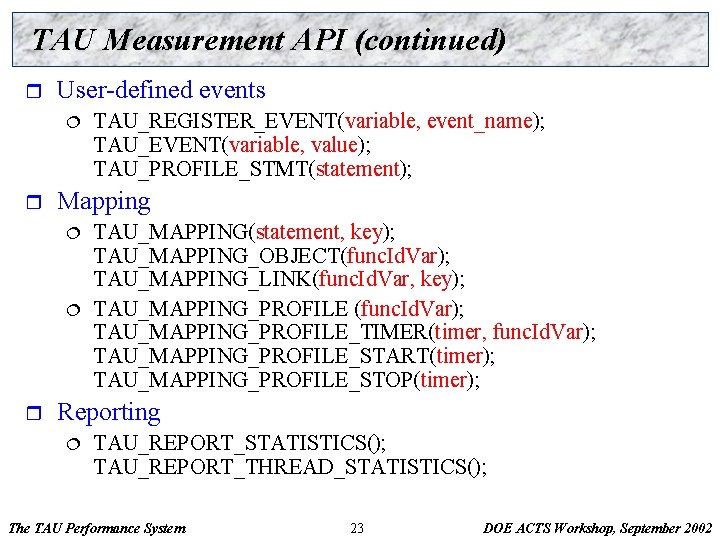
TAU Measurement API (continued) r User-defined events ¦ r Mapping ¦ ¦ r TAU_REGISTER_EVENT(variable, event_name); TAU_EVENT(variable, value); TAU_PROFILE_STMT(statement); TAU_MAPPING(statement, key); TAU_MAPPING_OBJECT(func. Id. Var); TAU_MAPPING_LINK(func. Id. Var, key); TAU_MAPPING_PROFILE (func. Id. Var); TAU_MAPPING_PROFILE_TIMER(timer, func. Id. Var); TAU_MAPPING_PROFILE_START(timer); TAU_MAPPING_PROFILE_STOP(timer); Reporting ¦ TAU_REPORT_STATISTICS(); TAU_REPORT_THREAD_STATISTICS(); The TAU Performance System 23 DOE ACTS Workshop, September 2002

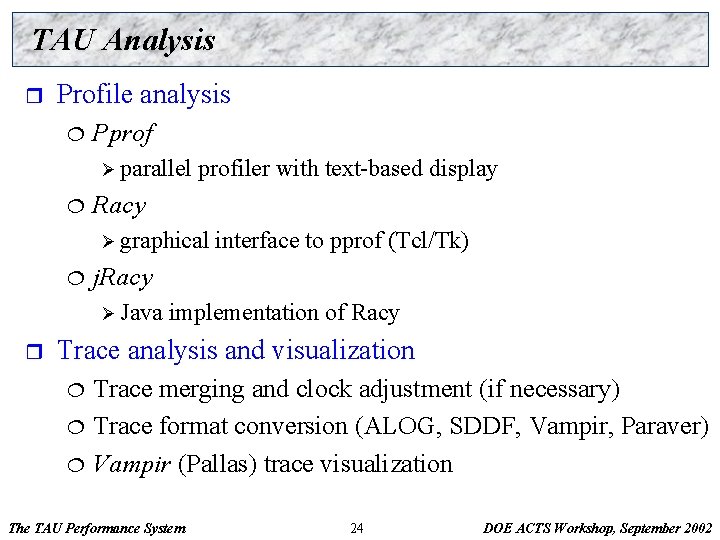
TAU Analysis r Profile analysis ¦ Pprof Ø parallel ¦ profiler with text-based display Racy Ø graphical ¦ j. Racy Ø Java r interface to pprof (Tcl/Tk) implementation of Racy Trace analysis and visualization ¦ ¦ ¦ Trace merging and clock adjustment (if necessary) Trace format conversion (ALOG, SDDF, Vampir, Paraver) Vampir (Pallas) trace visualization The TAU Performance System 24 DOE ACTS Workshop, September 2002
![Pprof Command pprof cbmtei r s n num f file l nodes c Pprof Command pprof [-c|-b|-m|-t|-e|-i] [-r] [-s] [-n num] [-f file] [-l] [nodes] ¦ -c](https://slidetodoc.com/presentation_image_h2/a91d52fc4a0c0bf3706ac079fb4b5f31/image-25.jpg)
Pprof Command pprof [-c|-b|-m|-t|-e|-i] [-r] [-s] [-n num] [-f file] [-l] [nodes] ¦ -c Sort according to number of calls ¦ -b Sort according to number of subroutines called ¦ -m Sort according to msecs (exclusive time total) ¦ -t Sort according to total msecs (inclusive time total) ¦ -e Sort according to exclusive time per call ¦ -i Sort according to inclusive time per call ¦ -v Sort according to standard deviation (exclusive usec) ¦ -r Reverse sorting order ¦ -s Print only summary profile information ¦ -n num Print only first number of functions ¦ -f file Specify full path and filename without node ids ¦ -l nodes List all functions and exit (prints only info about all contexts/threads of given node numbers)DOE ACTS Workshop, September 2002 The TAU Performance System 25 r

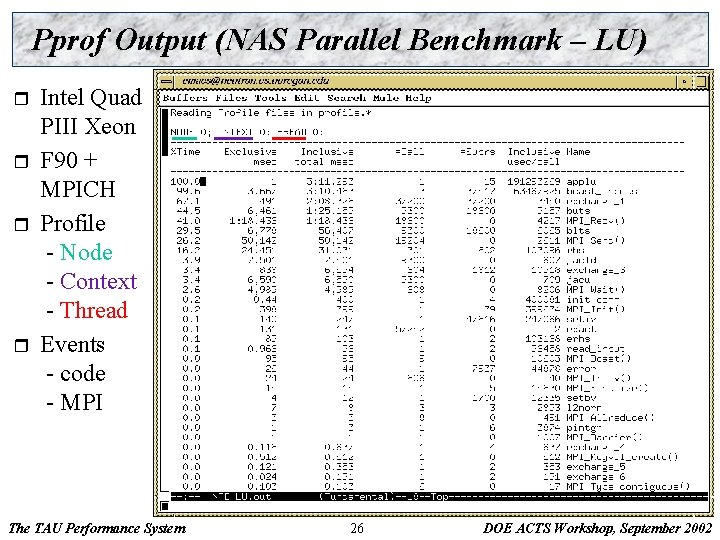
Pprof Output (NAS Parallel Benchmark – LU) r r Intel Quad PIII Xeon F 90 + MPICH Profile - Node - Context - Thread Events - code - MPI The TAU Performance System 26 DOE ACTS Workshop, September 2002

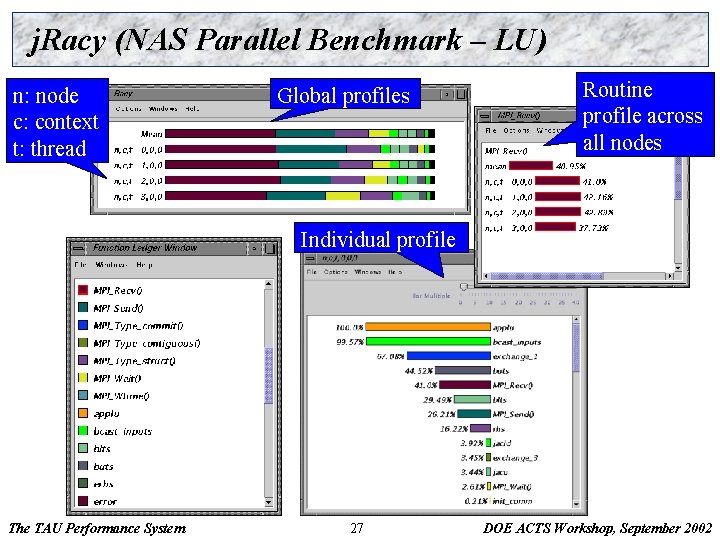
j. Racy (NAS Parallel Benchmark – LU) n: node c: context t: thread Global profiles Routine profile across all nodes Individual profile The TAU Performance System 27 DOE ACTS Workshop, September 2002

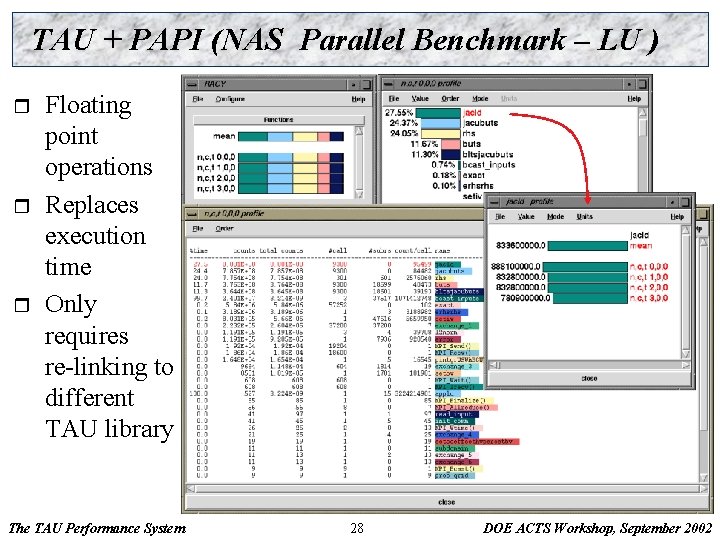
TAU + PAPI (NAS Parallel Benchmark – LU ) r r r Floating point operations Replaces execution time Only requires re-linking to different TAU library The TAU Performance System 28 DOE ACTS Workshop, September 2002

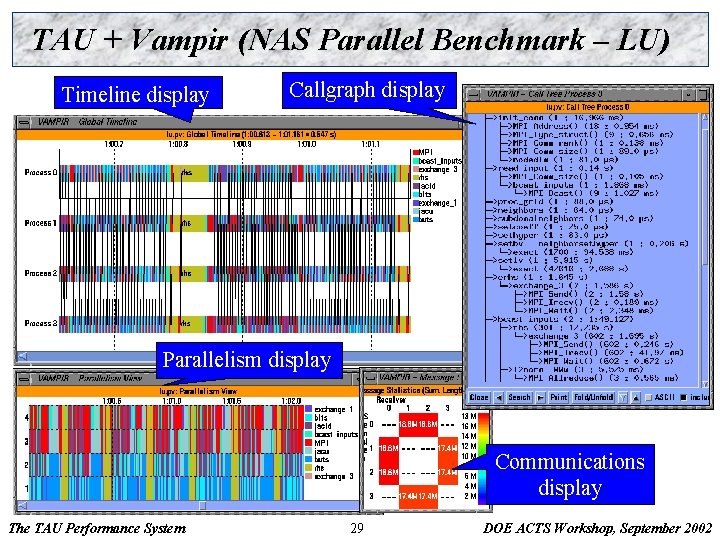
TAU + Vampir (NAS Parallel Benchmark – LU) Timeline display Callgraph display Parallelism display Communications display The TAU Performance System 29 DOE ACTS Workshop, September 2002

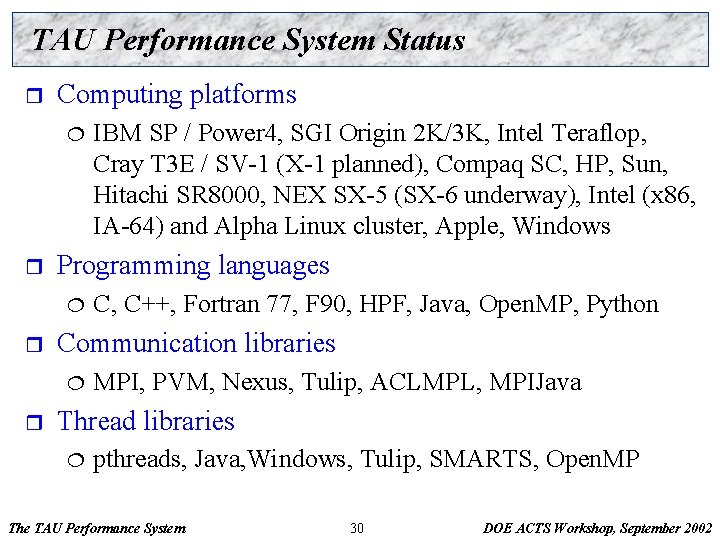
TAU Performance System Status r Computing platforms ¦ r Programming languages ¦ r C, C++, Fortran 77, F 90, HPF, Java, Open. MP, Python Communication libraries ¦ r IBM SP / Power 4, SGI Origin 2 K/3 K, Intel Teraflop, Cray T 3 E / SV-1 (X-1 planned), Compaq SC, HP, Sun, Hitachi SR 8000, NEX SX-5 (SX-6 underway), Intel (x 86, IA-64) and Alpha Linux cluster, Apple, Windows MPI, PVM, Nexus, Tulip, ACLMPL, MPIJava Thread libraries ¦ pthreads, Java, Windows, Tulip, SMARTS, Open. MP The TAU Performance System 30 DOE ACTS Workshop, September 2002

TAU Performance System Status (continued) r Compilers ¦ r Application libraries ¦ r POOMA, POOMA-2, MC++, Conejo, Uintah, VTF, UPS Projects ¦ r Blitz++, A++/P++, ACLVIS, PAWS, SAMRAI, Overture Application frameworks ¦ r KAI, PGI, GNU, Fujitsu, Sun, Microsoft, SGI, Cray, IBM, Compaq Aurora / SCALEA: ACPC, University of Vienna TAU full distribution (Version 2. 1 x, web download) ¦ ¦ ¦ Measurement library and profile analysis tools Automatic software installation and examples TAU User’s Guide The TAU Performance System 31 DOE ACTS Workshop, September 2002

PDT Status r Program Database Toolkit (Version 2. 1, web download) ¦ ¦ ¦ r PDT-constructed tools ¦ ¦ r EDG C++ front end (Version 2. 45. 2) Mutek Fortran 90 front end (Version 2. 4. 1) C++ and Fortran 90 IL Analyzer DUCTAPE library Standard C++ system header files (KCC Version 4. 0 f) TAU instrumentor (C/C++/F 90) Program analysis support for SILOON and CHASM Platforms ¦ SGI, IBM, Compaq, SUN, HP, Linux (IA 32/IA 64), Apple, Windows, Cray T 3 E, Hitachi The TAU Performance System 32 DOE ACTS Workshop, September 2002

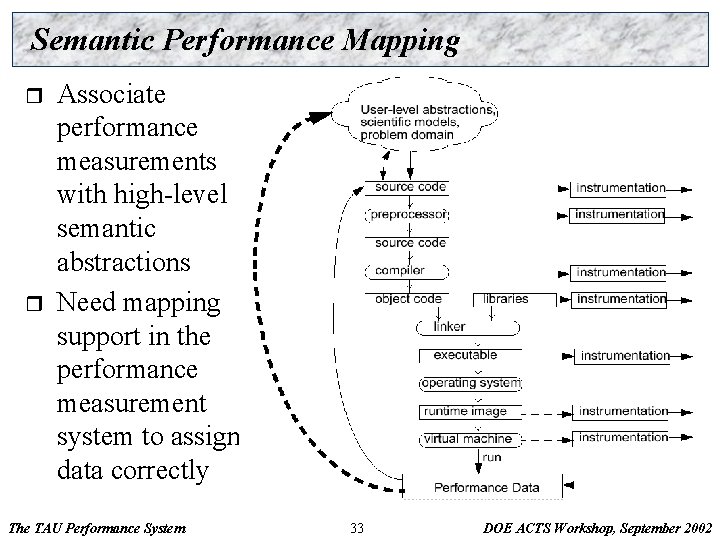
Semantic Performance Mapping r r Associate performance measurements with high-level semantic abstractions Need mapping support in the performance measurement system to assign data correctly The TAU Performance System 33 DOE ACTS Workshop, September 2002

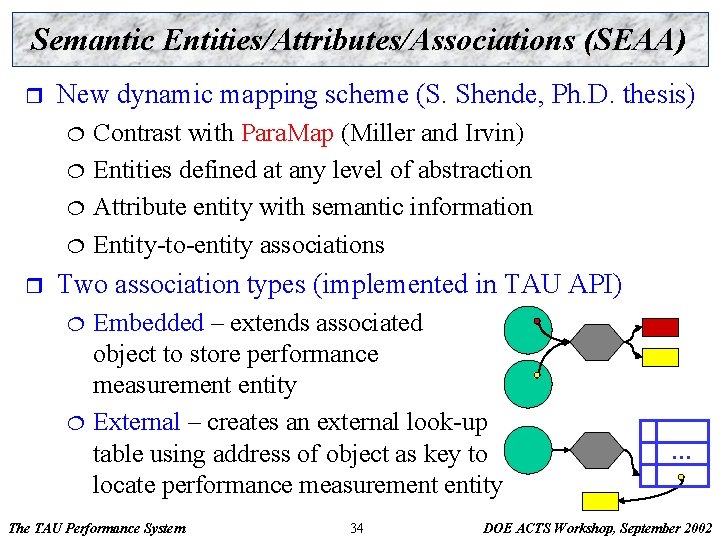
Semantic Entities/Attributes/Associations (SEAA) r New dynamic mapping scheme (S. Shende, Ph. D. thesis) ¦ ¦ r Contrast with Para. Map (Miller and Irvin) Entities defined at any level of abstraction Attribute entity with semantic information Entity-to-entity associations Two association types (implemented in TAU API) ¦ ¦ Embedded – extends associated object to store performance measurement entity External – creates an external look-up table using address of object as key to locate performance measurement entity The TAU Performance System 34 … DOE ACTS Workshop, September 2002
![Hypothetical Mapping Example q Particles distributed on surfaces of a cube Particle PMAX Hypothetical Mapping Example q Particles distributed on surfaces of a cube Particle* P[MAX]; /*](https://slidetodoc.com/presentation_image_h2/a91d52fc4a0c0bf3706ac079fb4b5f31/image-35.jpg)
Hypothetical Mapping Example q Particles distributed on surfaces of a cube Particle* P[MAX]; /* Array of particles */ int Generate. Particles() { /* distribute particles over all faces of the cube */ for (int face=0, last=0; face < 6; face++){ /* particles on this face */ int particles_on_this_face = num(face); for (int i=last; i < particles_on_this_face; i++) { /* particle properties are a function of face */ P[i] =. . . f(face); . . . } last+= particles_on_this_face; } } The TAU Performance System 35 DOE ACTS Workshop, September 2002

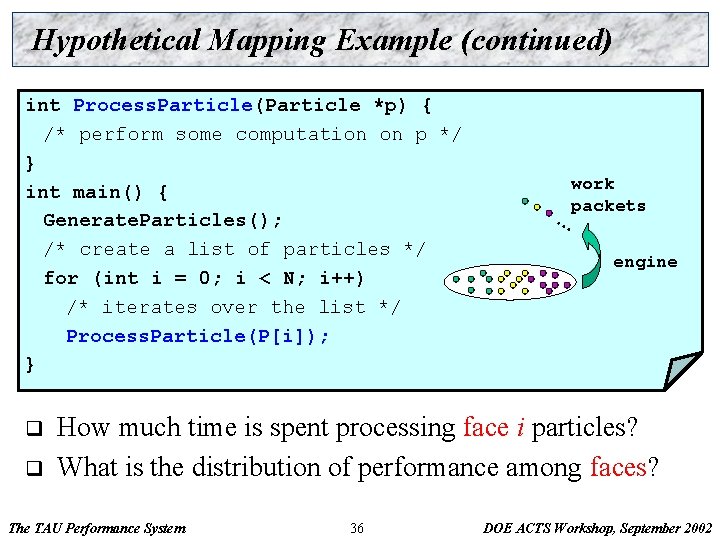
Hypothetical Mapping Example (continued) int Process. Particle(Particle *p) { /* perform some computation on p */ } int main() { Generate. Particles(); /* create a list of particles */ for (int i = 0; i < N; i++) /* iterates over the list */ Process. Particle(P[i]); } q q work packets … engine How much time is spent processing face i particles? What is the distribution of performance among faces? The TAU Performance System 36 DOE ACTS Workshop, September 2002

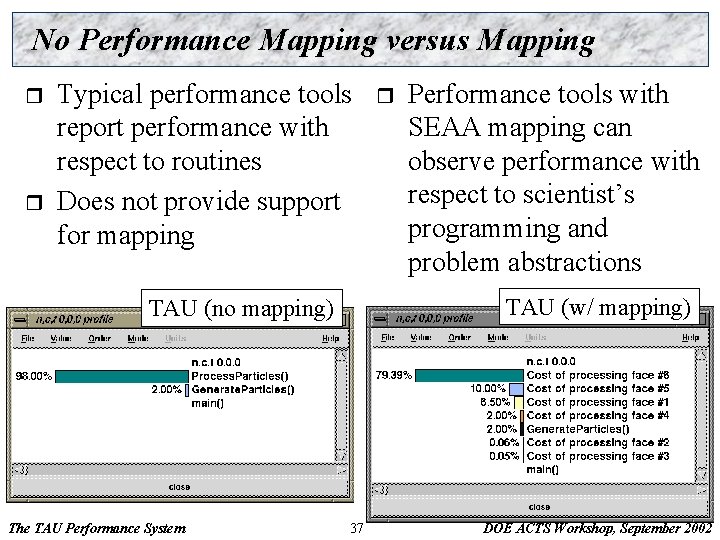
No Performance Mapping versus Mapping r r Typical performance tools report performance with respect to routines Does not provide support for mapping Performance tools with SEAA mapping can observe performance with respect to scientist’s programming and problem abstractions TAU (w/ mapping) TAU (no mapping) The TAU Performance System r 37 DOE ACTS Workshop, September 2002

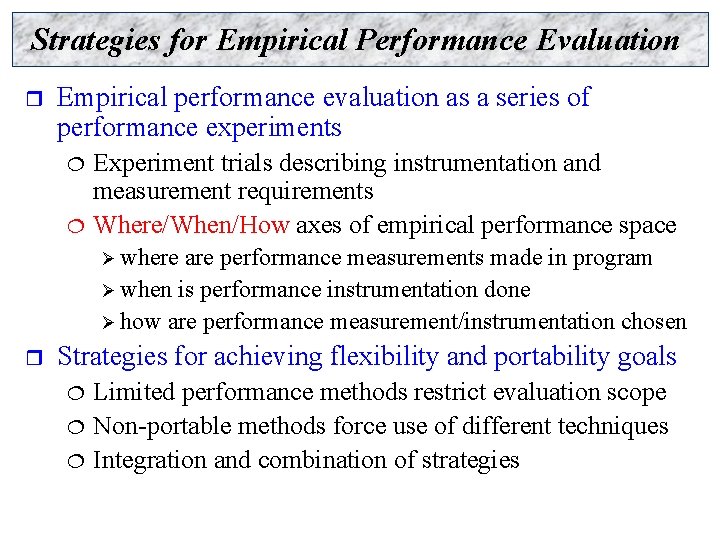
Strategies for Empirical Performance Evaluation r Empirical performance evaluation as a series of performance experiments ¦ ¦ Experiment trials describing instrumentation and measurement requirements Where/When/How axes of empirical performance space Ø where are performance measurements made in program Ø when is performance instrumentation done Ø how are performance measurement/instrumentation chosen r Strategies for achieving flexibility and portability goals ¦ ¦ ¦ Limited performance methods restrict evaluation scope Non-portable methods force use of different techniques Integration and combination of strategies

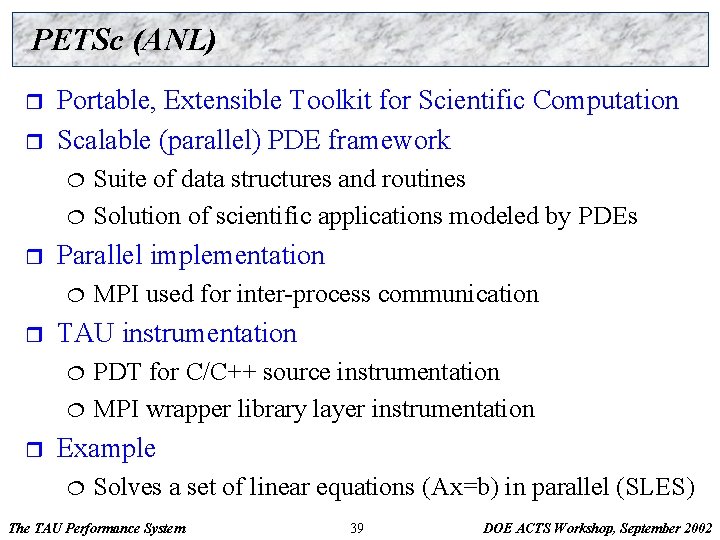
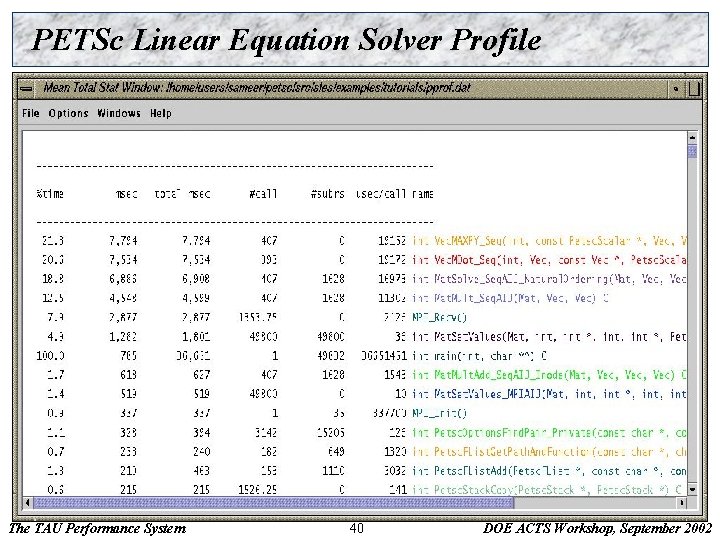
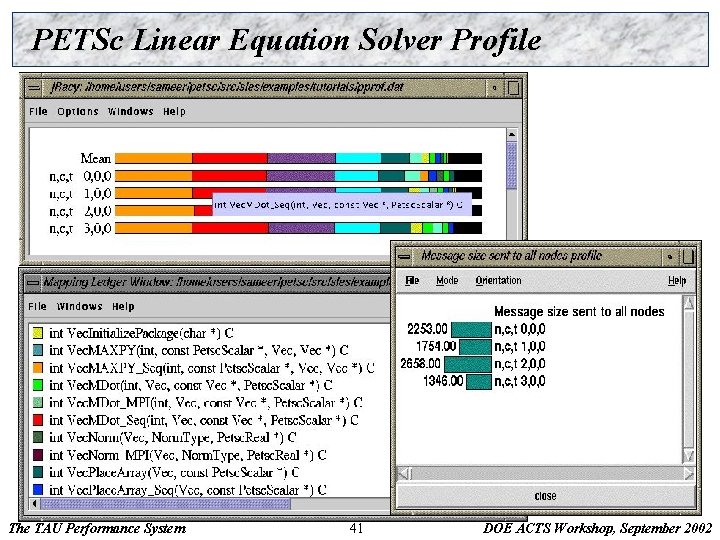
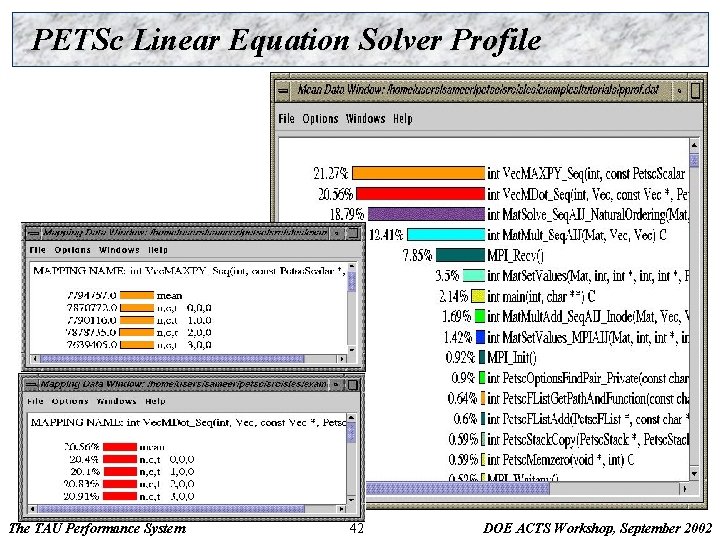
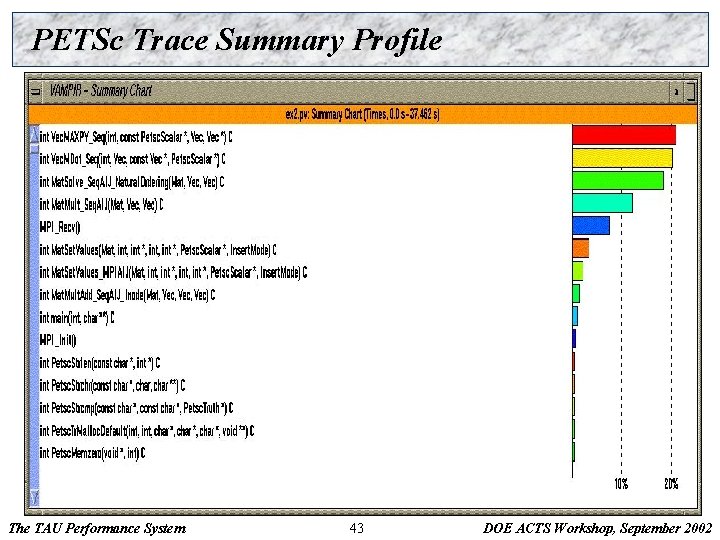
PETSc (ANL) r r Portable, Extensible Toolkit for Scientific Computation Scalable (parallel) PDE framework ¦ ¦ r Parallel implementation ¦ r MPI used for inter-process communication TAU instrumentation ¦ ¦ r Suite of data structures and routines Solution of scientific applications modeled by PDEs PDT for C/C++ source instrumentation MPI wrapper library layer instrumentation Example ¦ Solves a set of linear equations (Ax=b) in parallel (SLES) The TAU Performance System 39 DOE ACTS Workshop, September 2002

PETSc Linear Equation Solver Profile The TAU Performance System 40 DOE ACTS Workshop, September 2002

PETSc Linear Equation Solver Profile The TAU Performance System 41 DOE ACTS Workshop, September 2002

PETSc Linear Equation Solver Profile The TAU Performance System 42 DOE ACTS Workshop, September 2002

PETSc Trace Summary Profile The TAU Performance System 43 DOE ACTS Workshop, September 2002

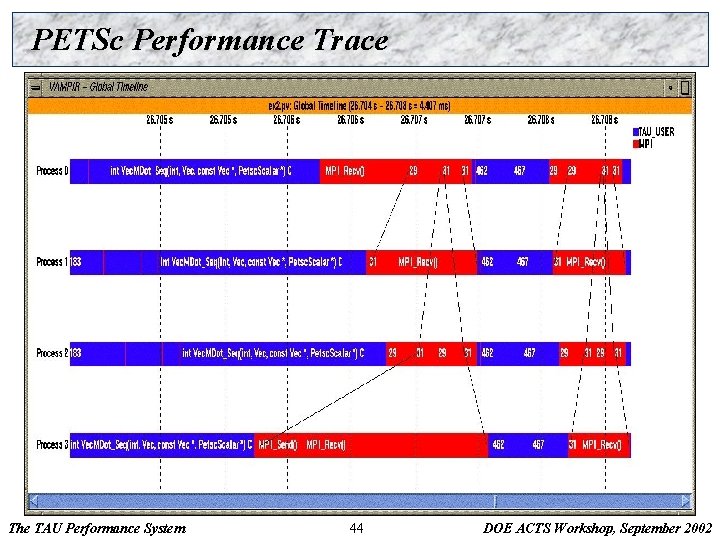
PETSc Performance Trace The TAU Performance System 44 DOE ACTS Workshop, September 2002

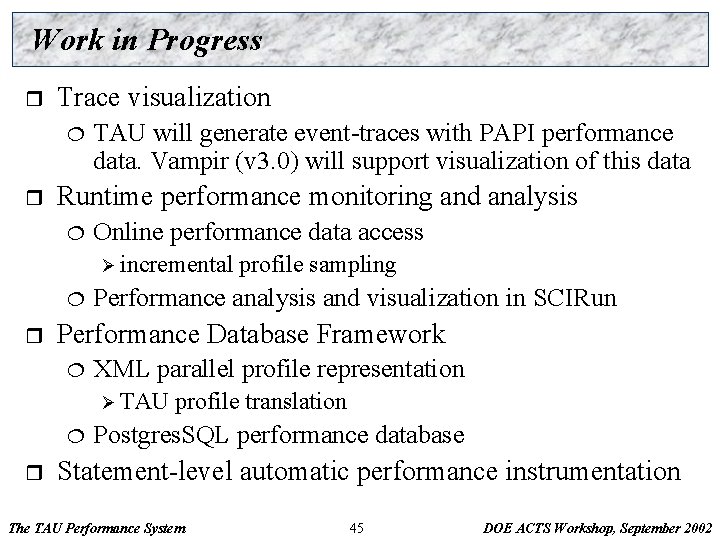
Work in Progress r Trace visualization ¦ r TAU will generate event-traces with PAPI performance data. Vampir (v 3. 0) will support visualization of this data Runtime performance monitoring and analysis ¦ Online performance data access Ø incremental ¦ r Performance analysis and visualization in SCIRun Performance Database Framework ¦ XML parallel profile representation Ø TAU ¦ r profile sampling profile translation Postgres. SQL performance database Statement-level automatic performance instrumentation The TAU Performance System 45 DOE ACTS Workshop, September 2002

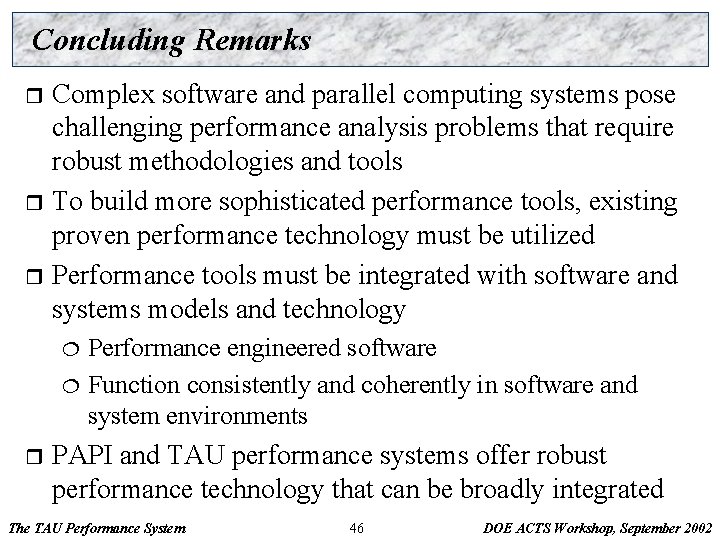
Concluding Remarks Complex software and parallel computing systems pose challenging performance analysis problems that require robust methodologies and tools r To build more sophisticated performance tools, existing proven performance technology must be utilized r Performance tools must be integrated with software and systems models and technology r Performance engineered software ¦ Function consistently and coherently in software and system environments ¦ r PAPI and TAU performance systems offer robust performance technology that can be broadly integrated The TAU Performance System 46 DOE ACTS Workshop, September 2002

Acknowledgements r Department of Energy (DOE) ¦ MICS office Ø DOE 2000 ACTS contract Ø “Performance Technology for Tera-class Parallel Computer Systems: Evolution of the TAU Performance System” ¦ ¦ r Research Centre Juelich ¦ ¦ r University of Utah DOE ASCI Level 1 sub-contract DOE ASCI Level 3 (LANL, LLNL) DARPA NSF National Young Investigator (NYI) award John von Neumann Institute for Computing Dr. Bernd Mohr Los Alamos National Laboratory The TAU Performance System 47 DOE ACTS Workshop, September 2002

Information r r TAU (http: //www. acl. lanl. gov/tau) PDT (http: //www. acl. lanl. gov/pdtoolkit) PAPI (http: //icl. cs. utk. edu/projects/papi/) OPARI (http: //www. fz-juelich. de/zam/kojak/) The TAU Performance System 48 DOE ACTS Workshop, September 2002