TAU Tuning and Analysis Utilities TAU Performance System
![TAU Measurement System Configuration r configure [OPTIONS] {-c++=<CC>, -cc=<cc>} Specify C++ and C compilers TAU Measurement System Configuration r configure [OPTIONS] {-c++=<CC>, -cc=<cc>} Specify C++ and C compilers](https://slidetodoc.com/presentation_image/fb9e72c30769d16635a6b89f82b2c2e2/image-9.jpg)
![Pprof Command r pprof [-c|-b|-m|-t|-e|-i] [-r] [-s] [-n num] [-f file] [-l] [nodes] ¦ Pprof Command r pprof [-c|-b|-m|-t|-e|-i] [-r] [-s] [-n num] [-f file] [-l] [nodes] ¦](https://slidetodoc.com/presentation_image/fb9e72c30769d16635a6b89f82b2c2e2/image-18.jpg)
![Applications: Uintah (U. Utah) (500 cpus) TAU uses SCIRun [U. Utah] for visualization of Applications: Uintah (U. Utah) (500 cpus) TAU uses SCIRun [U. Utah] for visualization of](https://slidetodoc.com/presentation_image/fb9e72c30769d16635a6b89f82b2c2e2/image-26.jpg)
- Slides: 29

TAU: Tuning and Analysis Utilities

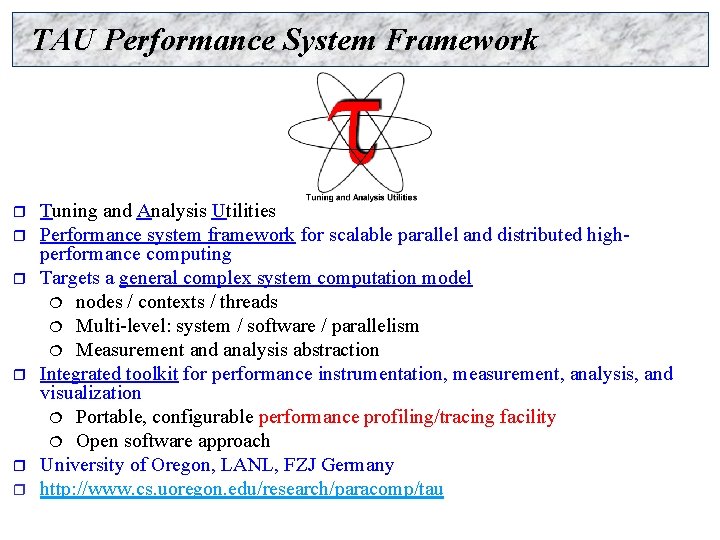
TAU Performance System Framework r r r Tuning and Analysis Utilities Performance system framework for scalable parallel and distributed highperformance computing Targets a general complex system computation model ¦ nodes / contexts / threads ¦ Multi-level: system / software / parallelism ¦ Measurement and analysis abstraction Integrated toolkit for performance instrumentation, measurement, analysis, and visualization ¦ Portable, configurable performance profiling/tracing facility ¦ Open software approach University of Oregon, LANL, FZJ Germany http: //www. cs. uoregon. edu/research/paracomp/tau

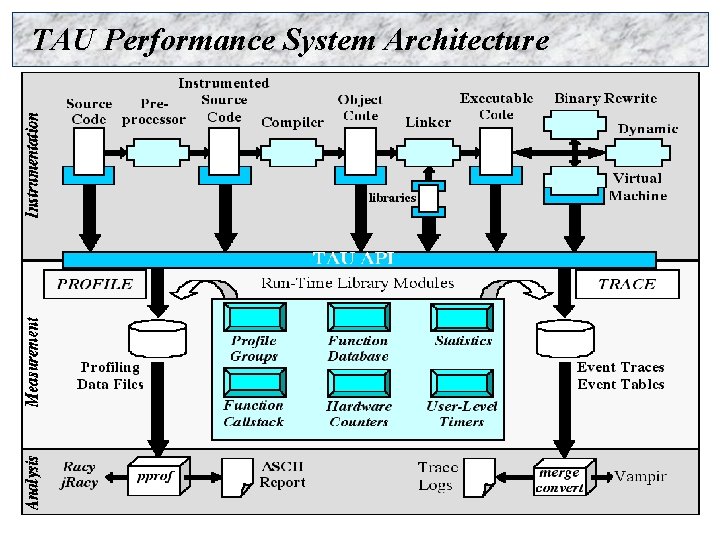
TAU Performance System Architecture

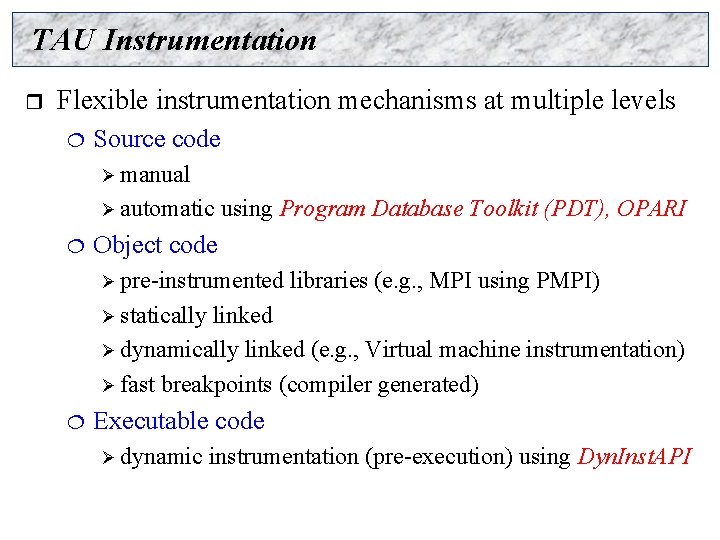
TAU Instrumentation r Flexible instrumentation mechanisms at multiple levels ¦ Source code Ø manual Ø automatic ¦ using Program Database Toolkit (PDT), OPARI Object code Ø pre-instrumented libraries (e. g. , MPI using PMPI) Ø statically linked Ø dynamically linked (e. g. , Virtual machine instrumentation) Ø fast breakpoints (compiler generated) ¦ Executable code Ø dynamic instrumentation (pre-execution) using Dyn. Inst. API

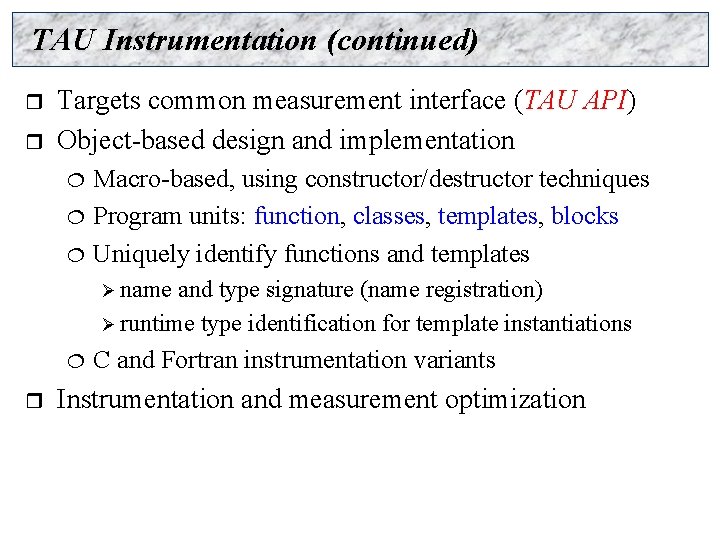
TAU Instrumentation (continued) r r Targets common measurement interface (TAU API) Object-based design and implementation ¦ ¦ ¦ Macro-based, using constructor/destructor techniques Program units: function, classes, templates, blocks Uniquely identify functions and templates Ø name and type signature (name registration) Ø runtime type identification for template instantiations ¦ r C and Fortran instrumentation variants Instrumentation and measurement optimization

Multi-Level Instrumentation r r r Uses multiple instrumentation interfaces Shares information: cooperation between interfaces Taps information at multiple levels Provides selective instrumentation at each level Targets a common performance model Presents a unified view of execution

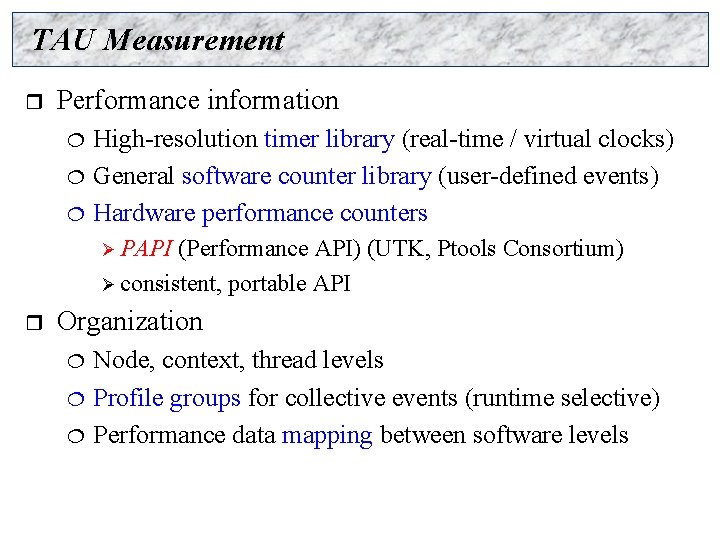
TAU Measurement r Performance information ¦ ¦ ¦ High-resolution timer library (real-time / virtual clocks) General software counter library (user-defined events) Hardware performance counters Ø PAPI (Performance API) (UTK, Ptools Consortium) Ø consistent, portable API r Organization ¦ ¦ ¦ Node, context, thread levels Profile groups for collective events (runtime selective) Performance data mapping between software levels

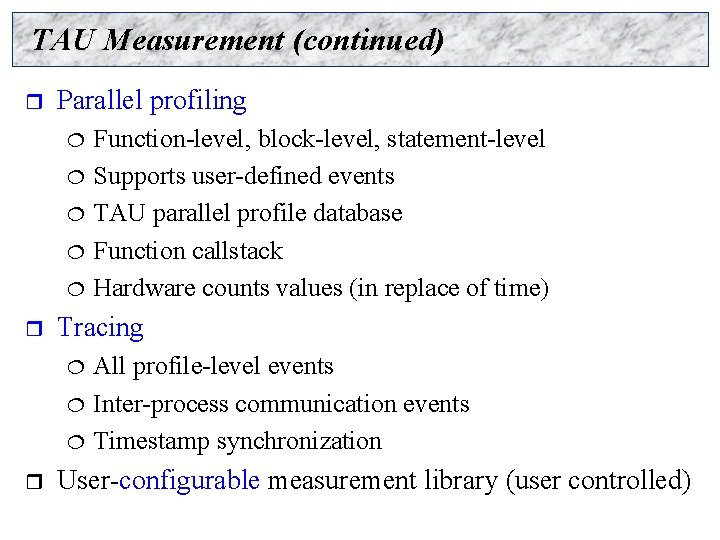
TAU Measurement (continued) r Parallel profiling ¦ ¦ ¦ r Tracing ¦ ¦ ¦ r Function-level, block-level, statement-level Supports user-defined events TAU parallel profile database Function callstack Hardware counts values (in replace of time) All profile-level events Inter-process communication events Timestamp synchronization User-configurable measurement library (user controlled)
![TAU Measurement System Configuration r configure OPTIONS cCC cccc Specify C and C compilers TAU Measurement System Configuration r configure [OPTIONS] {-c++=<CC>, -cc=<cc>} Specify C++ and C compilers](https://slidetodoc.com/presentation_image/fb9e72c30769d16635a6b89f82b2c2e2/image-9.jpg)
TAU Measurement System Configuration r configure [OPTIONS] {-c++=<CC>, -cc=<cc>} Specify C++ and C compilers ¦ {-pthread, -sproc} Use pthread or SGI sproc threads ¦ -openmp Use Open. MP threads ¦ -opari=<dir> Specify location of Opari Open. MP tool ¦ -papi=<dir> Specify location of PAPI ¦ -pdt=<dir> Specify location of PDT ¦ -dyninst=<dir> Specify location of Dyn. Inst Package ¦ {-mpiinc=<d>, mpilib=<d>} Specify MPI library instrumentation ¦ -TRACE Generate TAU event traces ¦ -PROFILE Generate TAU profiles ¦ -MULTIPLECOUNTERS Use more than one hardware counter ¦ -CPUTIME Use usertime+system time ¦ -PAPIWALLCLOCK Use PAPI to access wallclock time ¦

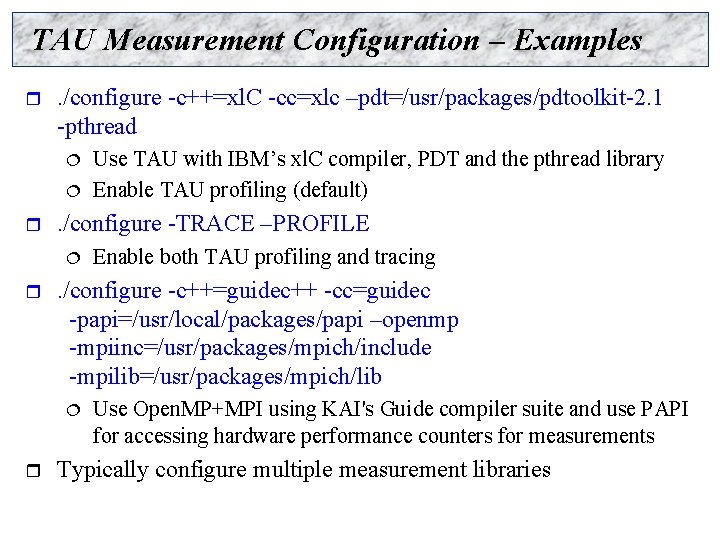
TAU Measurement Configuration – Examples r . /configure -c++=xl. C -cc=xlc –pdt=/usr/packages/pdtoolkit-2. 1 -pthread ¦ ¦ r . /configure -TRACE –PROFILE ¦ r Enable both TAU profiling and tracing . /configure -c++=guidec++ -cc=guidec -papi=/usr/local/packages/papi –openmp -mpiinc=/usr/packages/mpich/include -mpilib=/usr/packages/mpich/lib ¦ r Use TAU with IBM’s xl. C compiler, PDT and the pthread library Enable TAU profiling (default) Use Open. MP+MPI using KAI's Guide compiler suite and use PAPI for accessing hardware performance counters for measurements Typically configure multiple measurement libraries

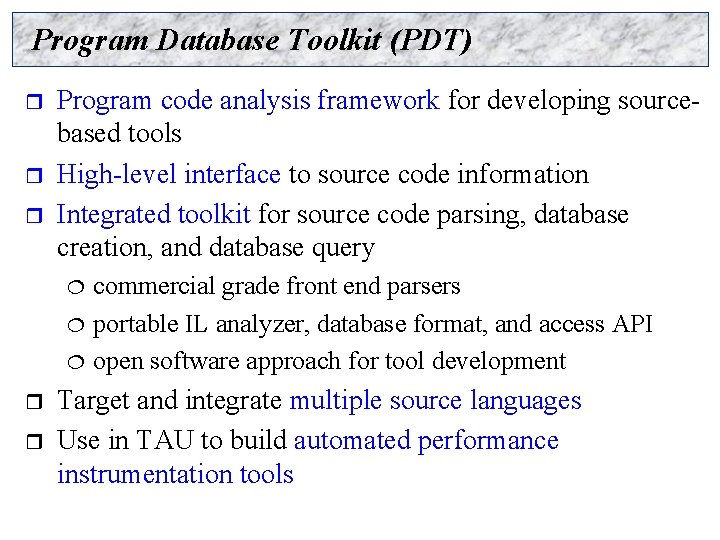
Program Database Toolkit (PDT) r r r Program code analysis framework for developing sourcebased tools High-level interface to source code information Integrated toolkit for source code parsing, database creation, and database query ¦ ¦ ¦ r r commercial grade front end parsers portable IL analyzer, database format, and access API open software approach for tool development Target and integrate multiple source languages Use in TAU to build automated performance instrumentation tools

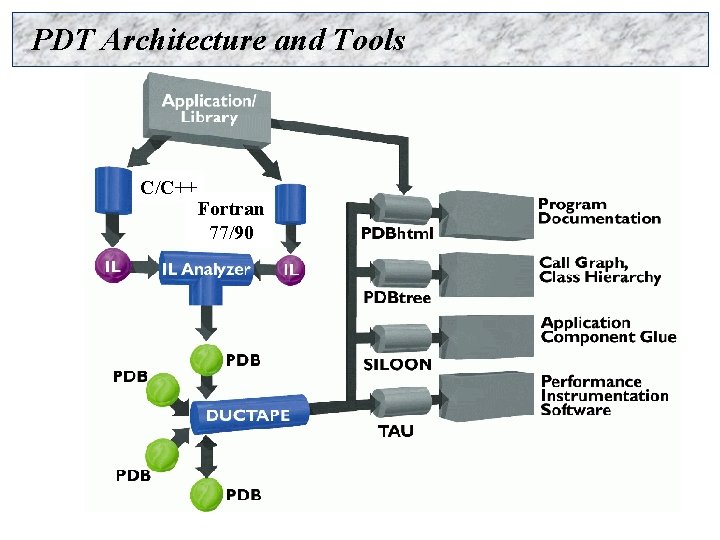
PDT Architecture and Tools C/C++ Fortran 77/90

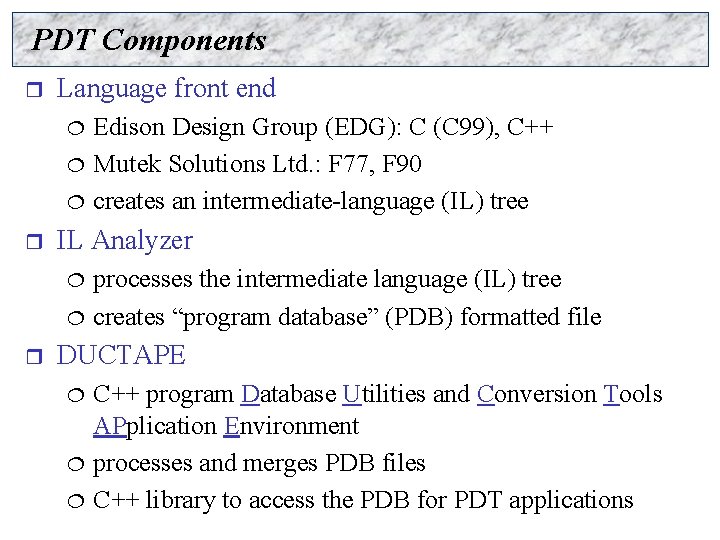
PDT Components r Language front end ¦ ¦ ¦ r IL Analyzer ¦ ¦ r Edison Design Group (EDG): C (C 99), C++ Mutek Solutions Ltd. : F 77, F 90 creates an intermediate-language (IL) tree processes the intermediate language (IL) tree creates “program database” (PDB) formatted file DUCTAPE ¦ ¦ ¦ C++ program Database Utilities and Conversion Tools APplication Environment processes and merges PDB files C++ library to access the PDB for PDT applications

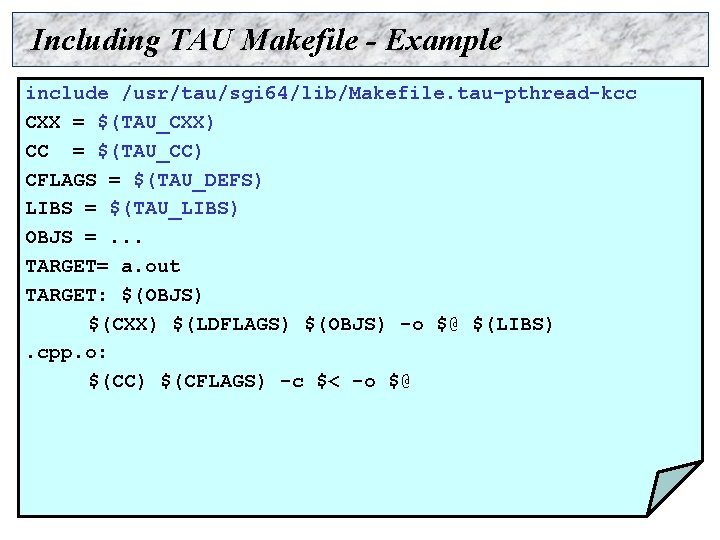
Including TAU Makefile - Example include /usr/tau/sgi 64/lib/Makefile. tau-pthread-kcc CXX = $(TAU_CXX) CC = $(TAU_CC) CFLAGS = $(TAU_DEFS) LIBS = $(TAU_LIBS) OBJS =. . . TARGET= a. out TARGET: $(OBJS) $(CXX) $(LDFLAGS) $(OBJS) -o $@ $(LIBS). cpp. o: $(CC) $(CFLAGS) -c $< -o $@

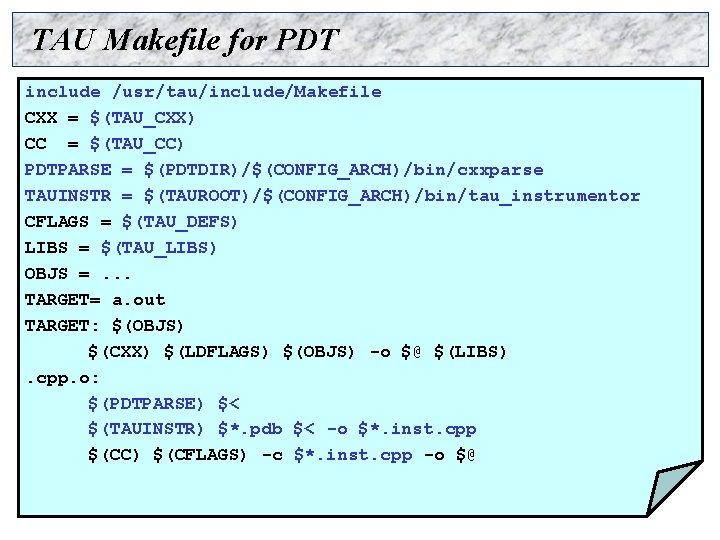
TAU Makefile for PDT include /usr/tau/include/Makefile CXX = $(TAU_CXX) CC = $(TAU_CC) PDTPARSE = $(PDTDIR)/$(CONFIG_ARCH)/bin/cxxparse TAUINSTR = $(TAUROOT)/$(CONFIG_ARCH)/bin/tau_instrumentor CFLAGS = $(TAU_DEFS) LIBS = $(TAU_LIBS) OBJS =. . . TARGET= a. out TARGET: $(OBJS) $(CXX) $(LDFLAGS) $(OBJS) -o $@ $(LIBS). cpp. o: $(PDTPARSE) $< $(TAUINSTR) $*. pdb $< -o $*. inst. cpp $(CC) $(CFLAGS) -c $*. inst. cpp -o $@

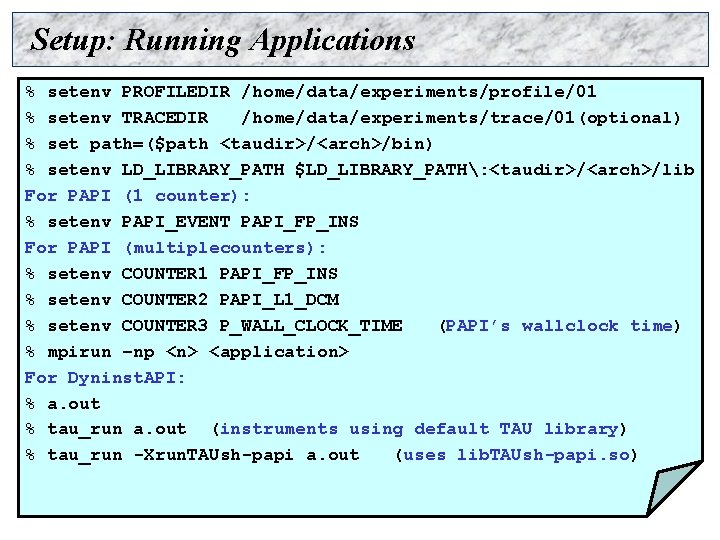
Setup: Running Applications % setenv PROFILEDIR /home/data/experiments/profile/01 % setenv TRACEDIR /home/data/experiments/trace/01(optional) % set path=($path <taudir>/<arch>/bin) % setenv LD_LIBRARY_PATH $LD_LIBRARY_PATH: <taudir>/<arch>/lib For PAPI (1 counter): % setenv PAPI_EVENT PAPI_FP_INS For PAPI (multiplecounters): % setenv COUNTER 1 PAPI_FP_INS % setenv COUNTER 2 PAPI_L 1_DCM % setenv COUNTER 3 P_WALL_CLOCK_TIME (PAPI’s wallclock time) % mpirun –np <n> <application> For Dyninst. API: % a. out % tau_run a. out (instruments using default TAU library) % tau_run -Xrun. TAUsh-papi a. out (uses lib. TAUsh-papi. so)

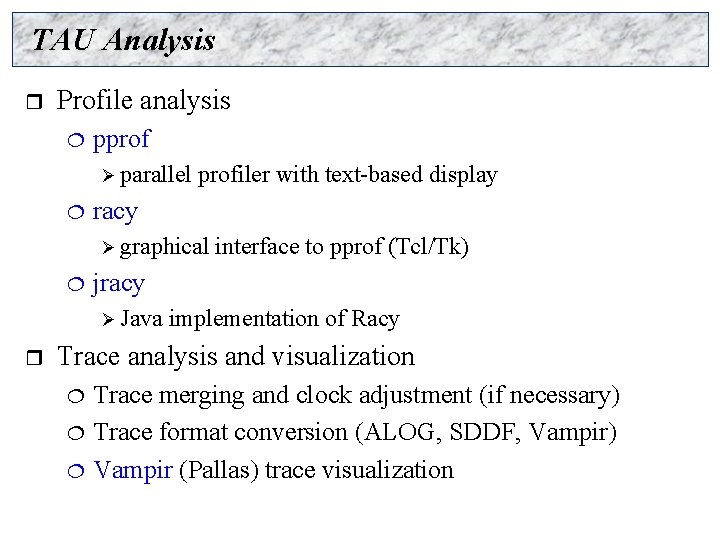
TAU Analysis r Profile analysis ¦ pprof Ø parallel ¦ profiler with text-based display racy Ø graphical ¦ jracy Ø Java r interface to pprof (Tcl/Tk) implementation of Racy Trace analysis and visualization ¦ ¦ ¦ Trace merging and clock adjustment (if necessary) Trace format conversion (ALOG, SDDF, Vampir) Vampir (Pallas) trace visualization
![Pprof Command r pprof cbmtei r s n num f file l nodes Pprof Command r pprof [-c|-b|-m|-t|-e|-i] [-r] [-s] [-n num] [-f file] [-l] [nodes] ¦](https://slidetodoc.com/presentation_image/fb9e72c30769d16635a6b89f82b2c2e2/image-18.jpg)
Pprof Command r pprof [-c|-b|-m|-t|-e|-i] [-r] [-s] [-n num] [-f file] [-l] [nodes] ¦ -c Sort according to number of calls ¦ -b Sort according to number of subroutines called ¦ -m Sort according to msecs (exclusive time total) ¦ -t Sort according to total msecs (inclusive time total) ¦ -e Sort according to exclusive time per call ¦ -i Sort according to inclusive time per call ¦ -v Sort according to standard deviation (exclusive usec) ¦ -r Reverse sorting order ¦ -s Print only summary profile information ¦ -n num Print only first number of functions ¦ -f file Specify full path and filename without node ids ¦ -l List all functions and exit

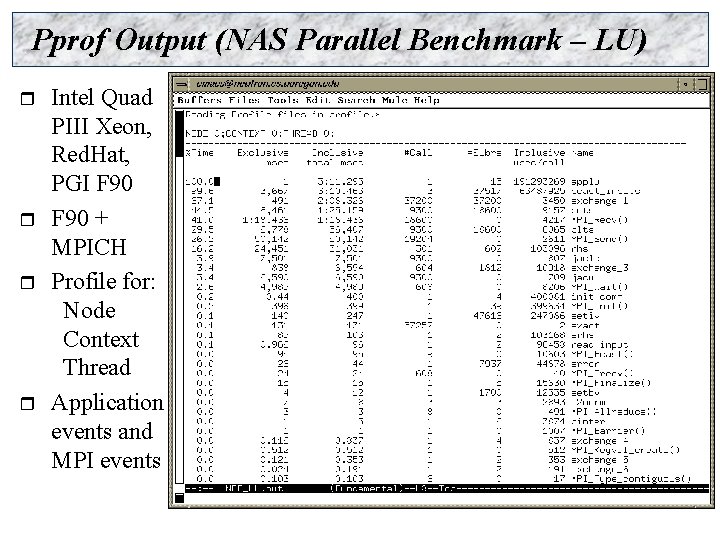
Pprof Output (NAS Parallel Benchmark – LU) r r Intel Quad PIII Xeon, Red. Hat, PGI F 90 + MPICH Profile for: Node Context Thread Application events and MPI events

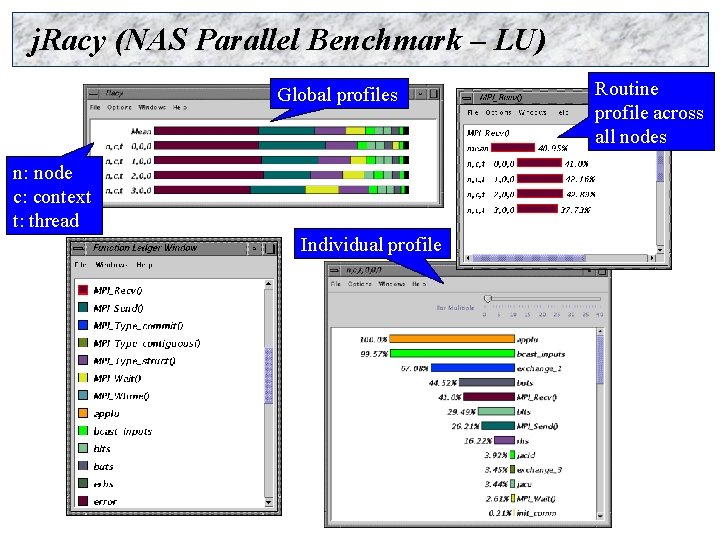
j. Racy (NAS Parallel Benchmark – LU) Global profiles n: node c: context t: thread Individual profile Routine profile across all nodes

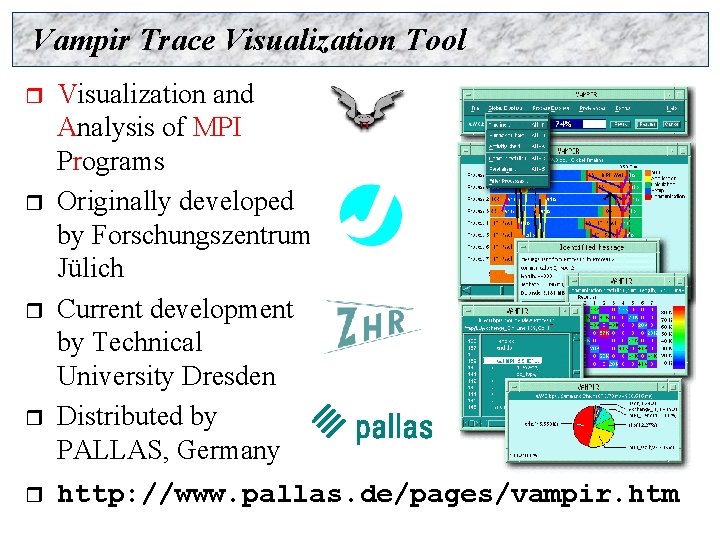
Vampir Trace Visualization Tool r r r Visualization and Analysis of MPI Programs Originally developed by Forschungszentrum Jülich Current development by Technical University Dresden Distributed by PALLAS, Germany http: //www. pallas. de/pages/vampir. htm

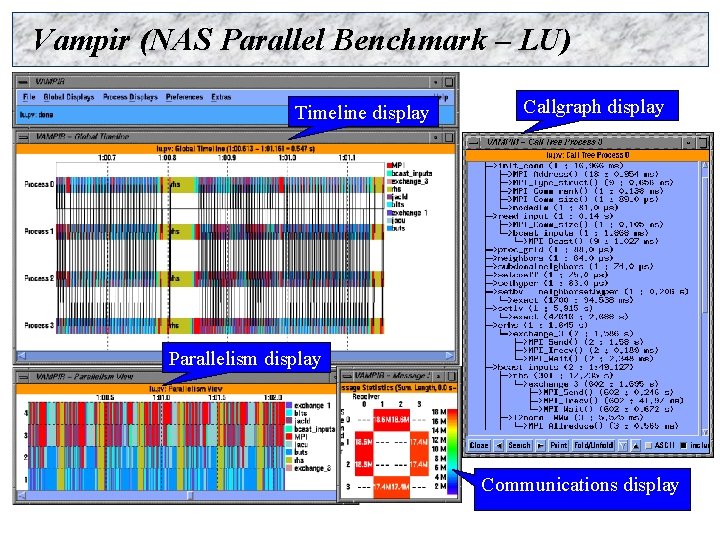
Vampir (NAS Parallel Benchmark – LU) Timeline display Callgraph display Parallelism display Communications display

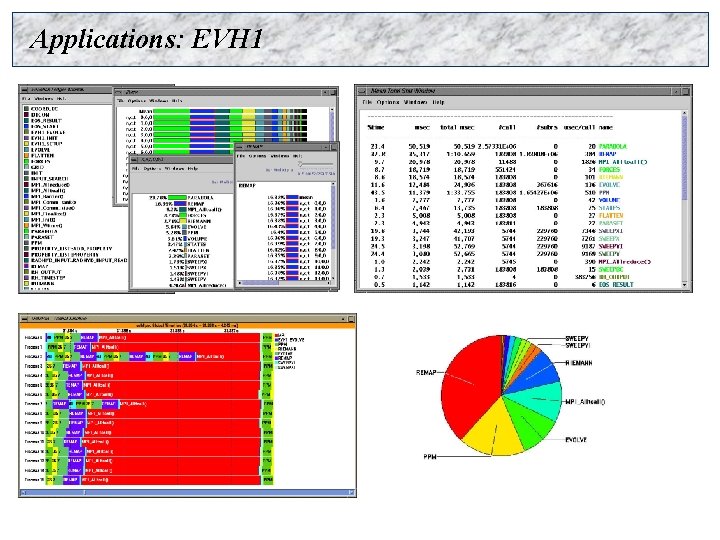
Applications: EVH 1

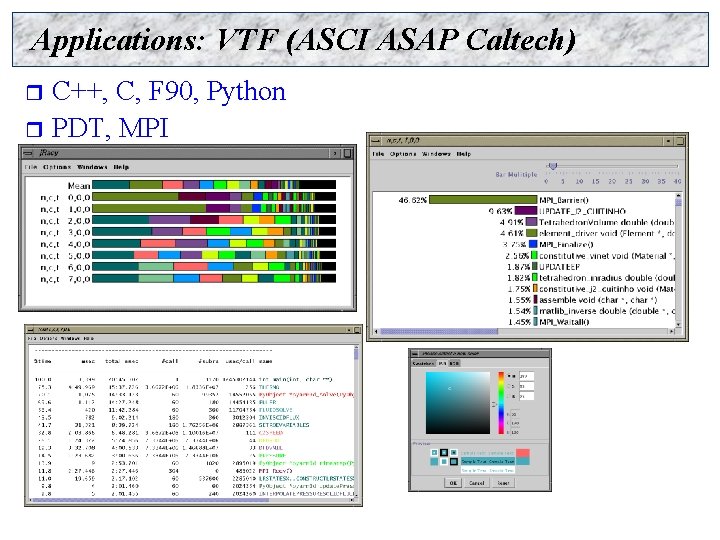
Applications: VTF (ASCI ASAP Caltech) C++, C, F 90, Python r PDT, MPI r

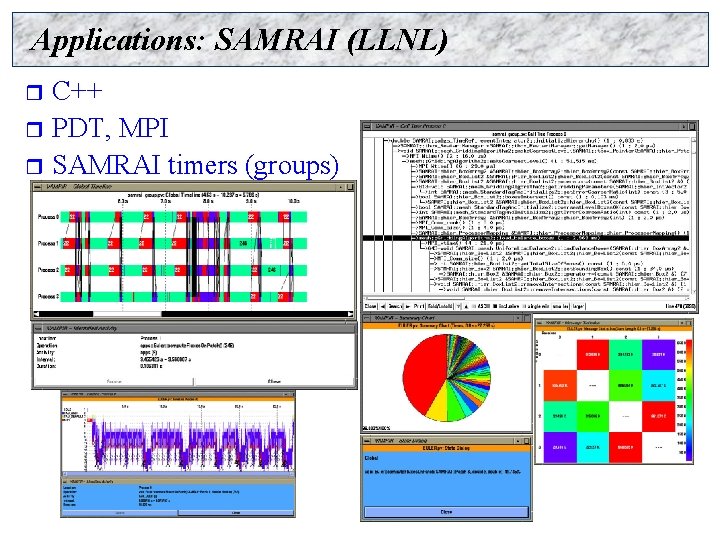
Applications: SAMRAI (LLNL) C++ r PDT, MPI r SAMRAI timers (groups) r
![Applications Uintah U Utah 500 cpus TAU uses SCIRun U Utah for visualization of Applications: Uintah (U. Utah) (500 cpus) TAU uses SCIRun [U. Utah] for visualization of](https://slidetodoc.com/presentation_image/fb9e72c30769d16635a6b89f82b2c2e2/image-26.jpg)
Applications: Uintah (U. Utah) (500 cpus) TAU uses SCIRun [U. Utah] for visualization of performance data (online/offline)

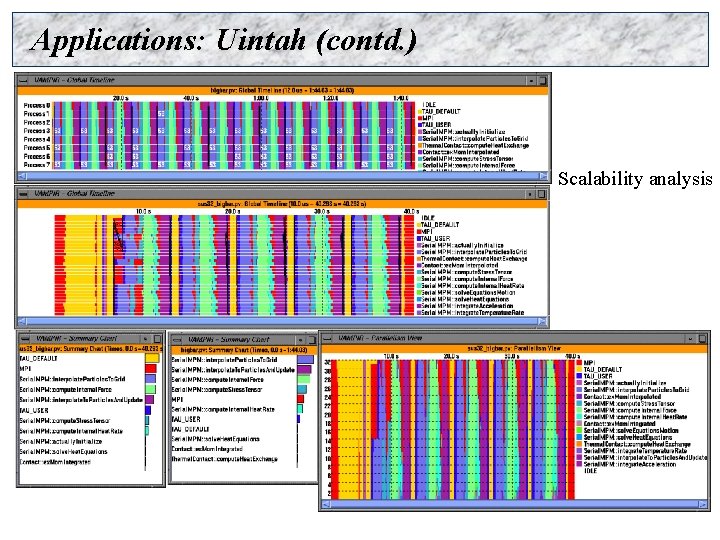
Applications: Uintah (contd. ) Scalability analysis

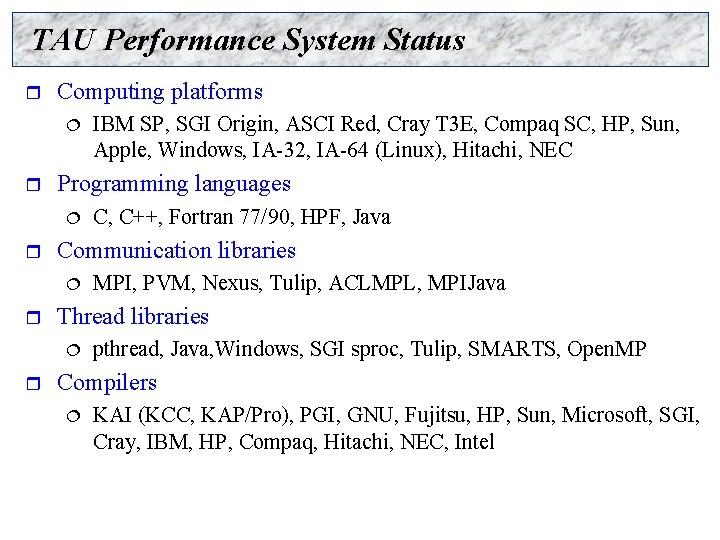
TAU Performance System Status r Computing platforms ¦ r Programming languages ¦ r MPI, PVM, Nexus, Tulip, ACLMPL, MPIJava Thread libraries ¦ r C, C++, Fortran 77/90, HPF, Java Communication libraries ¦ r IBM SP, SGI Origin, ASCI Red, Cray T 3 E, Compaq SC, HP, Sun, Apple, Windows, IA-32, IA-64 (Linux), Hitachi, NEC pthread, Java, Windows, SGI sproc, Tulip, SMARTS, Open. MP Compilers ¦ KAI (KCC, KAP/Pro), PGI, GNU, Fujitsu, HP, Sun, Microsoft, SGI, Cray, IBM, HP, Compaq, Hitachi, NEC, Intel

Support Acknowledgement r TAU and PDT support: ¦ Department of Energy (DOE) Ø DOE 2000 ACTS contract Ø DOE MICS contract Ø DOE ASCI Level 3 (LANL, LLNL) Ø U. of Utah DOE ASCI Level 1 subcontract ¦ ¦ DARPA NSF National Young Investigator (NYI) award