TAU PERFORMANCE SYSTEM Sameer Shende Chee Wai Lee
![HDF 5 Library Wrapping [sameer@zorak]$ tau_gen_wrapper hdf 5. h /usr/libhdf 5. a -f select. HDF 5 Library Wrapping [sameer@zorak]$ tau_gen_wrapper hdf 5. h /usr/libhdf 5. a -f select.](https://slidetodoc.com/presentation_image_h/00f9c6370c8d8c6c688be1b0ba185565/image-46.jpg)
- Slides: 98

TAU PERFORMANCE SYSTEM Sameer Shende Chee Wai Lee, Wyatt Spear, Scott Biersdorff, Suzanne Millstein Performance Research Lab Allen D. Malony, Nick Chaimov, William Voorhees Department of Computer and Information Science University of Oregon

TAU Performance System ® • Tuning and Analysis Utilities (18+ year project) • Comprehensive performance profiling and tracing – Integrated, scalable, flexible, portable – Targets all parallel programming/execution paradigms • Integrated performance toolkit – – Instrumentation, measurement, analysis, visualization Widely-ported performance profiling / tracing system Performance data management and data mining Open source (BSD-style license) • Easy to integrate in application frameworks http: //tau. uoregon. edu 2 VI-HPS TW 8 Workshop, Aachen Sep 5 -9, 2011.

What is TAU? • • TAU is a performance evaluation tool It supports parallel profiling and tracing Profiling shows you how much (total) time was spent in each routine Tracing shows you when the events take place in each process along a timeline Profiling and tracing can measure time as well as hardware performance counters (cache misses, instructions) from your CPU TAU can automatically instrument your source code using a package called PDT for routines, loops, I/O, memory, phases, etc. TAU runs on most HPC platforms and it is free (BSD style license) TAU has instrumentation, measurement and analysis tools – paraprof is TAU’s 3 D profile browser • To use TAU’s automatic source instrumentation, you may set a couple of environment variables and substitute the name of your compiler with a TAU shell script 3 VI-HPS TW 8 Workshop, Aachen Sep 5 -9, 2011.

TAU: Usage Scenarios • How much time is spent in each application routine and outer loops? Within loops, what is the contribution of each statement? • How many instructions are executed in these code regions? Floating point, Level 1 and 2 data cache misses, hits, branches taken? • What is the peak heap memory usage of the code? When and where is memory allocated/de-allocated? Are there any memory leaks? • How much time does the application spend performing I/O? What is the peak read and write bandwidth of individual calls, total volume? • What is the contribution of different phases of the program? What is the time wasted/spent waiting for collectives, and I/O operations in Initialization, Computation, I/O phases? • How does the application scale? What is the efficiency, runtime breakdown of performance across different core counts? 4 VI-HPS TW 8 Workshop, Aachen Sep 5 -9, 2011.

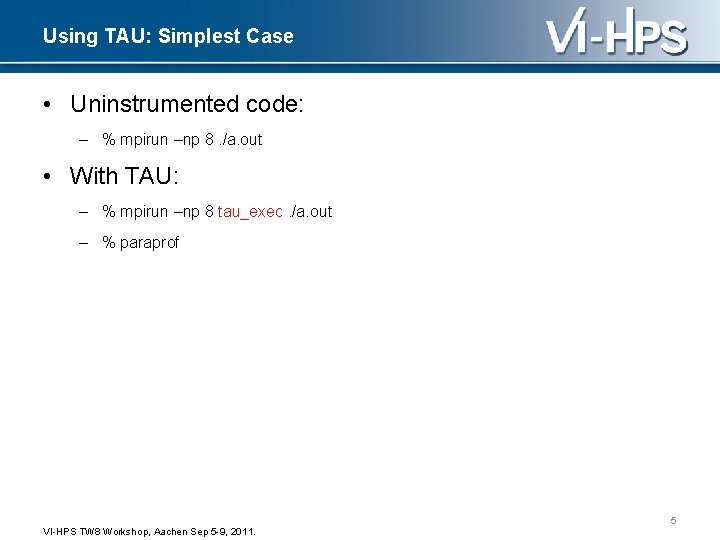
Using TAU: Simplest Case • Uninstrumented code: – % mpirun –np 8. /a. out • With TAU: – % mpirun –np 8 tau_exec. /a. out – % paraprof 5 VI-HPS TW 8 Workshop, Aachen Sep 5 -9, 2011.

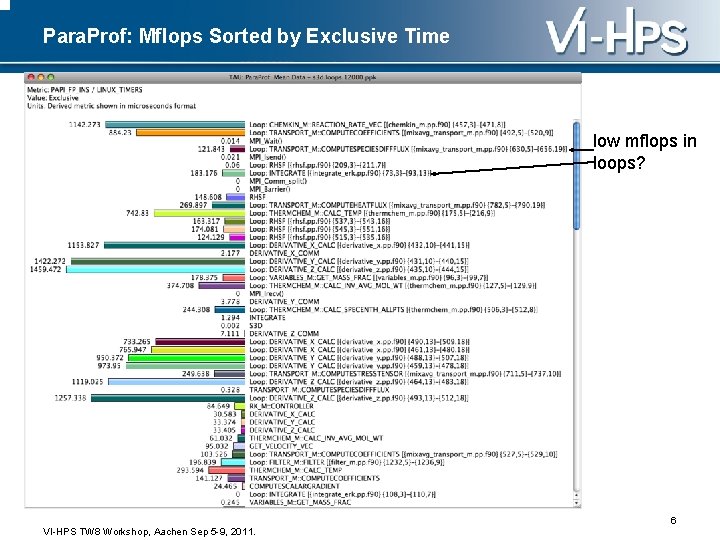
Para. Prof: Mflops Sorted by Exclusive Time low mflops in loops? 6 VI-HPS TW 8 Workshop, Aachen Sep 5 -9, 2011.

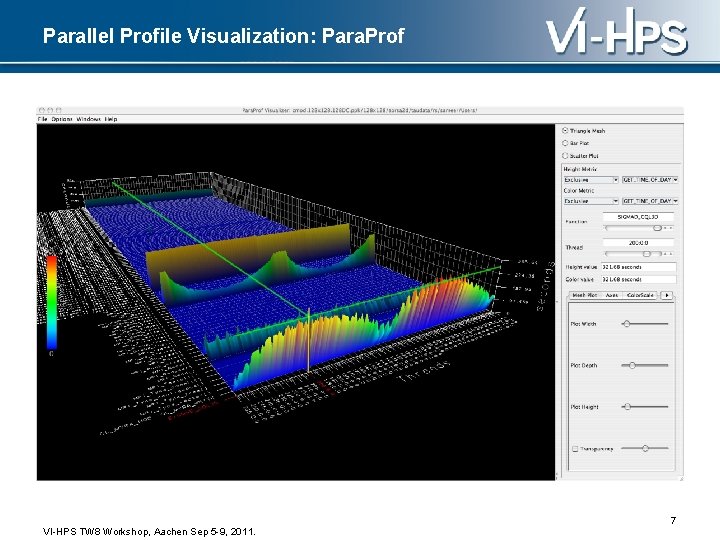
Parallel Profile Visualization: Para. Prof 7 VI-HPS TW 8 Workshop, Aachen Sep 5 -9, 2011.

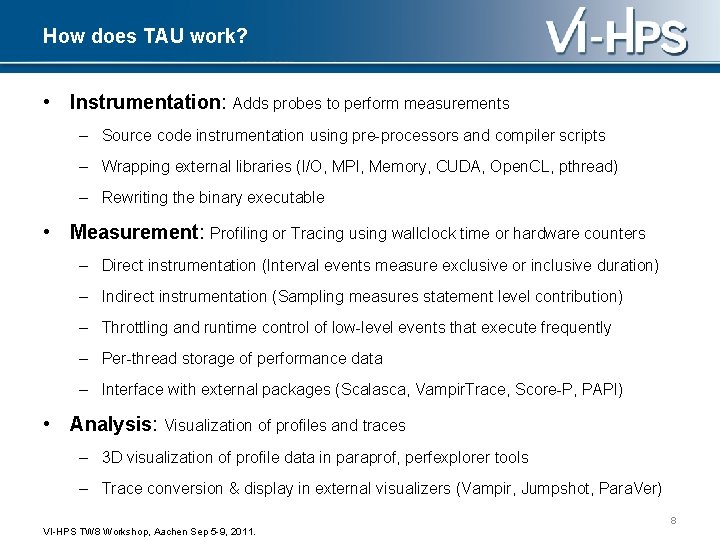
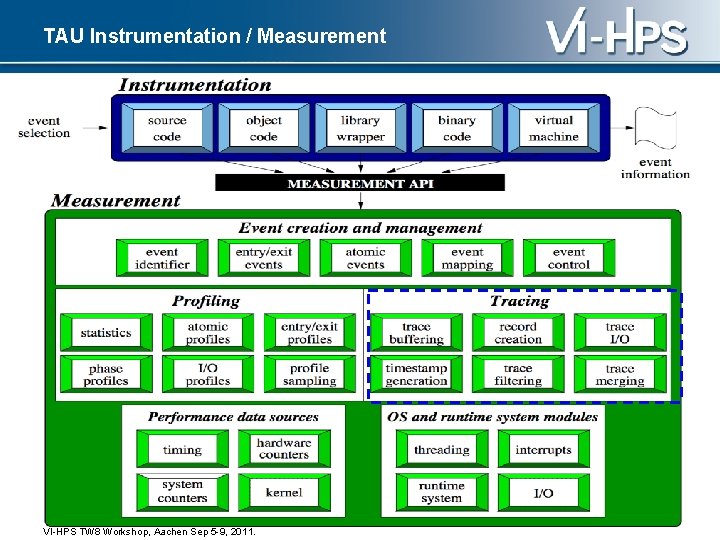
How does TAU work? • Instrumentation: Adds probes to perform measurements – Source code instrumentation using pre-processors and compiler scripts – Wrapping external libraries (I/O, MPI, Memory, CUDA, Open. CL, pthread) – Rewriting the binary executable • Measurement: Profiling or Tracing using wallclock time or hardware counters – Direct instrumentation (Interval events measure exclusive or inclusive duration) – Indirect instrumentation (Sampling measures statement level contribution) – Throttling and runtime control of low-level events that execute frequently – Per-thread storage of performance data – Interface with external packages (Scalasca, Vampir. Trace, Score-P, PAPI) • Analysis: Visualization of profiles and traces – 3 D visualization of profile data in paraprof, perfexplorer tools – Trace conversion & display in external visualizers (Vampir, Jumpshot, Para. Ver) 8 VI-HPS TW 8 Workshop, Aachen Sep 5 -9, 2011.

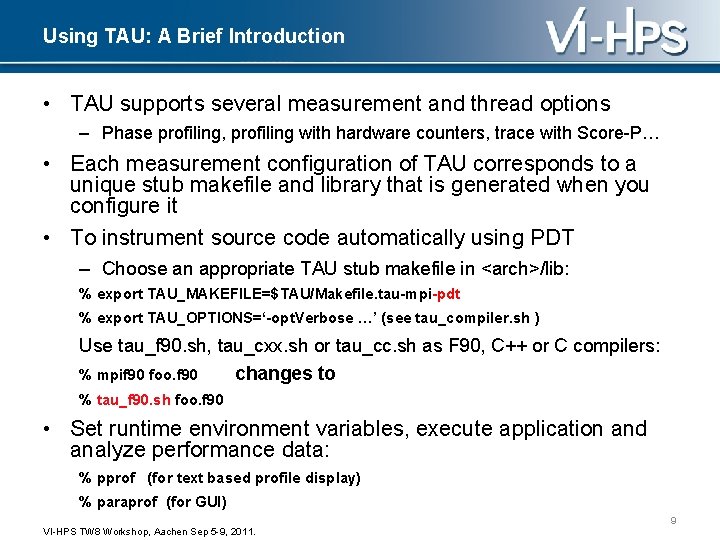
Using TAU: A Brief Introduction • TAU supports several measurement and thread options – Phase profiling, profiling with hardware counters, trace with Score-P… • Each measurement configuration of TAU corresponds to a unique stub makefile and library that is generated when you configure it • To instrument source code automatically using PDT – Choose an appropriate TAU stub makefile in <arch>/lib: % export TAU_MAKEFILE=$TAU/Makefile. tau-mpi-pdt % export TAU_OPTIONS=‘-opt. Verbose …’ (see tau_compiler. sh ) Use tau_f 90. sh, tau_cxx. sh or tau_cc. sh as F 90, C++ or C compilers: % mpif 90 foo. f 90 changes to % tau_f 90. sh foo. f 90 • Set runtime environment variables, execute application and analyze performance data: % pprof (for text based profile display) % paraprof (for GUI) 9 VI-HPS TW 8 Workshop, Aachen Sep 5 -9, 2011.

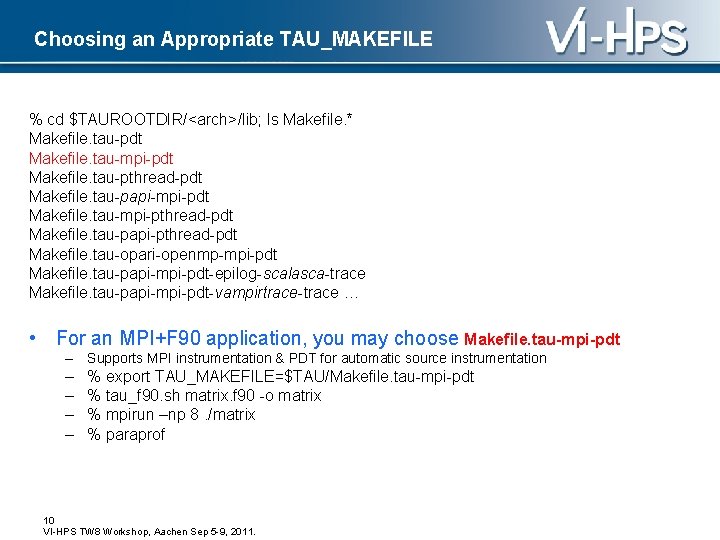
Choosing an Appropriate TAU_MAKEFILE % cd $TAUROOTDIR/<arch>/lib; ls Makefile. * Makefile. tau-pdt Makefile. tau-mpi-pdt Makefile. tau-pthread-pdt Makefile. tau-papi-mpi-pdt Makefile. tau-mpi-pthread-pdt Makefile. tau-papi-pthread-pdt Makefile. tau-opari-openmp-mpi-pdt Makefile. tau-papi-mpi-pdt-epilog-scalasca-trace Makefile. tau-papi-mpi-pdt-vampirtrace-trace … • For an MPI+F 90 application, you may choose Makefile. tau-mpi-pdt – Supports MPI instrumentation & PDT for automatic source instrumentation – – % export TAU_MAKEFILE=$TAU/Makefile. tau-mpi-pdt % tau_f 90. sh matrix. f 90 -o matrix % mpirun –np 8. /matrix % paraprof 10 VI-HPS TW 8 Workshop, Aachen Sep 5 -9, 2011.

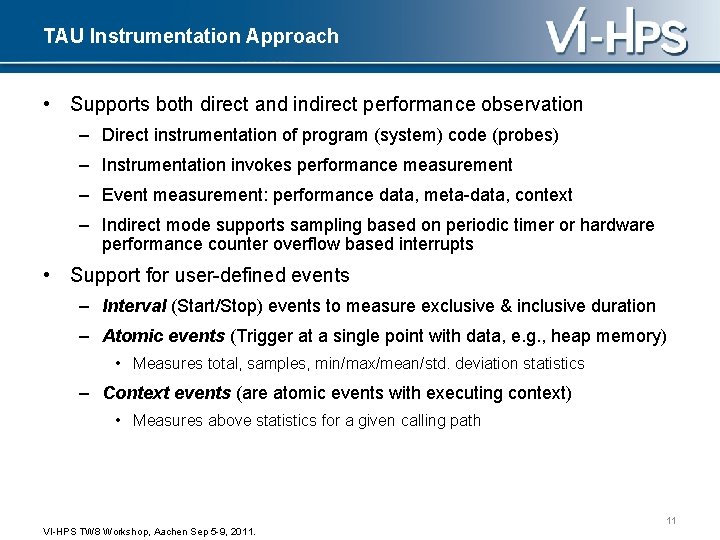
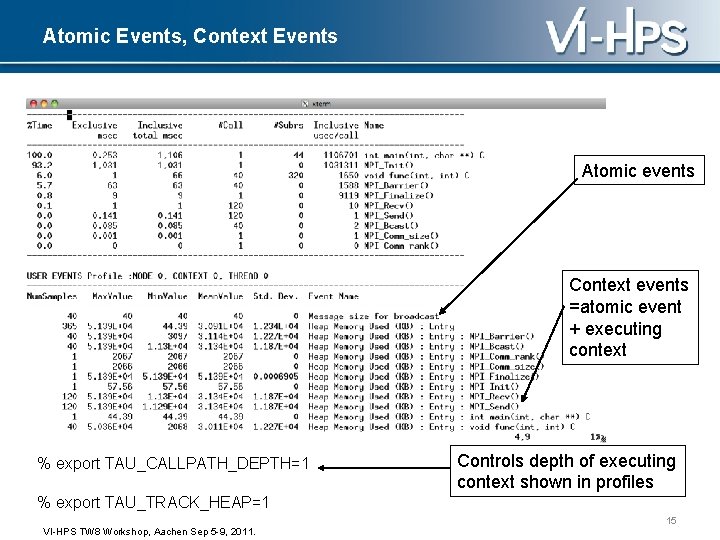
TAU Instrumentation Approach • Supports both direct and indirect performance observation – Direct instrumentation of program (system) code (probes) – Instrumentation invokes performance measurement – Event measurement: performance data, meta-data, context – Indirect mode supports sampling based on periodic timer or hardware performance counter overflow based interrupts • Support for user-defined events – Interval (Start/Stop) events to measure exclusive & inclusive duration – Atomic events (Trigger at a single point with data, e. g. , heap memory) • Measures total, samples, min/max/mean/std. deviation statistics – Context events (are atomic events with executing context) • Measures above statistics for a given calling path 11 VI-HPS TW 8 Workshop, Aachen Sep 5 -9, 2011.

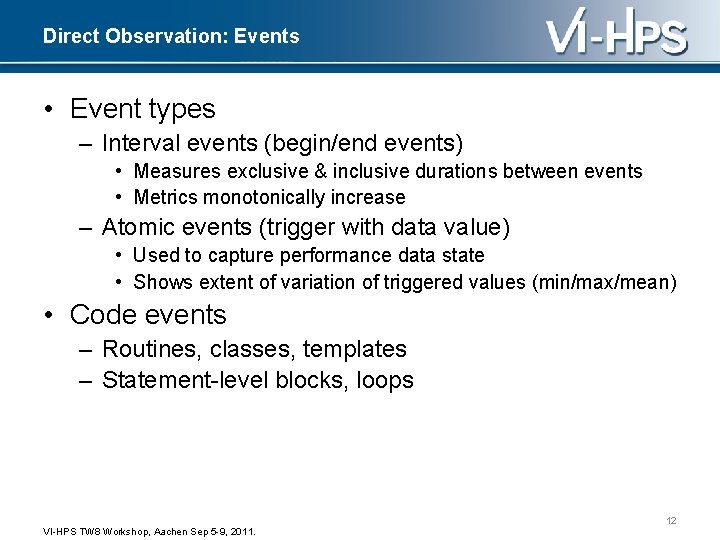
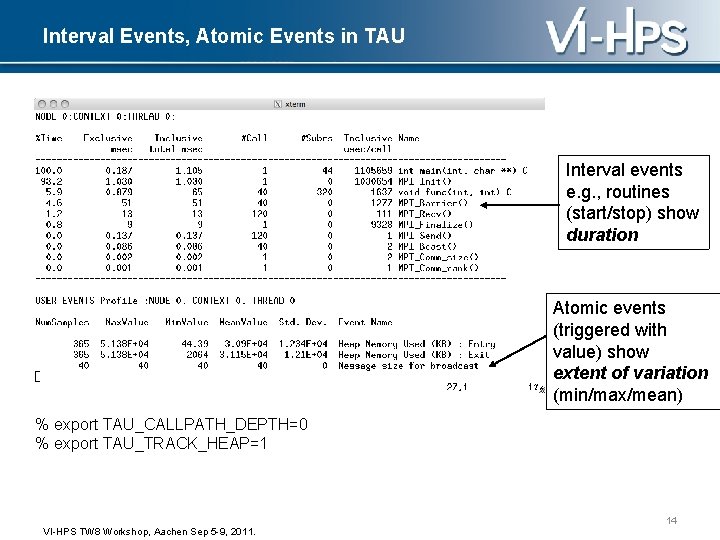
Direct Observation: Events • Event types – Interval events (begin/end events) • Measures exclusive & inclusive durations between events • Metrics monotonically increase – Atomic events (trigger with data value) • Used to capture performance data state • Shows extent of variation of triggered values (min/max/mean) • Code events – Routines, classes, templates – Statement-level blocks, loops 12 VI-HPS TW 8 Workshop, Aachen Sep 5 -9, 2011.

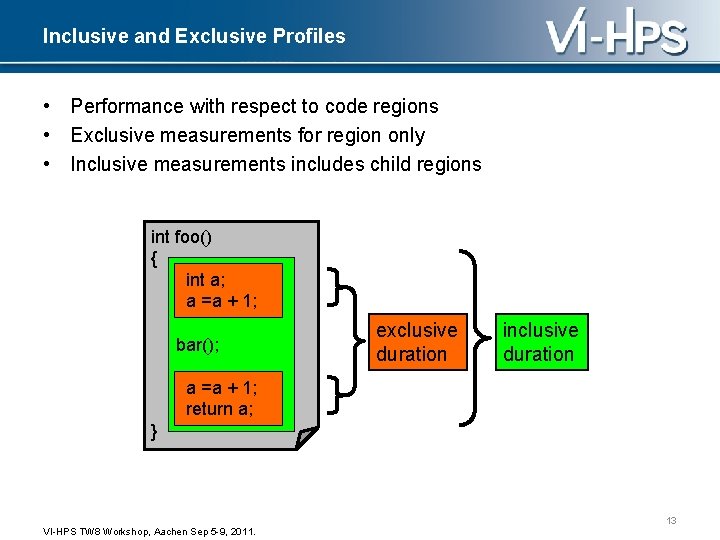
Inclusive and Exclusive Profiles • Performance with respect to code regions • Exclusive measurements for region only • Inclusive measurements includes child regions int foo() { int a; a =a + 1; bar(); exclusive duration inclusive duration a =a + 1; return a; } 13 VI-HPS TW 8 Workshop, Aachen Sep 5 -9, 2011.

Interval Events, Atomic Events in TAU Interval events e. g. , routines (start/stop) show duration Atomic events (triggered with value) show extent of variation (min/max/mean) % export TAU_CALLPATH_DEPTH=0 % export TAU_TRACK_HEAP=1 14 VI-HPS TW 8 Workshop, Aachen Sep 5 -9, 2011.

Atomic Events, Context Events Atomic events Context events =atomic event + executing context % export TAU_CALLPATH_DEPTH=1 Controls depth of executing context shown in profiles % export TAU_TRACK_HEAP=1 15 VI-HPS TW 8 Workshop, Aachen Sep 5 -9, 2011.

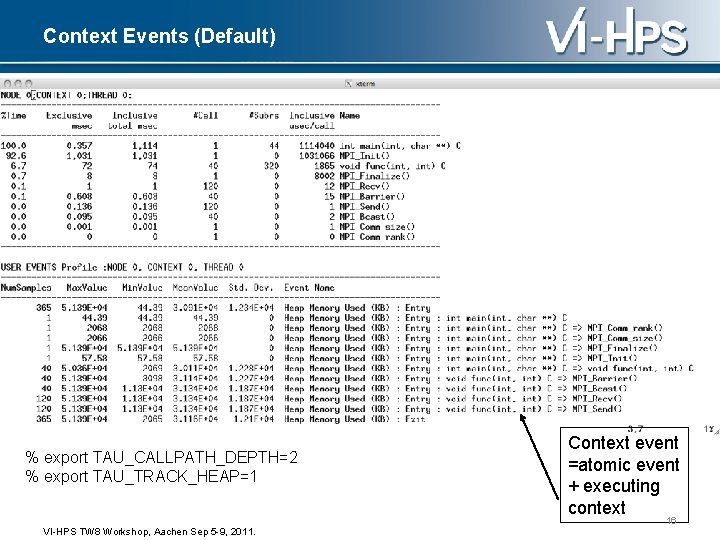
Context Events (Default) % export TAU_CALLPATH_DEPTH=2 % export TAU_TRACK_HEAP=1 Context event =atomic event + executing context 16 VI-HPS TW 8 Workshop, Aachen Sep 5 -9, 2011.

TAU Instrumentation / Measurement 17 VI-HPS TW 8 Workshop, Aachen Sep 5 -9, 2011.

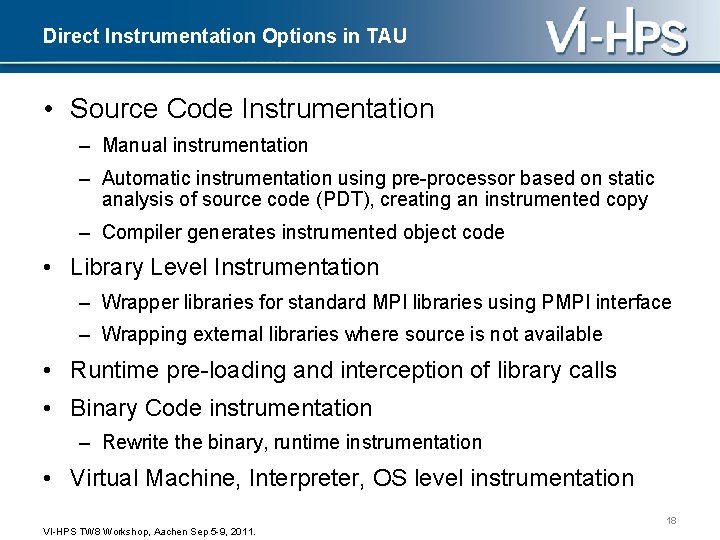
Direct Instrumentation Options in TAU • Source Code Instrumentation – Manual instrumentation – Automatic instrumentation using pre-processor based on static analysis of source code (PDT), creating an instrumented copy – Compiler generates instrumented object code • Library Level Instrumentation – Wrapper libraries for standard MPI libraries using PMPI interface – Wrapping external libraries where source is not available • Runtime pre-loading and interception of library calls • Binary Code instrumentation – Rewrite the binary, runtime instrumentation • Virtual Machine, Interpreter, OS level instrumentation 18 VI-HPS TW 8 Workshop, Aachen Sep 5 -9, 2011.

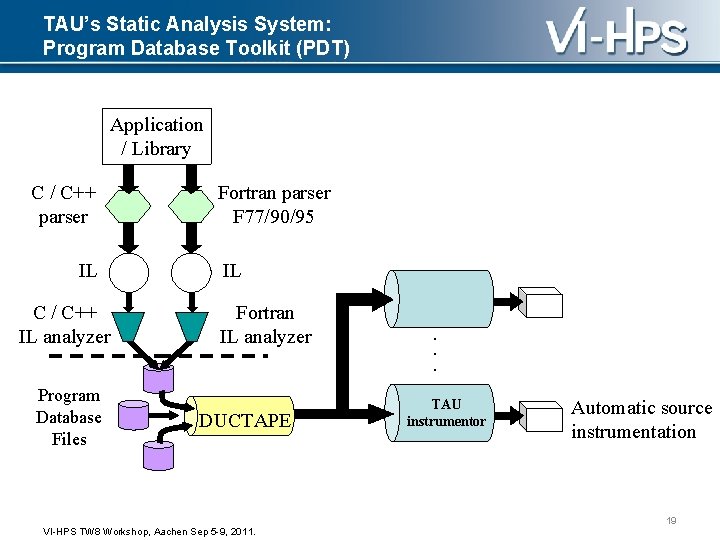
TAU’s Static Analysis System: Program Database Toolkit (PDT) Application / Library C / C++ parser IL C / C++ IL analyzer Program Database Files Fortran parser F 77/90/95 IL Fortran IL analyzer DUCTAPE . . . TAU instrumentor Automatic source instrumentation 19 VI-HPS TW 8 Workshop, Aachen Sep 5 -9, 2011.

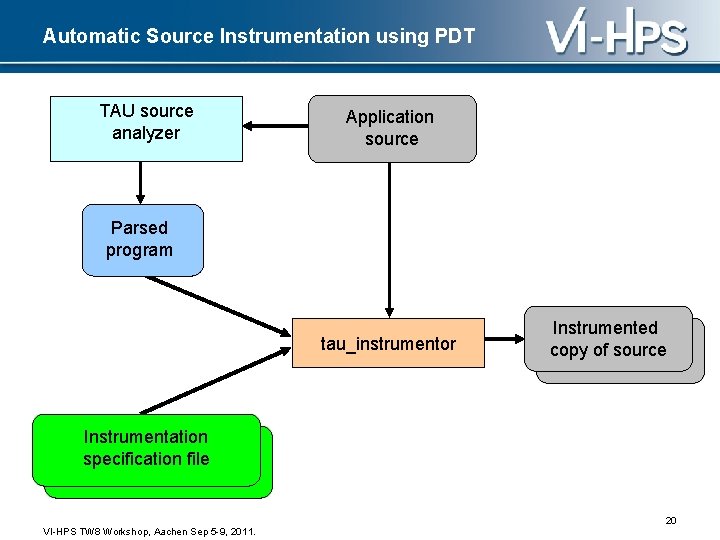
Automatic Source Instrumentation using PDT TAU source analyzer Application source Parsed program tau_instrumentor Instrumented copy of source Instrumentation specification file 20 VI-HPS TW 8 Workshop, Aachen Sep 5 -9, 2011.

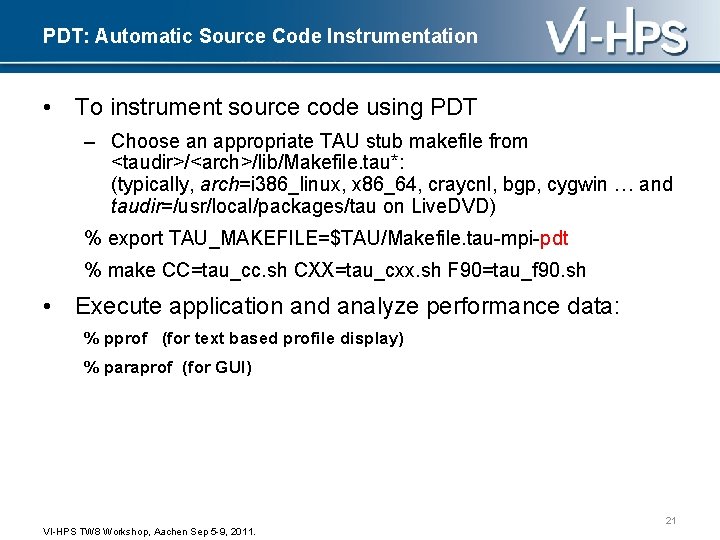
PDT: Automatic Source Code Instrumentation • To instrument source code using PDT – Choose an appropriate TAU stub makefile from <taudir>/<arch>/lib/Makefile. tau*: (typically, arch=i 386_linux, x 86_64, craycnl, bgp, cygwin … and taudir=/usr/local/packages/tau on Live. DVD) % export TAU_MAKEFILE=$TAU/Makefile. tau-mpi-pdt % make CC=tau_cc. sh CXX=tau_cxx. sh F 90=tau_f 90. sh • Execute application and analyze performance data: % pprof (for text based profile display) % paraprof (for GUI) 21 VI-HPS TW 8 Workshop, Aachen Sep 5 -9, 2011.

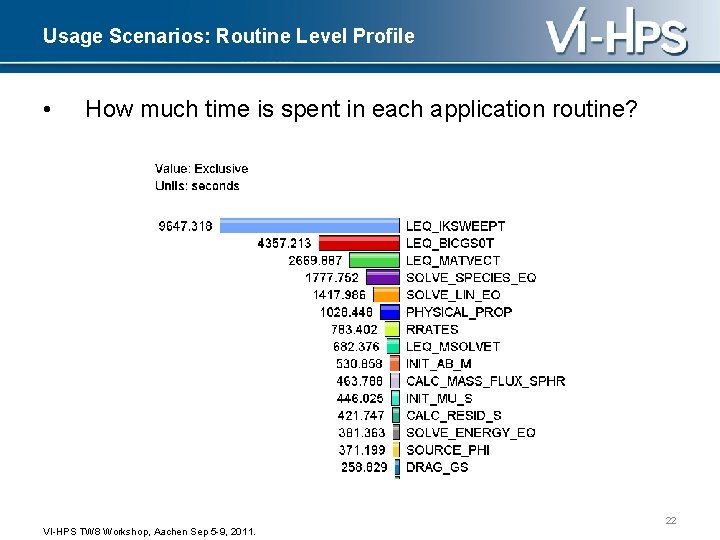
Usage Scenarios: Routine Level Profile • How much time is spent in each application routine? 22 VI-HPS TW 8 Workshop, Aachen Sep 5 -9, 2011.

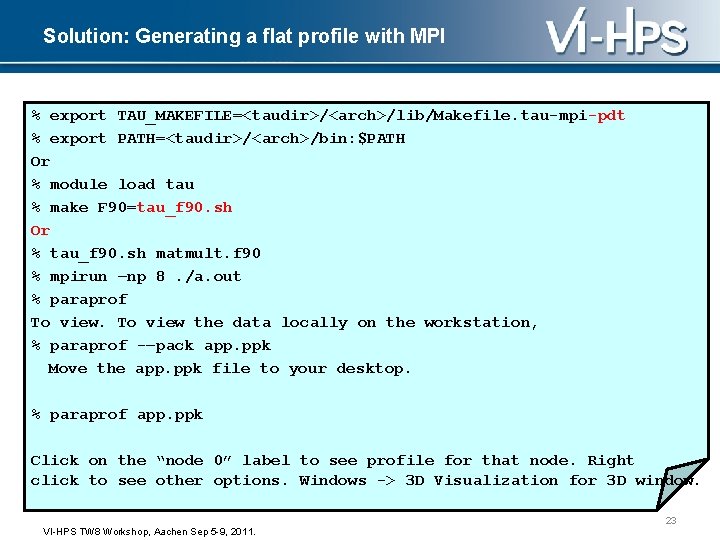
Solution: Generating a flat profile with MPI % export TAU_MAKEFILE=<taudir>/<arch>/lib/Makefile. tau-mpi-pdt % export PATH=<taudir>/<arch>/bin: $PATH Or % module load tau % make F 90=tau_f 90. sh Or % tau_f 90. sh matmult. f 90 % mpirun –np 8. /a. out % paraprof To view the data locally on the workstation, % paraprof -–pack app. ppk Move the app. ppk file to your desktop. % paraprof app. ppk Click on the “node 0” label to see profile for that node. Right click to see other options. Windows -> 3 D Visualization for 3 D window. 23 VI-HPS TW 8 Workshop, Aachen Sep 5 -9, 2011.

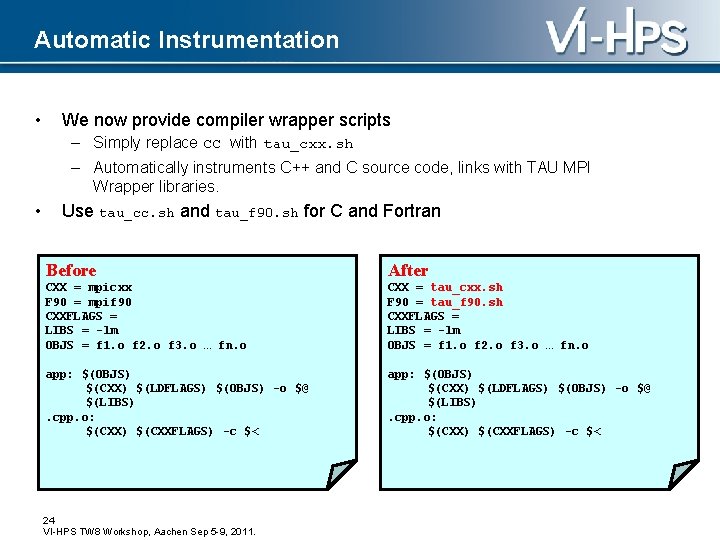
Automatic Instrumentation • We now provide compiler wrapper scripts – Simply replace CC with tau_cxx. sh – Automatically instruments C++ and C source code, links with TAU MPI Wrapper libraries. • Use tau_cc. sh and tau_f 90. sh for C and Fortran Before After CXX = mpicxx F 90 = mpif 90 CXXFLAGS = LIBS = -lm OBJS = f 1. o f 2. o f 3. o … fn. o CXX = tau_cxx. sh F 90 = tau_f 90. sh CXXFLAGS = LIBS = -lm OBJS = f 1. o f 2. o f 3. o … fn. o app: $(OBJS) $(CXX) $(LDFLAGS) $(OBJS) -o $@ $(LIBS). cpp. o: $(CXX) $(CXXFLAGS) -c $< 24 VI-HPS TW 8 Workshop, Aachen Sep 5 -9, 2011.

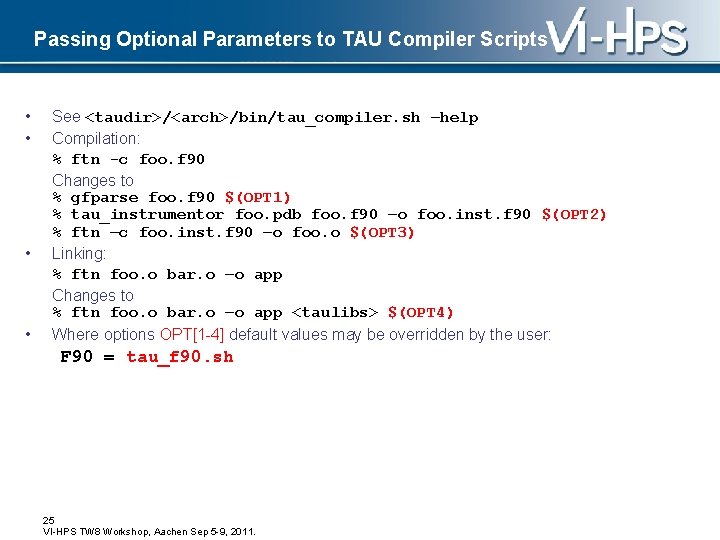
Passing Optional Parameters to TAU Compiler Scripts • • See <taudir>/<arch>/bin/tau_compiler. sh –help Compilation: % ftn -c foo. f 90 Changes to % gfparse foo. f 90 $(OPT 1) % tau_instrumentor foo. pdb foo. f 90 –o foo. inst. f 90 $(OPT 2) % ftn –c foo. inst. f 90 –o foo. o $(OPT 3) Linking: % ftn foo. o bar. o –o app Changes to % ftn foo. o bar. o –o app <taulibs> $(OPT 4) Where options OPT[1 -4] default values may be overridden by the user: F 90 = tau_f 90. sh 25 VI-HPS TW 8 Workshop, Aachen Sep 5 -9, 2011.

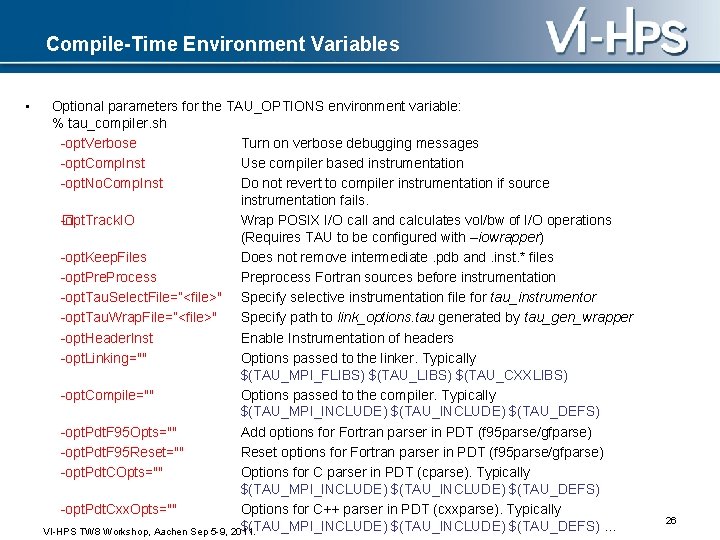
Compile-Time Environment Variables • Optional parameters for the TAU_OPTIONS environment variable: % tau_compiler. sh -opt. Verbose Turn on verbose debugging messages -opt. Comp. Inst Use compiler based instrumentation -opt. No. Comp. Inst Do not revert to compiler instrumentation if source instrumentation fails. -opt. Track. IO � Wrap POSIX I/O call and calculates vol/bw of I/O operations (Requires TAU to be configured with –iowrapper) -opt. Keep. Files Does not remove intermediate. pdb and. inst. * files -opt. Pre. Process Preprocess Fortran sources before instrumentation -opt. Tau. Select. File=”<file>" Specify selective instrumentation file for tau_instrumentor -opt. Tau. Wrap. File=”<file>" Specify path to link_options. tau generated by tau_gen_wrapper -opt. Header. Inst Enable Instrumentation of headers -opt. Linking="" Options passed to the linker. Typically $(TAU_MPI_FLIBS) $(TAU_CXXLIBS) -opt. Compile="" Options passed to the compiler. Typically $(TAU_MPI_INCLUDE) $(TAU_DEFS) -opt. Pdt. F 95 Opts="" Add options for Fortran parser in PDT (f 95 parse/gfparse) -opt. Pdt. F 95 Reset="" Reset options for Fortran parser in PDT (f 95 parse/gfparse) -opt. Pdt. COpts="" Options for C parser in PDT (cparse). Typically $(TAU_MPI_INCLUDE) $(TAU_DEFS) -opt. Pdt. Cxx. Opts="" Options for C++ parser in PDT (cxxparse). Typically $(TAU_MPI_INCLUDE) $(TAU_DEFS). . . VI-HPS TW 8 Workshop, Aachen Sep 5 -9, 2011. 26

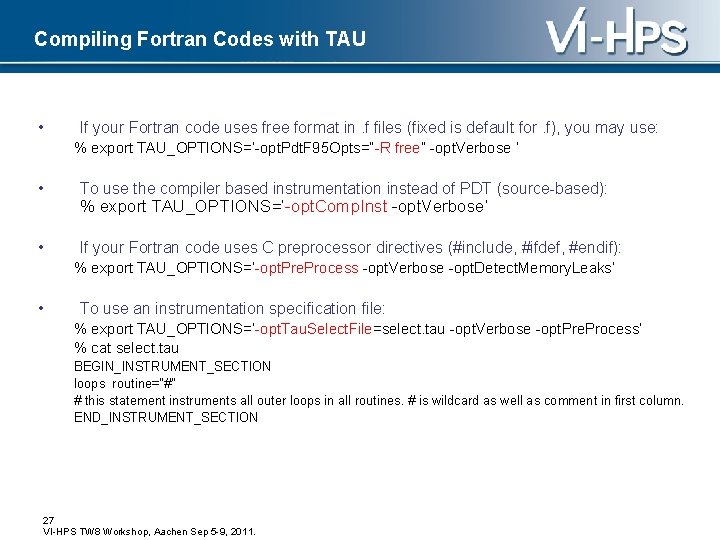
Compiling Fortran Codes with TAU • If your Fortran code uses free format in. f files (fixed is default for. f), you may use: % export TAU_OPTIONS=‘-opt. Pdt. F 95 Opts=“-R free” -opt. Verbose ’ • To use the compiler based instrumentation instead of PDT (source-based): • If your Fortran code uses C preprocessor directives (#include, #ifdef, #endif): % export TAU_OPTIONS=‘-opt. Comp. Inst -opt. Verbose’ % export TAU_OPTIONS=‘-opt. Pre. Process -opt. Verbose -opt. Detect. Memory. Leaks’ • To use an instrumentation specification file: % export TAU_OPTIONS=‘-opt. Tau. Select. File=select. tau -opt. Verbose -opt. Pre. Process’ % cat select. tau BEGIN_INSTRUMENT_SECTION loops routine=“#” # this statement instruments all outer loops in all routines. # is wildcard as well as comment in first column. END_INSTRUMENT_SECTION 27 VI-HPS TW 8 Workshop, Aachen Sep 5 -9, 2011.

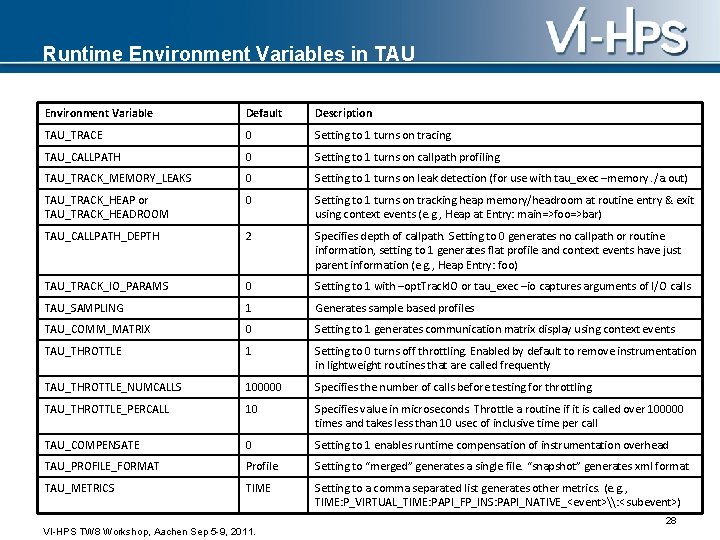
Runtime Environment Variables in TAU Environment Variable Default Description TAU_TRACE 0 Setting to 1 turns on tracing TAU_CALLPATH 0 Setting to 1 turns on callpath profiling TAU_TRACK_MEMORY_LEAKS 0 Setting to 1 turns on leak detection (for use with tau_exec –memory. /a. out) TAU_TRACK_HEAP or TAU_TRACK_HEADROOM 0 Setting to 1 turns on tracking heap memory/headroom at routine entry & exit using context events (e. g. , Heap at Entry: main=>foo=>bar) TAU_CALLPATH_DEPTH 2 Specifies depth of callpath. Setting to 0 generates no callpath or routine information, setting to 1 generates flat profile and context events have just parent information (e. g. , Heap Entry: foo) TAU_TRACK_IO_PARAMS 0 Setting to 1 with –opt. Track. IO or tau_exec –io captures arguments of I/O calls TAU_SAMPLING 1 Generates sample based profiles TAU_COMM_MATRIX 0 Setting to 1 generates communication matrix display using context events TAU_THROTTLE 1 Setting to 0 turns off throttling. Enabled by default to remove instrumentation in lightweight routines that are called frequently TAU_THROTTLE_NUMCALLS 100000 Specifies the number of calls before testing for throttling TAU_THROTTLE_PERCALL 10 Specifies value in microseconds. Throttle a routine if it is called over 100000 times and takes less than 10 usec of inclusive time per call TAU_COMPENSATE 0 Setting to 1 enables runtime compensation of instrumentation overhead TAU_PROFILE_FORMAT Profile Setting to “merged” generates a single file. “snapshot” generates xml format TAU_METRICS TIME Setting to a comma separated list generates other metrics. (e. g. , TIME: P_VIRTUAL_TIME: PAPI_FP_INS: PAPI_NATIVE_<event>\: <subevent>) 28 VI-HPS TW 8 Workshop, Aachen Sep 5 -9, 2011.

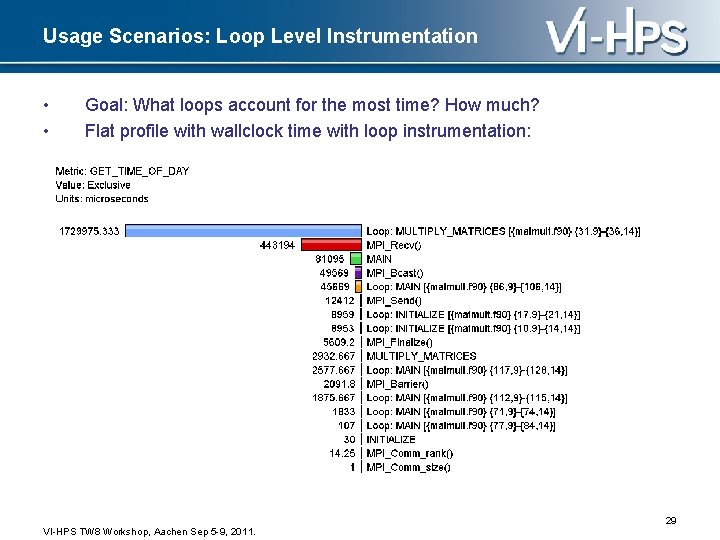
Usage Scenarios: Loop Level Instrumentation • • Goal: What loops account for the most time? How much? Flat profile with wallclock time with loop instrumentation: 29 VI-HPS TW 8 Workshop, Aachen Sep 5 -9, 2011.

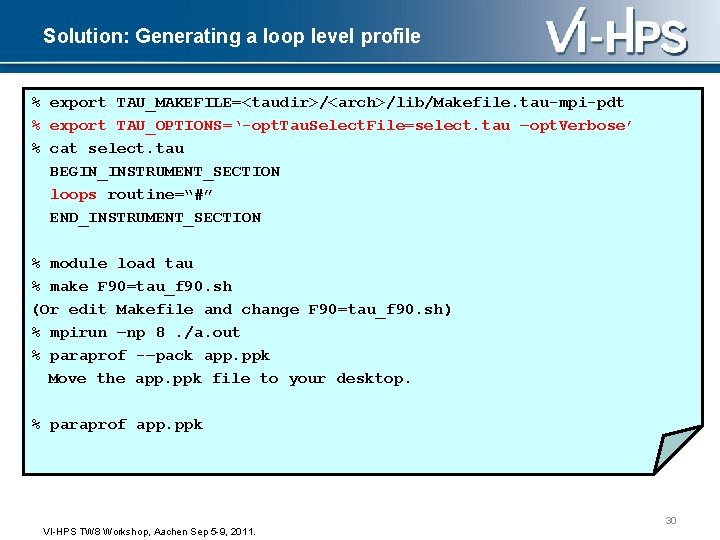
Solution: Generating a loop level profile % export TAU_MAKEFILE=<taudir>/<arch>/lib/Makefile. tau-mpi-pdt % export TAU_OPTIONS=‘-opt. Tau. Select. File=select. tau –opt. Verbose’ % cat select. tau BEGIN_INSTRUMENT_SECTION loops routine=“#” END_INSTRUMENT_SECTION % module load tau % make F 90=tau_f 90. sh (Or edit Makefile and change F 90=tau_f 90. sh) % mpirun –np 8. /a. out % paraprof -–pack app. ppk Move the app. ppk file to your desktop. % paraprof app. ppk 30 VI-HPS TW 8 Workshop, Aachen Sep 5 -9, 2011.

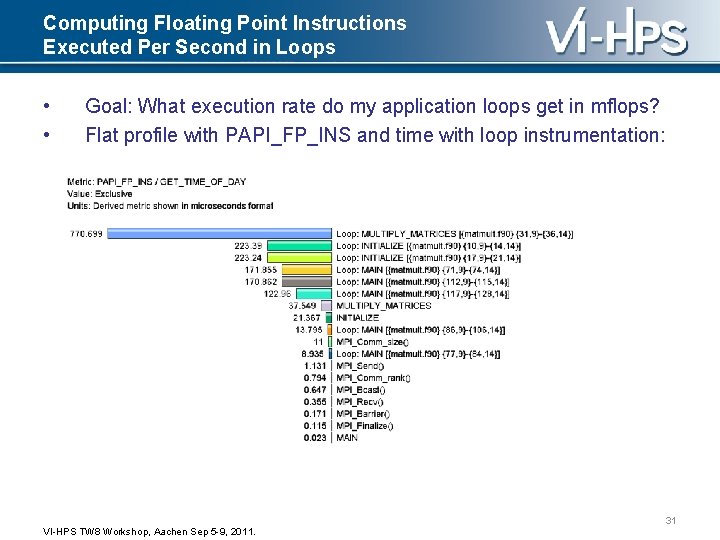
Computing Floating Point Instructions Executed Per Second in Loops • • Goal: What execution rate do my application loops get in mflops? Flat profile with PAPI_FP_INS and time with loop instrumentation: 31 VI-HPS TW 8 Workshop, Aachen Sep 5 -9, 2011.

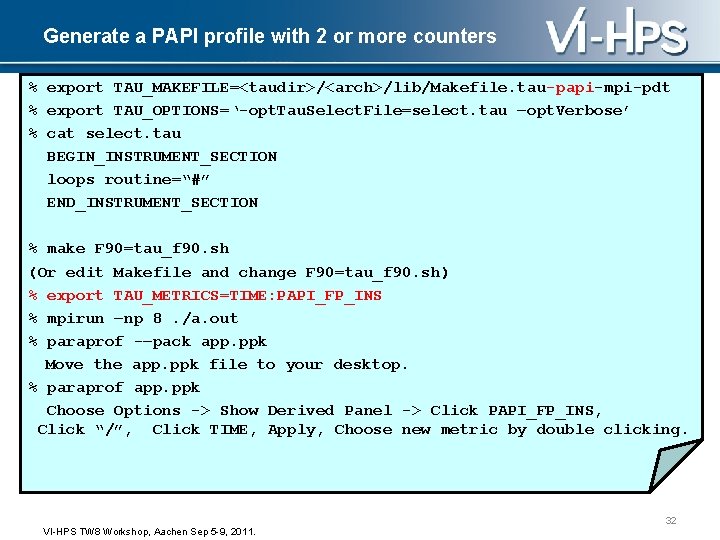
Generate a PAPI profile with 2 or more counters % export TAU_MAKEFILE=<taudir>/<arch>/lib/Makefile. tau-papi-mpi-pdt % export TAU_OPTIONS=‘-opt. Tau. Select. File=select. tau –opt. Verbose’ % cat select. tau BEGIN_INSTRUMENT_SECTION loops routine=“#” END_INSTRUMENT_SECTION % make F 90=tau_f 90. sh (Or edit Makefile and change F 90=tau_f 90. sh) % export TAU_METRICS=TIME: PAPI_FP_INS % mpirun –np 8. /a. out % paraprof -–pack app. ppk Move the app. ppk file to your desktop. % paraprof app. ppk Choose Options -> Show Derived Panel -> Click PAPI_FP_INS, Click “/”, Click TIME, Apply, Choose new metric by double clicking. 32 VI-HPS TW 8 Workshop, Aachen Sep 5 -9, 2011.

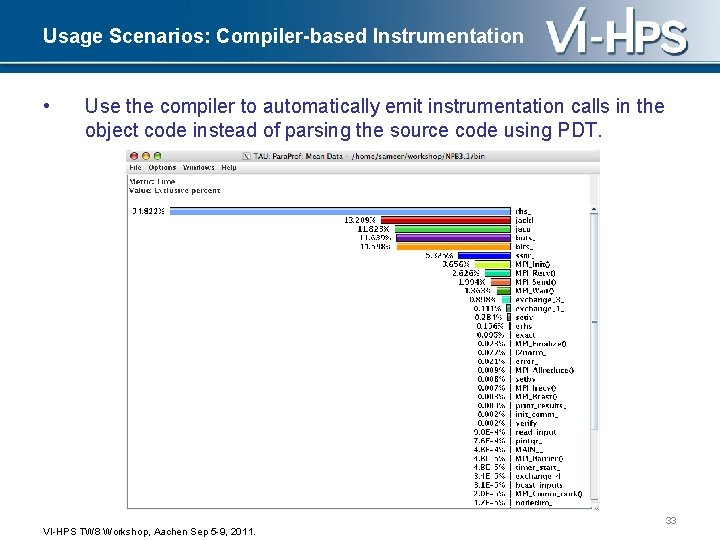
Usage Scenarios: Compiler-based Instrumentation • Use the compiler to automatically emit instrumentation calls in the object code instead of parsing the source code using PDT. 33 VI-HPS TW 8 Workshop, Aachen Sep 5 -9, 2011.

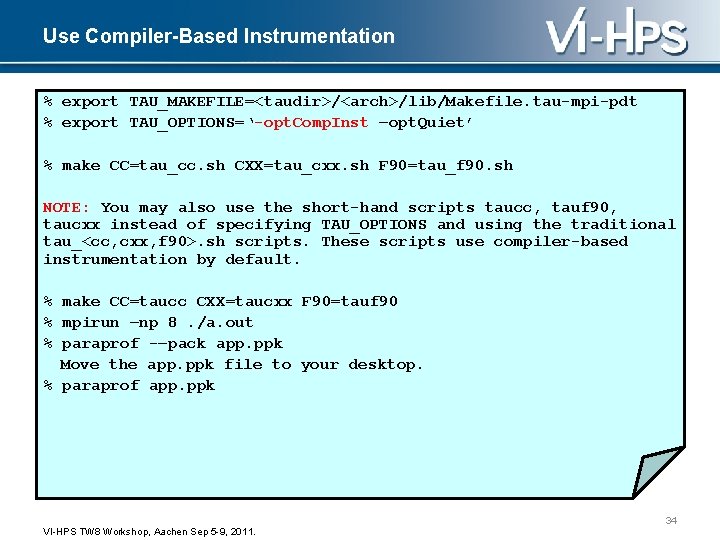
Use Compiler-Based Instrumentation % export TAU_MAKEFILE=<taudir>/<arch>/lib/Makefile. tau-mpi-pdt % export TAU_OPTIONS=‘-opt. Comp. Inst –opt. Quiet’ % make CC=tau_cc. sh CXX=tau_cxx. sh F 90=tau_f 90. sh NOTE: You may also use the short-hand scripts taucc, tauf 90, taucxx instead of specifying TAU_OPTIONS and using the traditional tau_<cc, cxx, f 90>. sh scripts. These scripts use compiler-based instrumentation by default. % make CC=taucc CXX=taucxx F 90=tauf 90 % mpirun –np 8. /a. out % paraprof -–pack app. ppk Move the app. ppk file to your desktop. % paraprof app. ppk 34 VI-HPS TW 8 Workshop, Aachen Sep 5 -9, 2011.

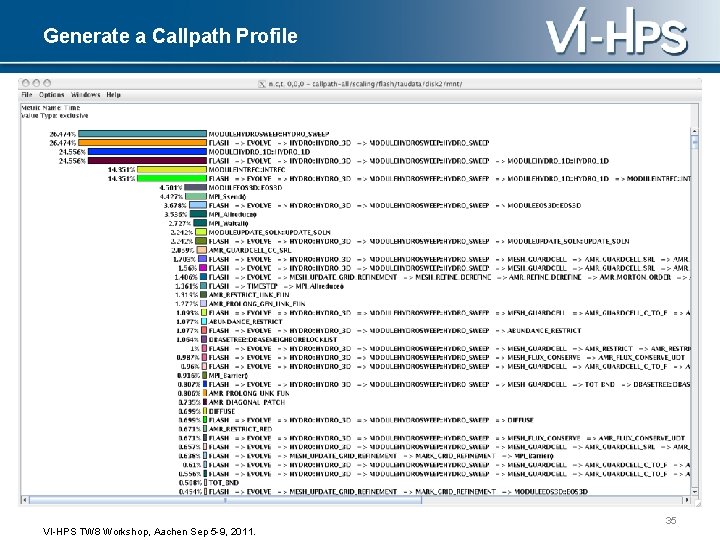
Generate a Callpath Profile 35 VI-HPS TW 8 Workshop, Aachen Sep 5 -9, 2011.

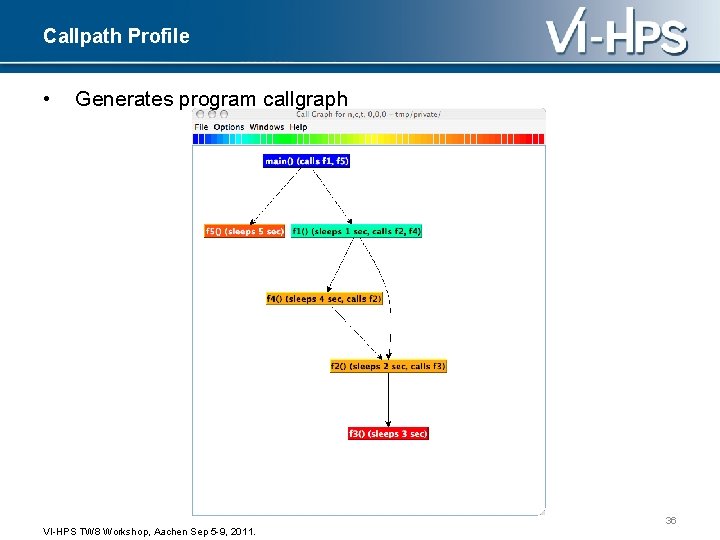
Callpath Profile • Generates program callgraph 36 VI-HPS TW 8 Workshop, Aachen Sep 5 -9, 2011.

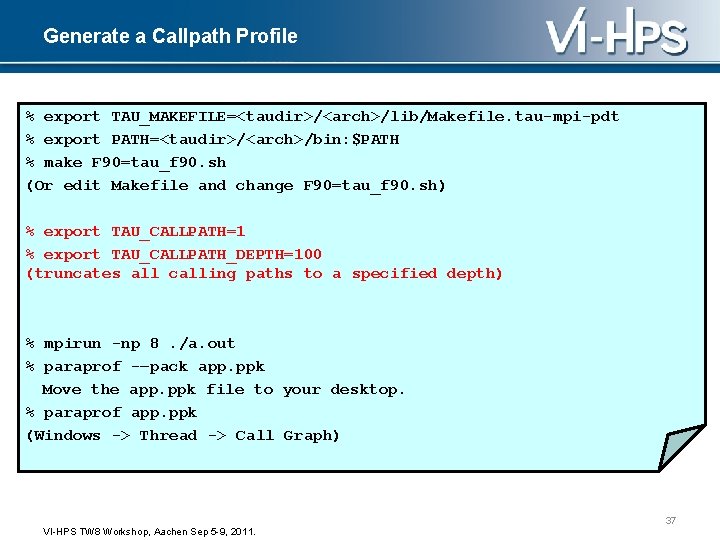
Generate a Callpath Profile % export TAU_MAKEFILE=<taudir>/<arch>/lib/Makefile. tau-mpi-pdt % export PATH=<taudir>/<arch>/bin: $PATH % make F 90=tau_f 90. sh (Or edit Makefile and change F 90=tau_f 90. sh) % export TAU_CALLPATH=1 % export TAU_CALLPATH_DEPTH=100 (truncates all calling paths to a specified depth) % mpirun -np 8. /a. out % paraprof -–pack app. ppk Move the app. ppk file to your desktop. % paraprof app. ppk (Windows -> Thread -> Call Graph) 37 VI-HPS TW 8 Workshop, Aachen Sep 5 -9, 2011.

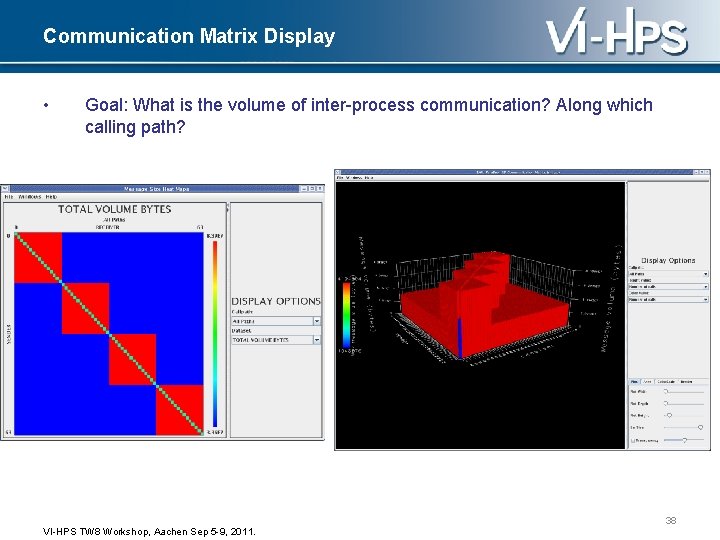
Communication Matrix Display • Goal: What is the volume of inter-process communication? Along which calling path? 38 VI-HPS TW 8 Workshop, Aachen Sep 5 -9, 2011.

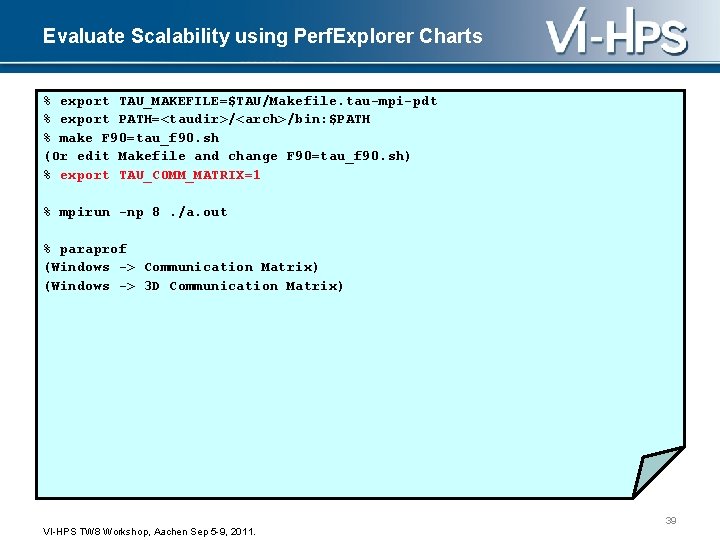
Evaluate Scalability using Perf. Explorer Charts % export TAU_MAKEFILE=$TAU/Makefile. tau-mpi-pdt % export PATH=<taudir>/<arch>/bin: $PATH % make F 90=tau_f 90. sh (Or edit Makefile and change F 90=tau_f 90. sh) % export TAU_COMM_MATRIX=1 % mpirun -np 8. /a. out % paraprof (Windows -> Communication Matrix) (Windows -> 3 D Communication Matrix) 39 VI-HPS TW 8 Workshop, Aachen Sep 5 -9, 2011.

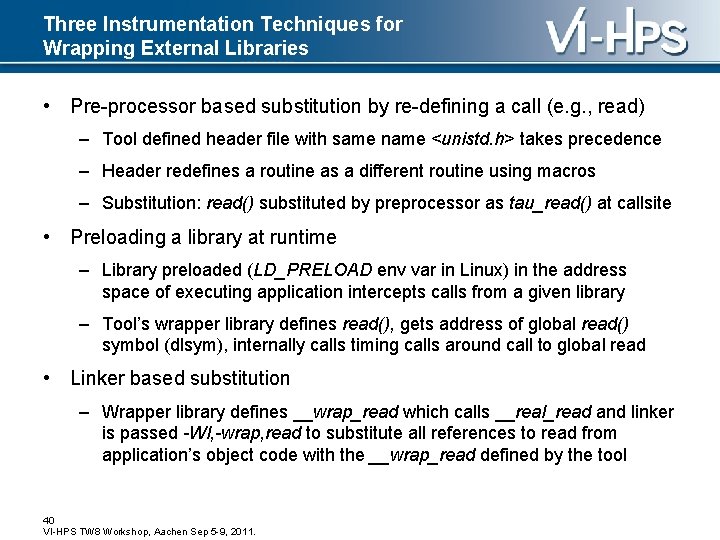
Three Instrumentation Techniques for Wrapping External Libraries • Pre-processor based substitution by re-defining a call (e. g. , read) – Tool defined header file with same name <unistd. h> takes precedence – Header redefines a routine as a different routine using macros – Substitution: read() substituted by preprocessor as tau_read() at callsite • Preloading a library at runtime – Library preloaded (LD_PRELOAD env var in Linux) in the address space of executing application intercepts calls from a given library – Tool’s wrapper library defines read(), gets address of global read() symbol (dlsym), internally calls timing calls around call to global read • Linker based substitution – Wrapper library defines __wrap_read which calls __real_read and linker is passed -Wl, -wrap, read to substitute all references to read from application’s object code with the __wrap_read defined by the tool 40 VI-HPS TW 8 Workshop, Aachen Sep 5 -9, 2011.

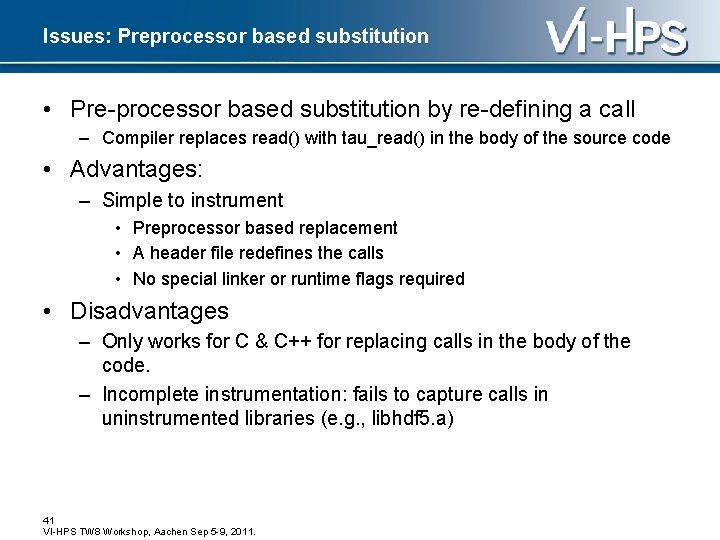
Issues: Preprocessor based substitution • Pre-processor based substitution by re-defining a call – Compiler replaces read() with tau_read() in the body of the source code • Advantages: – Simple to instrument • Preprocessor based replacement • A header file redefines the calls • No special linker or runtime flags required • Disadvantages – Only works for C & C++ for replacing calls in the body of the code. – Incomplete instrumentation: fails to capture calls in uninstrumented libraries (e. g. , libhdf 5. a) 41 VI-HPS TW 8 Workshop, Aachen Sep 5 -9, 2011.

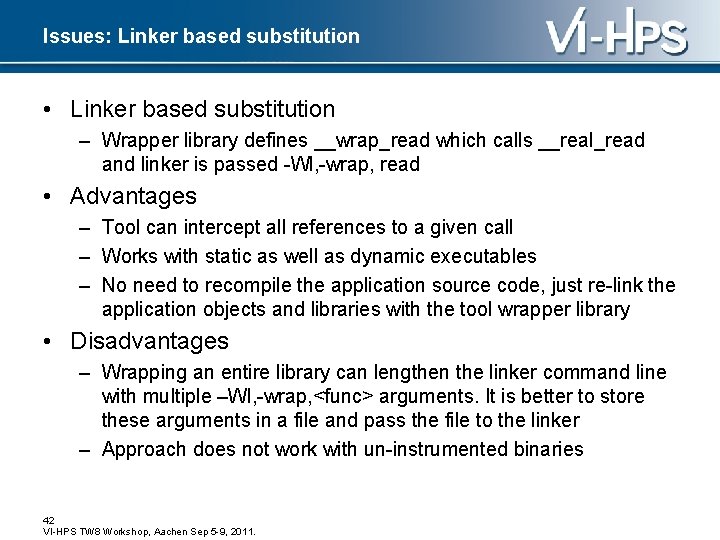
Issues: Linker based substitution • Linker based substitution – Wrapper library defines __wrap_read which calls __real_read and linker is passed -Wl, -wrap, read • Advantages – Tool can intercept all references to a given call – Works with static as well as dynamic executables – No need to recompile the application source code, just re-link the application objects and libraries with the tool wrapper library • Disadvantages – Wrapping an entire library can lengthen the linker command line with multiple –Wl, -wrap, <func> arguments. It is better to store these arguments in a file and pass the file to the linker – Approach does not work with un-instrumented binaries 42 VI-HPS TW 8 Workshop, Aachen Sep 5 -9, 2011.

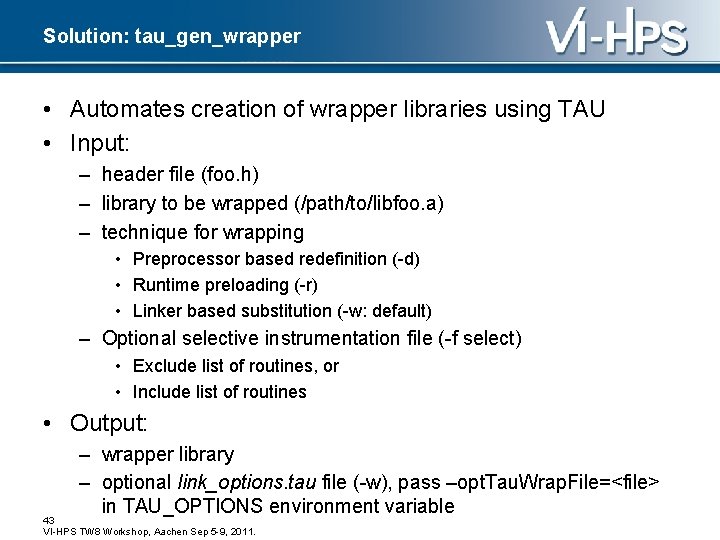
Solution: tau_gen_wrapper • Automates creation of wrapper libraries using TAU • Input: – header file (foo. h) – library to be wrapped (/path/to/libfoo. a) – technique for wrapping • Preprocessor based redefinition (-d) • Runtime preloading (-r) • Linker based substitution (-w: default) – Optional selective instrumentation file (-f select) • Exclude list of routines, or • Include list of routines • Output: – wrapper library – optional link_options. tau file (-w), pass –opt. Tau. Wrap. File=<file> in TAU_OPTIONS environment variable 43 VI-HPS TW 8 Workshop, Aachen Sep 5 -9, 2011.

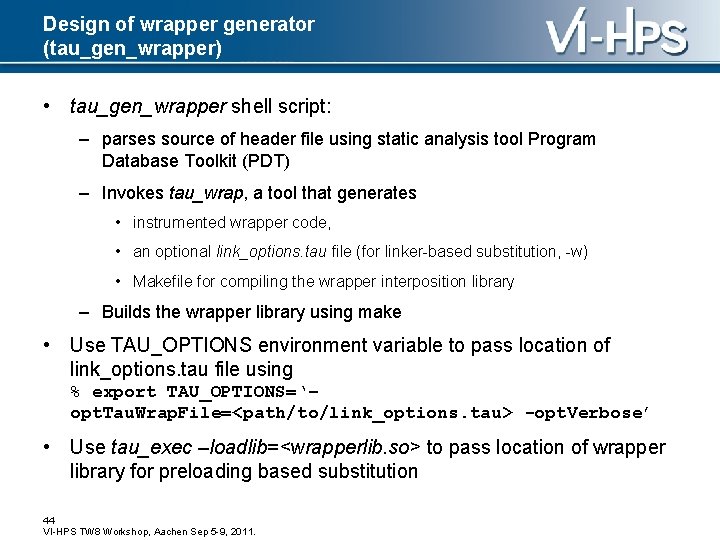
Design of wrapper generator (tau_gen_wrapper) • tau_gen_wrapper shell script: – parses source of header file using static analysis tool Program Database Toolkit (PDT) – Invokes tau_wrap, a tool that generates • instrumented wrapper code, • an optional link_options. tau file (for linker-based substitution, -w) • Makefile for compiling the wrapper interposition library – Builds the wrapper library using make • Use TAU_OPTIONS environment variable to pass location of link_options. tau file using % export TAU_OPTIONS=‘– opt. Tau. Wrap. File=<path/to/link_options. tau> -opt. Verbose’ • Use tau_exec –loadlib=<wrapperlib. so> to pass location of wrapper library for preloading based substitution 44 VI-HPS TW 8 Workshop, Aachen Sep 5 -9, 2011.

tau_wrap 45 VI-HPS TW 8 Workshop, Aachen Sep 5 -9, 2011.
![HDF 5 Library Wrapping sameerzorak taugenwrapper hdf 5 h usrlibhdf 5 a f select HDF 5 Library Wrapping [sameer@zorak]$ tau_gen_wrapper hdf 5. h /usr/libhdf 5. a -f select.](https://slidetodoc.com/presentation_image_h/00f9c6370c8d8c6c688be1b0ba185565/image-46.jpg)
HDF 5 Library Wrapping [sameer@zorak]$ tau_gen_wrapper hdf 5. h /usr/libhdf 5. a -f select. tau Usage : tau_gen_wrapper <header> <library> [-r|-d|-w (default)] [-g groupname] [-i headerfile] [-c|-c++|-fortran] [ -f <instr_spec_file> ] • instruments using runtime preloading (-r), or -Wl, -wrap linker (-w), redirection of header file to redefine the wrapped routine (-d) • instrumentation specification file (select. tau) • group (hdf 5) • tau_exec loads libhdf 5_wrap. so shared library using –loadlib=<libwrap_pkg. so> • creates the wrapper/ directory NODE 0; CONTEXT 0; THREAD 0: -------------------------------------------%Time Exclusive Inclusive #Call #Subrs Inclusive Name msec total msec usec/call -------------------------------------------100. 057 1 1 13 1236. TAU Application 70. 875 1 0 875 hid_t H 5 Fcreate() 9. 7 0. 12 1 0 120 herr_t H 5 Fclose() 6. 0 0. 074 1 0 74 hid_t H 5 Dcreate() 3. 1 0. 038 1 0 38 herr_t H 5 Dwrite() 2. 6 0. 032 1 0 32 herr_t H 5 Dclose() 2. 1 0. 026 1 0 26 herr_t H 5 check_version() 0. 6 0. 008 1 0 8 hid_t H 5 Screate_simple() 0. 2 0. 002 1 0 2 herr_t H 5 Tset_order() 0. 2 0. 002 1 0 2 hid_t H 5 Tcopy() 0. 1 0. 001 1 0 1 herr_t H 5 Sclose() 0. 1 0. 001 2 0 0 herr_t H 5 open() 0. 0 0 0 1 0 0 herr_t H 5 Tclose() VI-HPS TW 8 Workshop, Aachen Sep 5 -9, 2011. 46

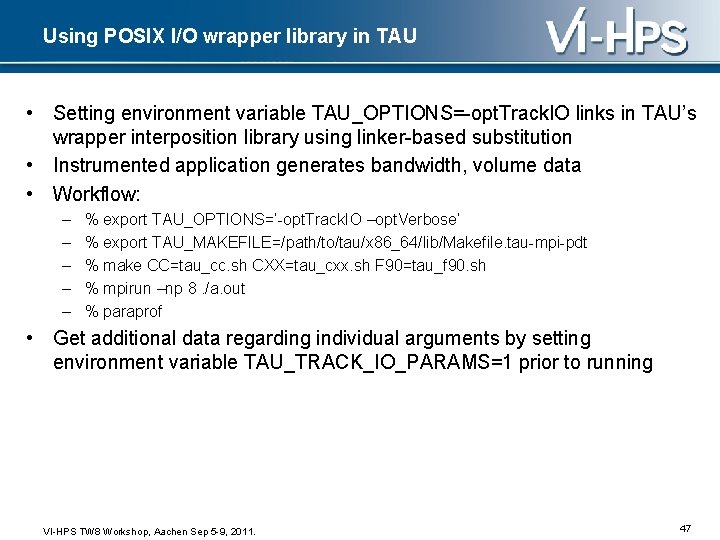
Using POSIX I/O wrapper library in TAU • Setting environment variable TAU_OPTIONS=-opt. Track. IO links in TAU’s wrapper interposition library using linker-based substitution • Instrumented application generates bandwidth, volume data • Workflow: – – – % export TAU_OPTIONS=‘-opt. Track. IO –opt. Verbose’ % export TAU_MAKEFILE=/path/to/tau/x 86_64/lib/Makefile. tau-mpi-pdt % make CC=tau_cc. sh CXX=tau_cxx. sh F 90=tau_f 90. sh % mpirun –np 8. /a. out % paraprof • Get additional data regarding individual arguments by setting environment variable TAU_TRACK_IO_PARAMS=1 prior to running VI-HPS TW 8 Workshop, Aachen Sep 5 -9, 2011. 47

Issues: Preloading a wrapper library at runtime • Preloading a library at runtime – Tool defines read(), gets address of global read() symbol (dlsym), internally calls timing calls around call to global read – tau_exec tool uses this mechanism to intercept library calls • Advantages – No need to re-compile or re-link the application source code – Drop-in replacement library implemented using LD_PRELOAD environment variable under Linux, Cray CNL, IBM BG/P CNK, Solaris… • Disadvantages – Only works with dynamic executables. Default compilation mode under Cray XE 6 and IBM BG/P is to use static executables – Not all operating systems support preloading of dynamic shared objects (DSOs) 48 VI-HPS TW 8 Workshop, Aachen Sep 5 -9, 2011.

Runtime Preloading: tau_exec • Runtime instrumentation by pre-loading the measurement library • Works on dynamic executables (default under Linux) • Can substitute I/O, MPI, SHMEM, CUDA, Open. CL, and memory allocation/deallocation routines with instrumented calls • Track interval events (e. g. , time spent in write()) as well as atomic events (e. g. , how much memory was allocated) in wrappers • Accurately measure I/O and memory usage • Preload any wrapper interposition library in the context of the executing application 49 VI-HPS TW 8 Workshop, Aachen Sep 5 -9, 2011.

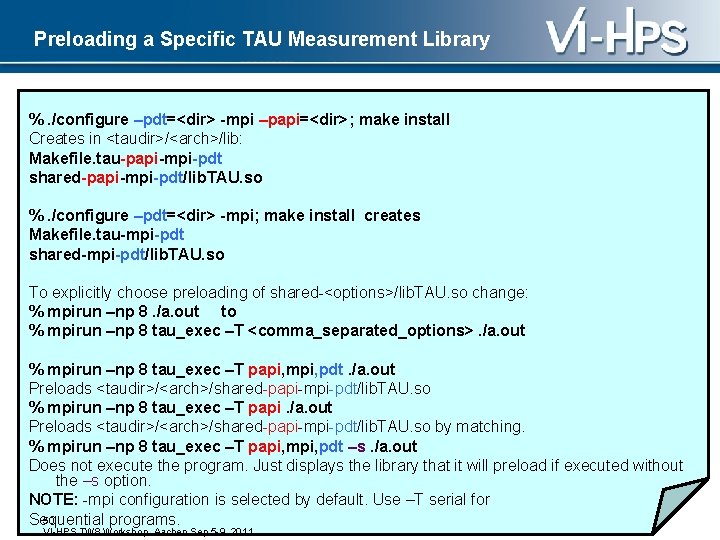
Preloading a Specific TAU Measurement Library %. /configure –pdt=<dir> -mpi –papi=<dir>; make install Creates in <taudir>/<arch>/lib: Makefile. tau-papi-mpi-pdt shared-papi-mpi-pdt/lib. TAU. so %. /configure –pdt=<dir> -mpi; make install creates Makefile. tau-mpi-pdt shared-mpi-pdt/lib. TAU. so To explicitly choose preloading of shared-<options>/lib. TAU. so change: % mpirun –np 8. /a. out to % mpirun –np 8 tau_exec –T <comma_separated_options>. /a. out % mpirun –np 8 tau_exec –T papi, mpi, pdt. /a. out Preloads <taudir>/<arch>/shared-papi-mpi-pdt/lib. TAU. so % mpirun –np 8 tau_exec –T papi. /a. out Preloads <taudir>/<arch>/shared-papi-mpi-pdt/lib. TAU. so by matching. % mpirun –np 8 tau_exec –T papi, mpi, pdt –s. /a. out Does not execute the program. Just displays the library that it will preload if executed without the –s option. NOTE: -mpi configuration is selected by default. Use –T serial for 50 Sequential programs. VI-HPS TW 8 Workshop, Aachen Sep 5 -9, 2011.

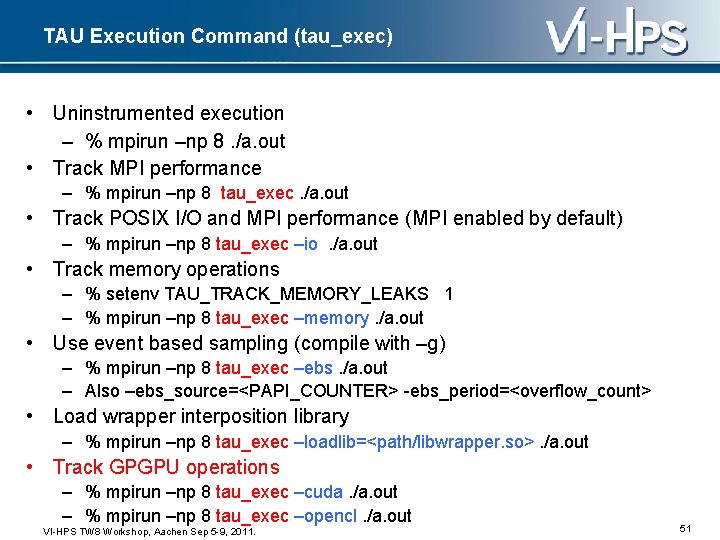
TAU Execution Command (tau_exec) • Uninstrumented execution – % mpirun –np 8. /a. out • Track MPI performance – % mpirun –np 8 tau_exec. /a. out • Track POSIX I/O and MPI performance (MPI enabled by default) – % mpirun –np 8 tau_exec –io. /a. out • Track memory operations – % setenv TAU_TRACK_MEMORY_LEAKS 1 – % mpirun –np 8 tau_exec –memory. /a. out • Use event based sampling (compile with –g) – % mpirun –np 8 tau_exec –ebs. /a. out – Also –ebs_source=<PAPI_COUNTER> -ebs_period=<overflow_count> • Load wrapper interposition library – % mpirun –np 8 tau_exec –loadlib=<path/libwrapper. so>. /a. out • Track GPGPU operations – % mpirun –np 8 tau_exec –cuda. /a. out – % mpirun –np 8 tau_exec –opencl. /a. out VI-HPS TW 8 Workshop, Aachen Sep 5 -9, 2011. 51

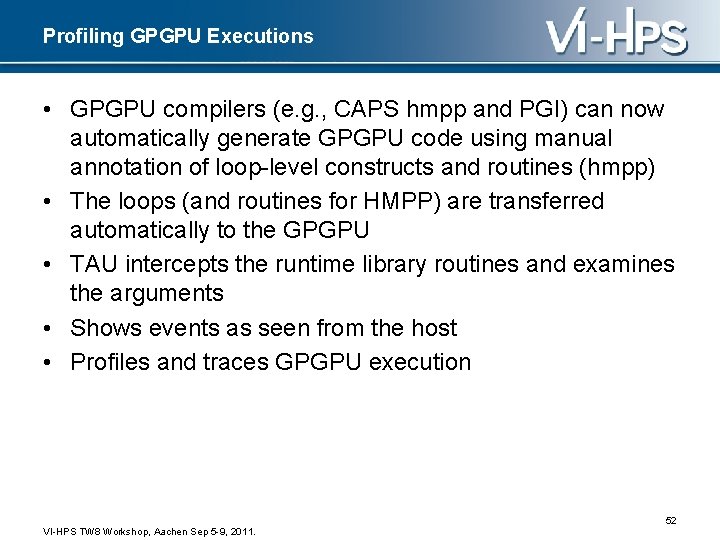
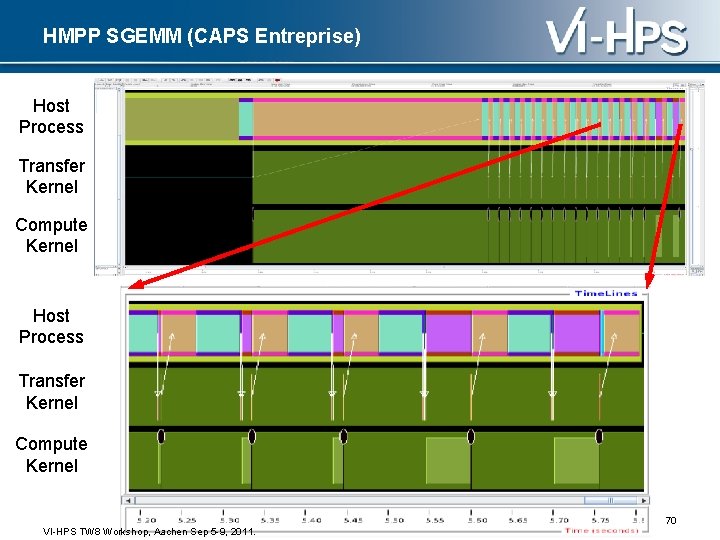
Profiling GPGPU Executions • GPGPU compilers (e. g. , CAPS hmpp and PGI) can now automatically generate GPGPU code using manual annotation of loop-level constructs and routines (hmpp) • The loops (and routines for HMPP) are transferred automatically to the GPGPU • TAU intercepts the runtime library routines and examines the arguments • Shows events as seen from the host • Profiles and traces GPGPU execution 52 VI-HPS TW 8 Workshop, Aachen Sep 5 -9, 2011.

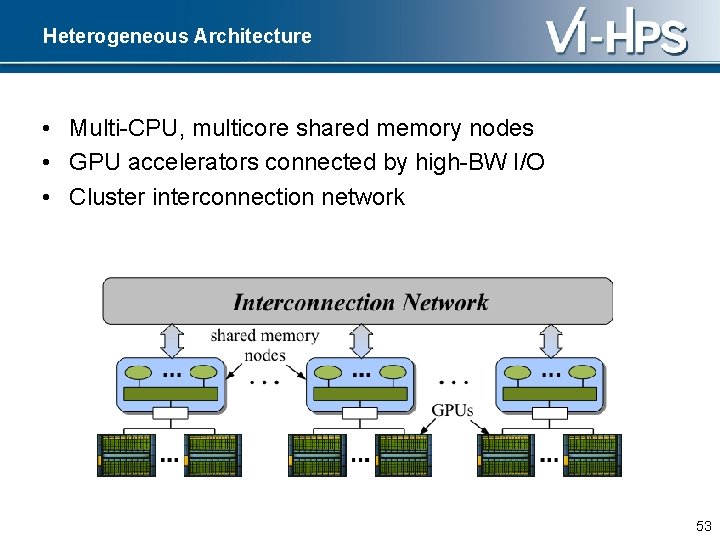
Heterogeneous Architecture • Multi-CPU, multicore shared memory nodes • GPU accelerators connected by high-BW I/O • Cluster interconnection network 53

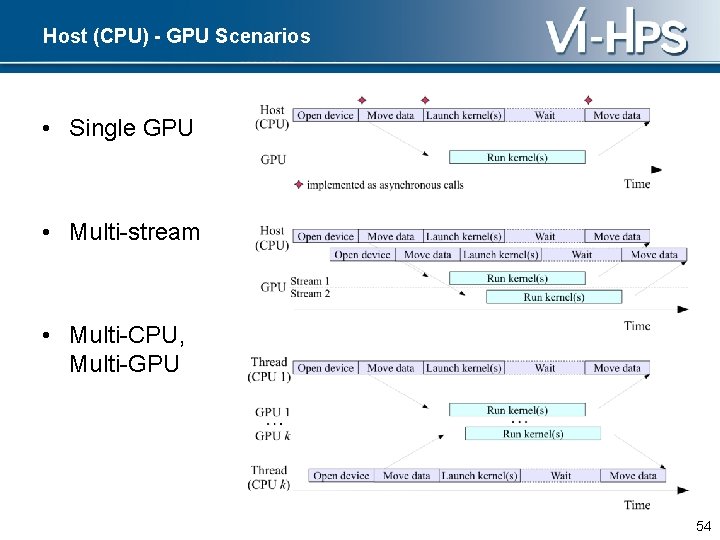
Host (CPU) - GPU Scenarios • Single GPU • Multi-stream • Multi-CPU, Multi-GPU 54

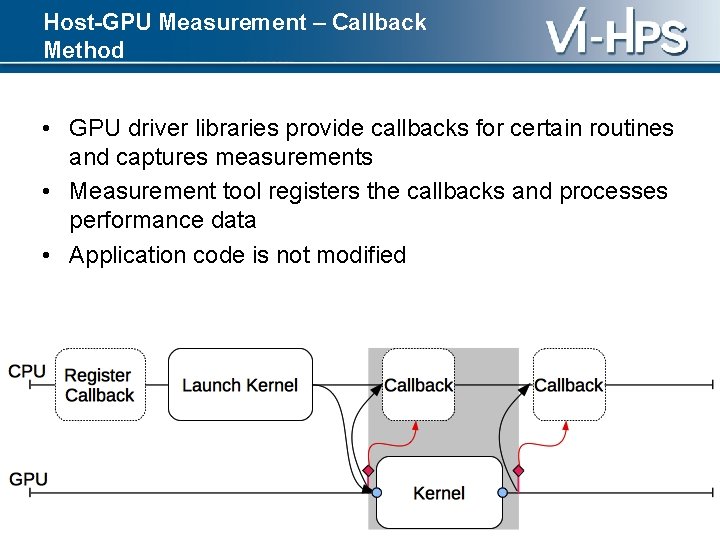
Host-GPU Measurement – Callback Method • GPU driver libraries provide callbacks for certain routines and captures measurements • Measurement tool registers the callbacks and processes performance data • Application code is not modified 55

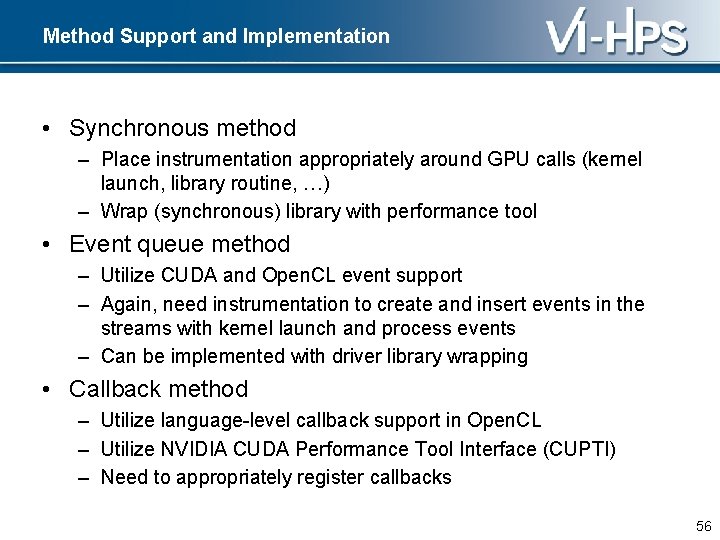
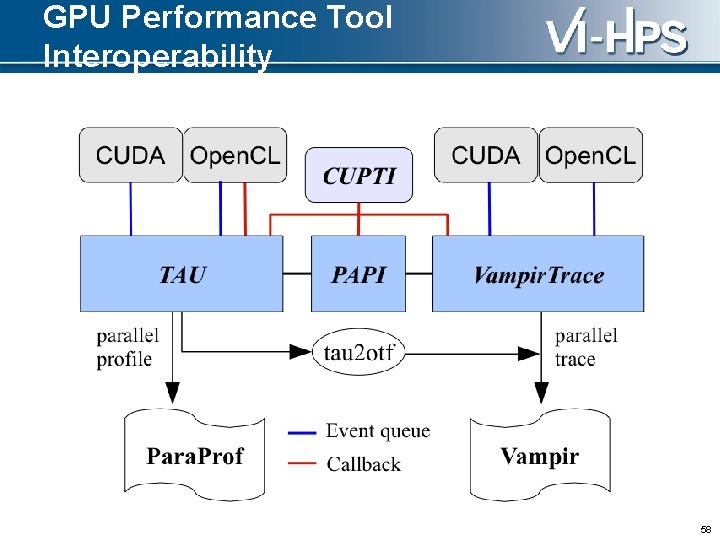
Method Support and Implementation • Synchronous method – Place instrumentation appropriately around GPU calls (kernel launch, library routine, …) – Wrap (synchronous) library with performance tool • Event queue method – Utilize CUDA and Open. CL event support – Again, need instrumentation to create and insert events in the streams with kernel launch and process events – Can be implemented with driver library wrapping • Callback method – Utilize language-level callback support in Open. CL – Utilize NVIDIA CUDA Performance Tool Interface (CUPTI) – Need to appropriately register callbacks 56

GPU Performance Measurement Tools • Support the Host-GPU performance perspective • Provide integration with existing measurement system to facilitate tool use • Utilize support in GPU driver library and device • Tools – – TAU performance system Vampir PAPI NVIDIA CUPTI 57

GPU Performance Tool Interoperability 58

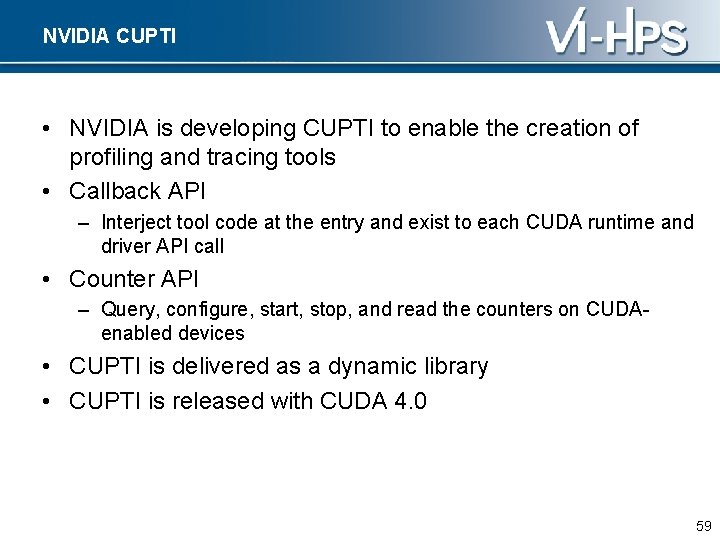
NVIDIA CUPTI • NVIDIA is developing CUPTI to enable the creation of profiling and tracing tools • Callback API – Interject tool code at the entry and exist to each CUDA runtime and driver API call • Counter API – Query, configure, start, stop, and read the counters on CUDAenabled devices • CUPTI is delivered as a dynamic library • CUPTI is released with CUDA 4. 0 59

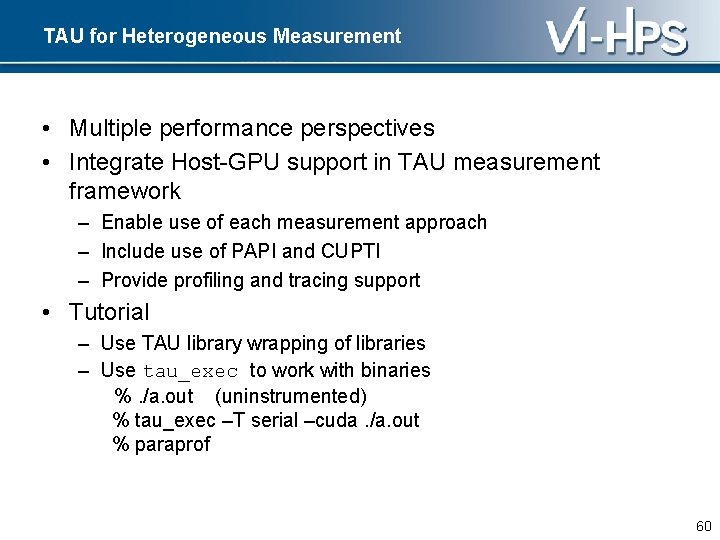
TAU for Heterogeneous Measurement • Multiple performance perspectives • Integrate Host-GPU support in TAU measurement framework – Enable use of each measurement approach – Include use of PAPI and CUPTI – Provide profiling and tracing support • Tutorial – Use TAU library wrapping of libraries – Use tau_exec to work with binaries %. /a. out (uninstrumented) % tau_exec –T serial –cuda. /a. out % paraprof 60

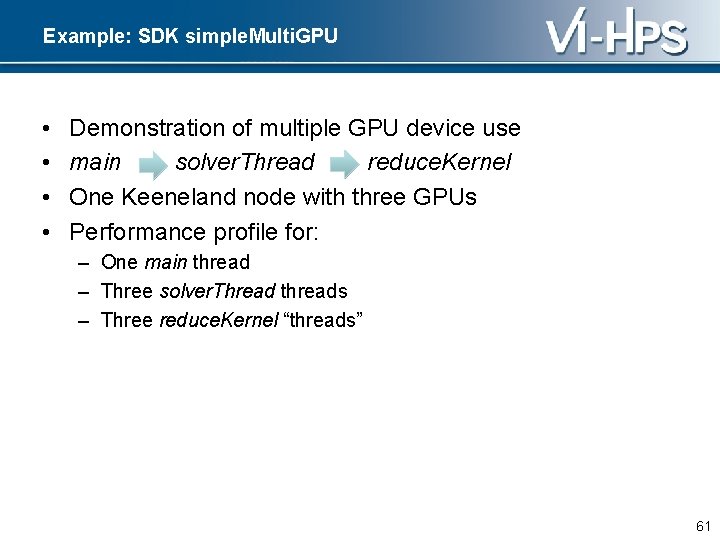
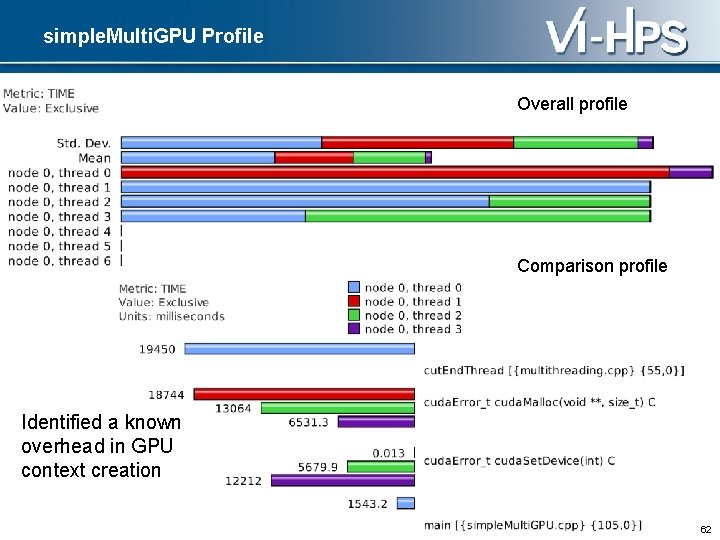
Example: SDK simple. Multi. GPU • • Demonstration of multiple GPU device use main solver. Thread reduce. Kernel One Keeneland node with three GPUs Performance profile for: – One main thread – Three solver. Thread threads – Three reduce. Kernel “threads” 61

simple. Multi. GPU Profile Overall profile Comparison profile Identified a known overhead in GPU context creation 62

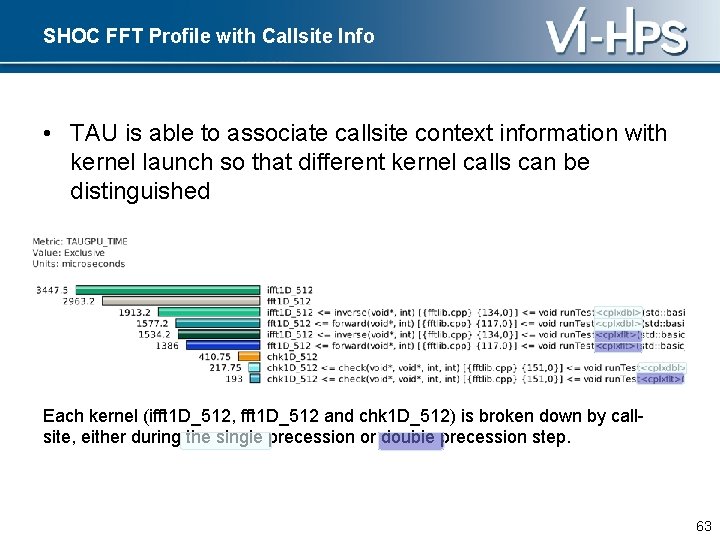
SHOC FFT Profile with Callsite Info • TAU is able to associate callsite context information with kernel launch so that different kernel calls can be distinguished Each kernel (ifft 1 D_512, fft 1 D_512 and chk 1 D_512) is broken down by callsite, either during the single precession or double precession step. 63

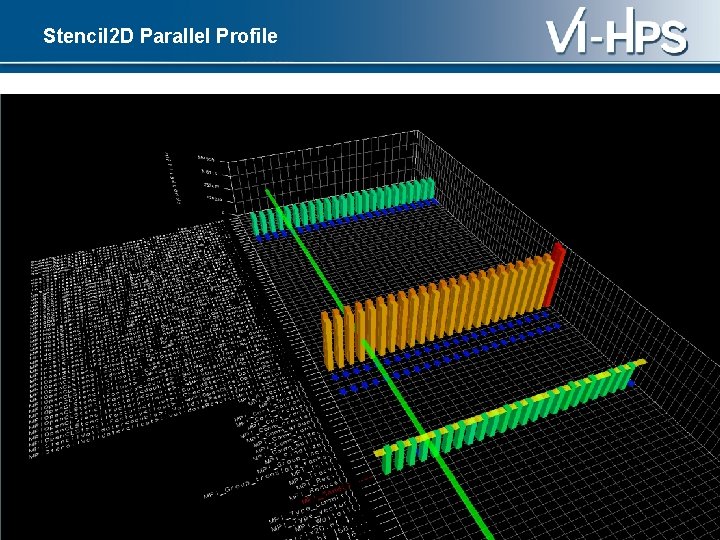
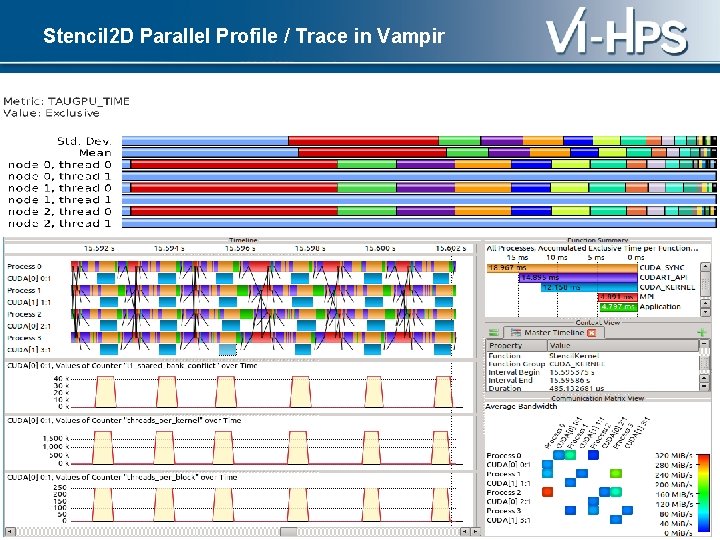
Example: SHOC Stencil 2 D • Compute 2 D, 9 -point stencil – Multiple GPUs using MPI – CUDA and Open. CL versions • One Keeneland node with 3 GPUs • Eight Keeneland nodes with 24 GPUs • Performance profile and trace – Application events – Communication events – Kernel execution 64

Stencil 2 D Parallel Profile 65

Stencil 2 D Parallel Profile / Trace in Vampir 66

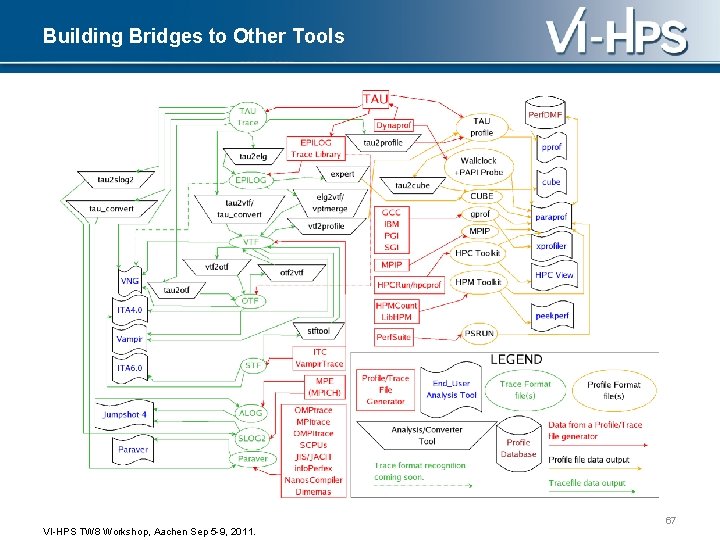
Building Bridges to Other Tools 67 VI-HPS TW 8 Workshop, Aachen Sep 5 -9, 2011.

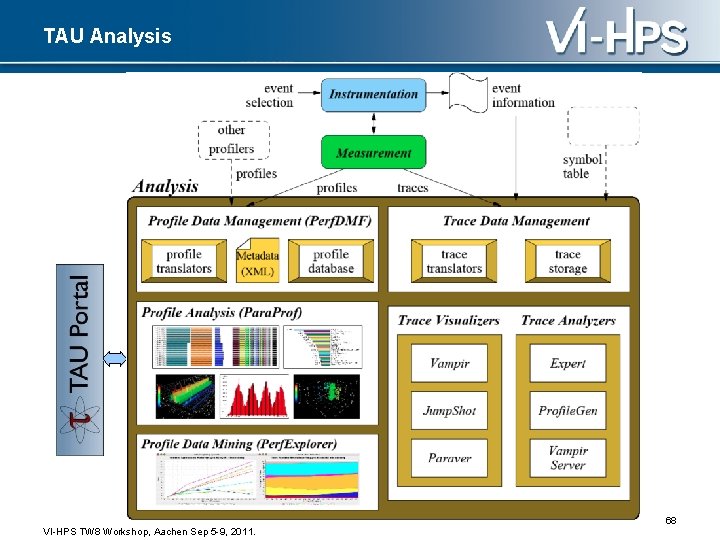
TAU Analysis 68 VI-HPS TW 8 Workshop, Aachen Sep 5 -9, 2011.

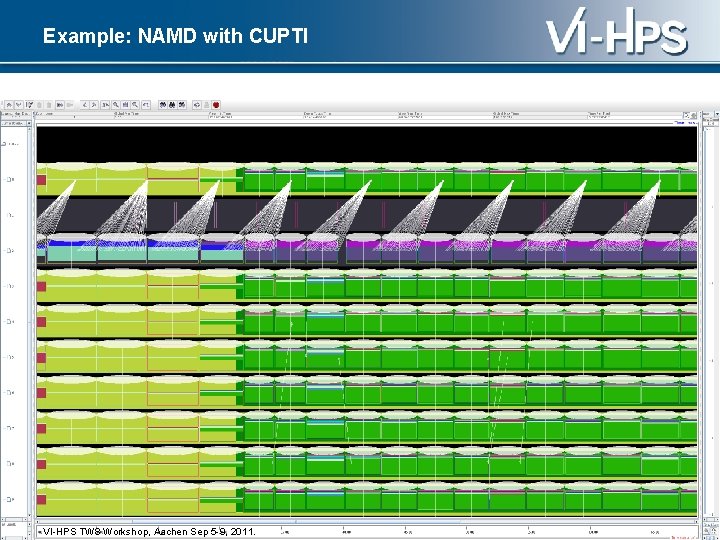
Example: NAMD with CUPTI VI-HPS TW 8 Workshop, Aachen Sep 5 -9, 2011. 69

HMPP SGEMM (CAPS Entreprise) Host Process Transfer Kernel Compute Kernel 70 VI-HPS TW 8 Workshop, Aachen Sep 5 -9, 2011.

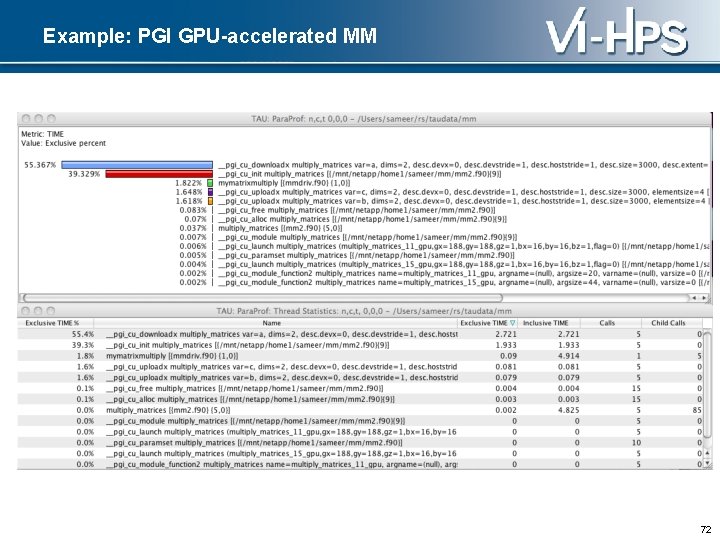
Profiling PGI Accelerator Primitives • PGI compiler allows users to annotate source code to identify loops that should be accelerated • When a program is compiled with TAU, its measurement library intercepts the PGI runtime library layer to measure time spent in the runtime library routines and data transfers • TAU also captures the arguments: – array data dimensions and sizes, strides, upload and download times, variable names, source file names, row and column information, and routines 71

Example: PGI GPU-accelerated MM 72

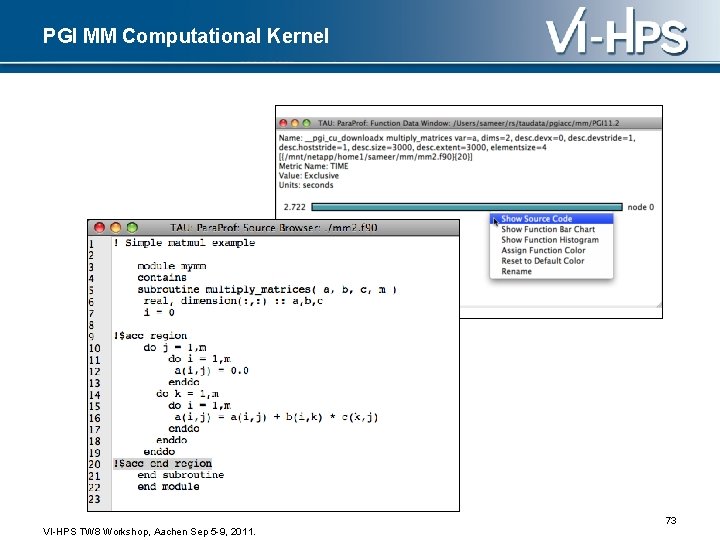
PGI MM Computational Kernel 73 VI-HPS TW 8 Workshop, Aachen Sep 5 -9, 2011.

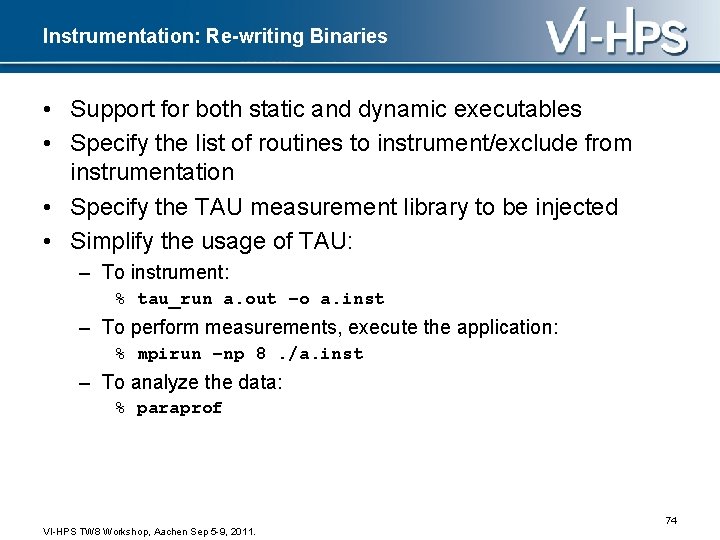
Instrumentation: Re-writing Binaries • Support for both static and dynamic executables • Specify the list of routines to instrument/exclude from instrumentation • Specify the TAU measurement library to be injected • Simplify the usage of TAU: – To instrument: % tau_run a. out –o a. inst – To perform measurements, execute the application: % mpirun –np 8. /a. inst – To analyze the data: % paraprof 74 VI-HPS TW 8 Workshop, Aachen Sep 5 -9, 2011.

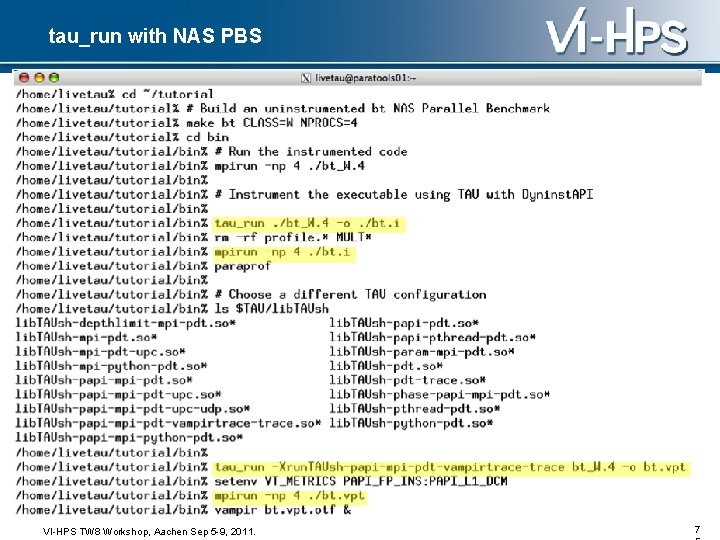
tau_run with NAS PBS VI-HPS TW 8 Workshop, Aachen Sep 5 -9, 2011. 7

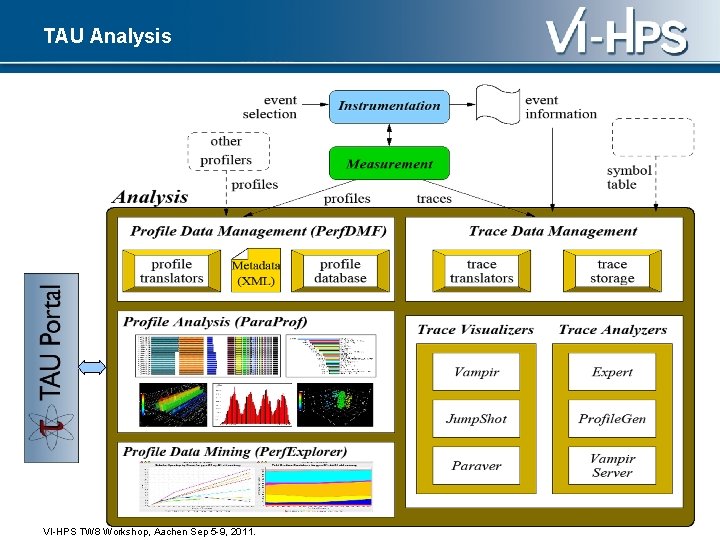
TAU Analysis 76 VI-HPS TW 8 Workshop, Aachen Sep 5 -9, 2011.

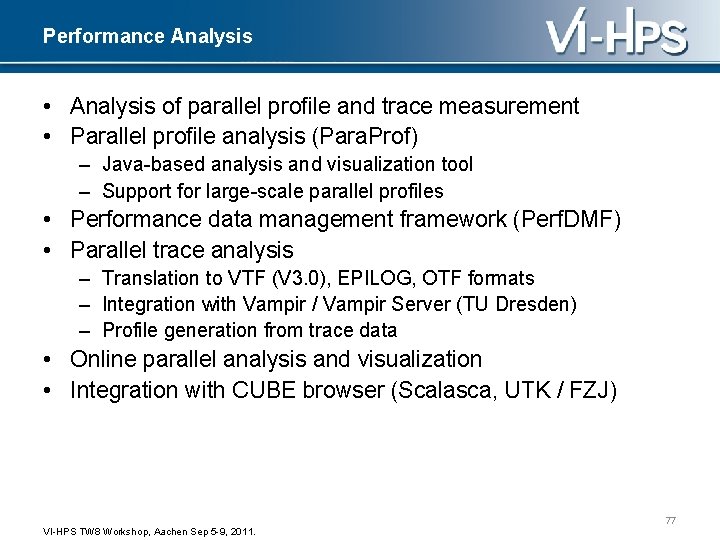
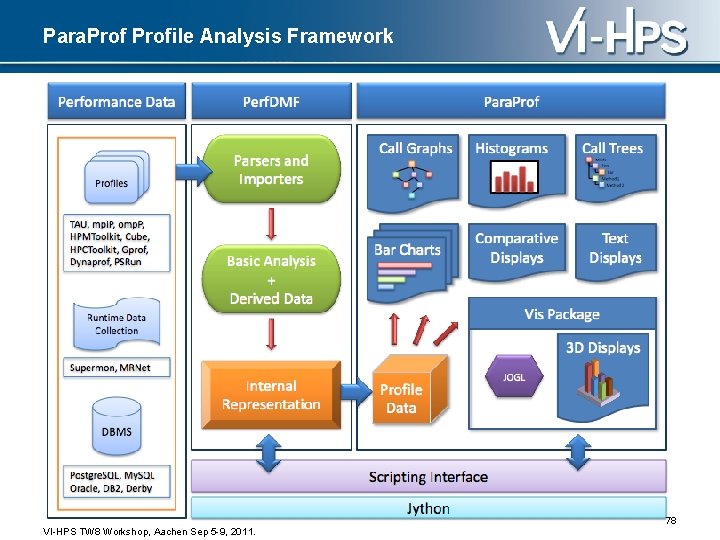
Performance Analysis • Analysis of parallel profile and trace measurement • Parallel profile analysis (Para. Prof) – Java-based analysis and visualization tool – Support for large-scale parallel profiles • Performance data management framework (Perf. DMF) • Parallel trace analysis – Translation to VTF (V 3. 0), EPILOG, OTF formats – Integration with Vampir / Vampir Server (TU Dresden) – Profile generation from trace data • Online parallel analysis and visualization • Integration with CUBE browser (Scalasca, UTK / FZJ) 77 VI-HPS TW 8 Workshop, Aachen Sep 5 -9, 2011.

Para. Profile Analysis Framework 78 VI-HPS TW 8 Workshop, Aachen Sep 5 -9, 2011.

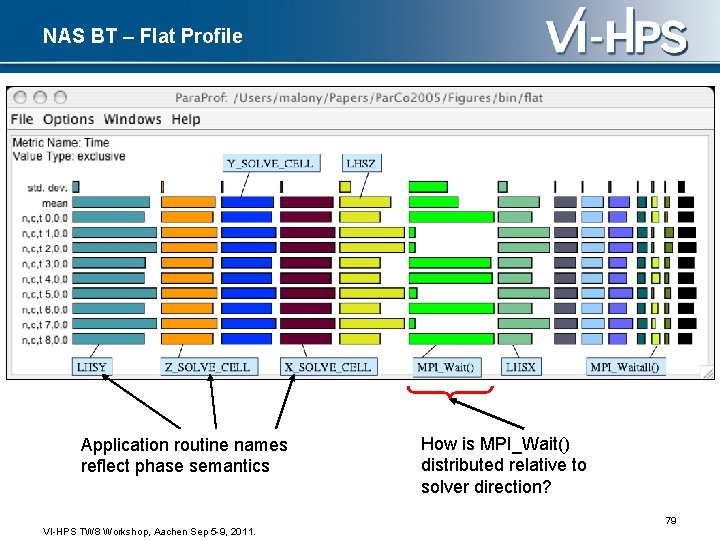
NAS BT – Flat Profile Application routine names reflect phase semantics How is MPI_Wait() distributed relative to solver direction? 79 VI-HPS TW 8 Workshop, Aachen Sep 5 -9, 2011.

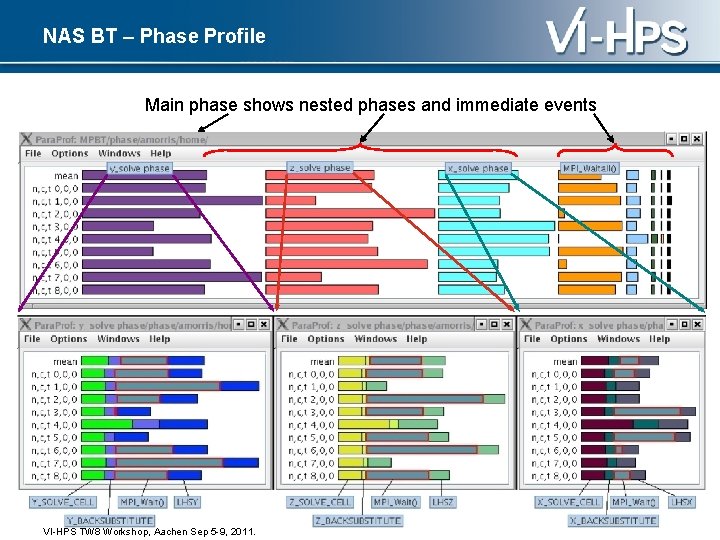
NAS BT – Phase Profile Main phase shows nested phases and immediate events 80 VI-HPS TW 8 Workshop, Aachen Sep 5 -9, 2011.

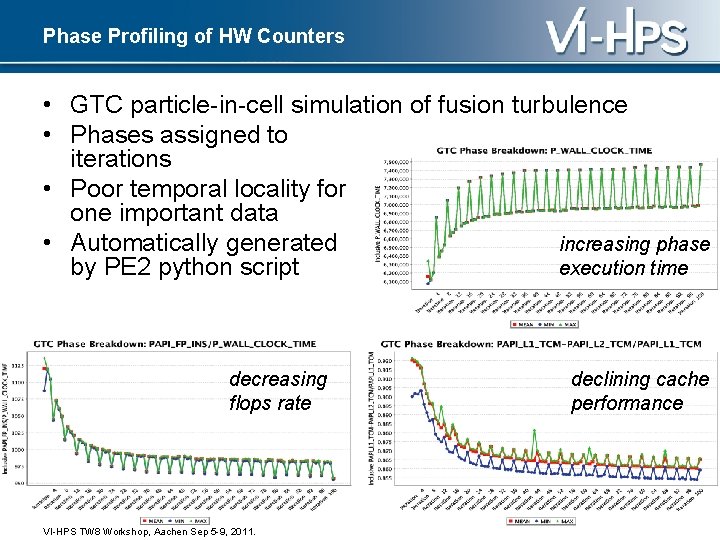
Phase Profiling of HW Counters • GTC particle-in-cell simulation of fusion turbulence • Phases assigned to iterations • Poor temporal locality for one important data increasing phase • Automatically generated execution time by PE 2 python script decreasing flops rate declining cache performance 81 VI-HPS TW 8 Workshop, Aachen Sep 5 -9, 2011.

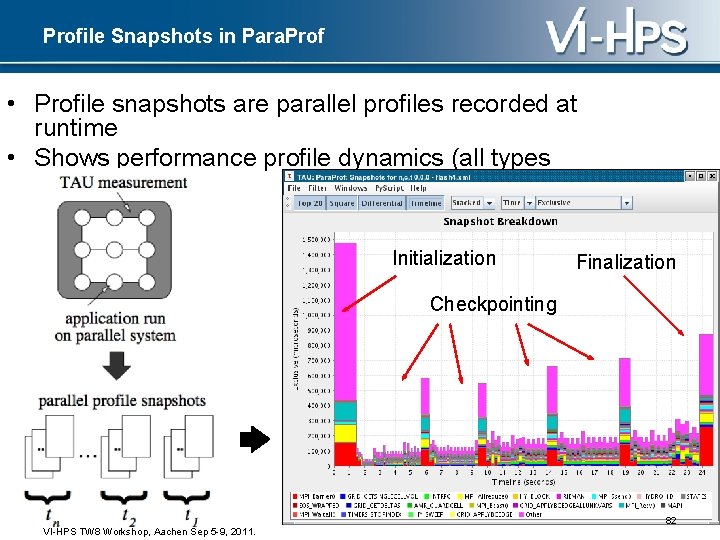
Profile Snapshots in Para. Prof • Profile snapshots are parallel profiles recorded at runtime • Shows performance profile dynamics (all types allowed) Initialization Finalization Checkpointing 82 VI-HPS TW 8 Workshop, Aachen Sep 5 -9, 2011.

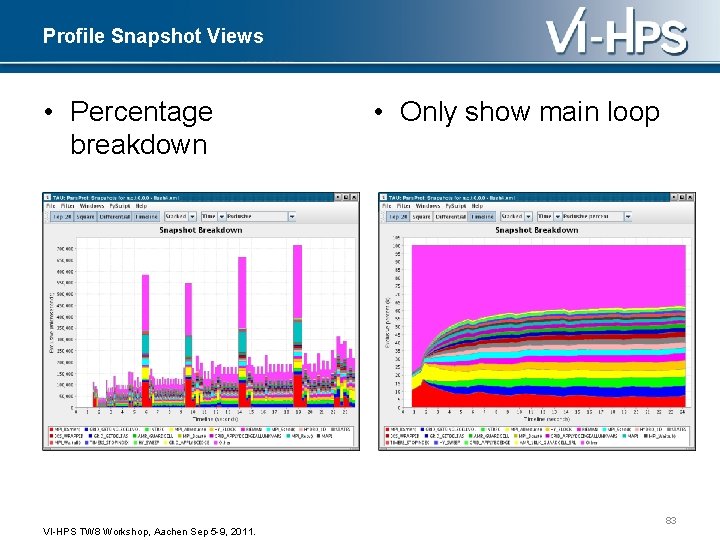
Profile Snapshot Views • Percentage breakdown • Only show main loop 83 VI-HPS TW 8 Workshop, Aachen Sep 5 -9, 2011.

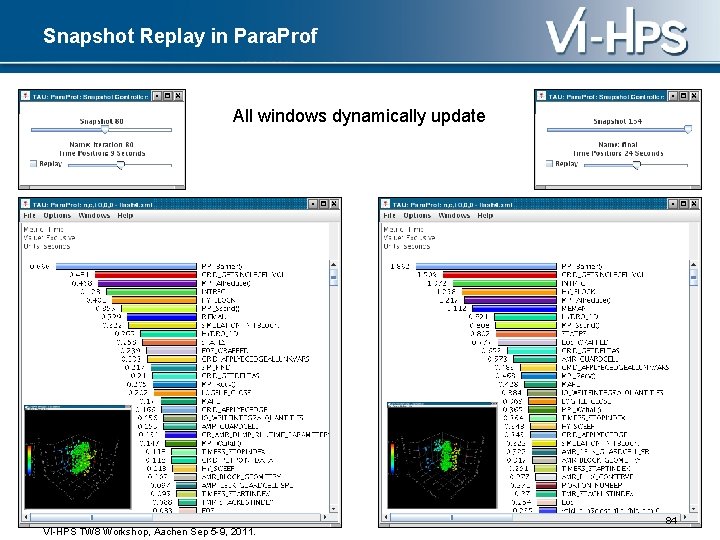
Snapshot Replay in Para. Prof All windows dynamically update 84 VI-HPS TW 8 Workshop, Aachen Sep 5 -9, 2011.

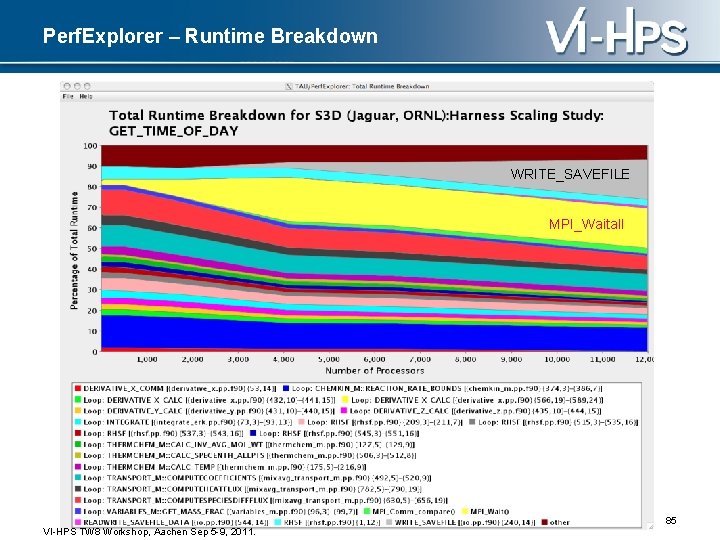
Perf. Explorer – Runtime Breakdown WRITE_SAVEFILE MPI_Waitall 85 VI-HPS TW 8 Workshop, Aachen Sep 5 -9, 2011.

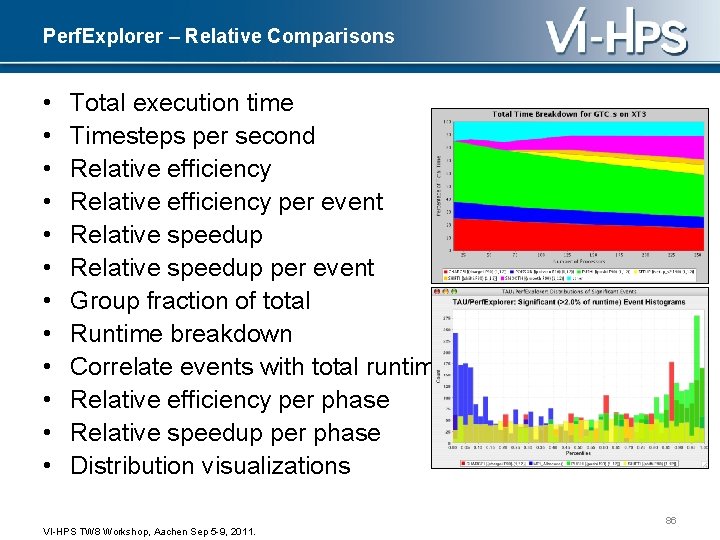
Perf. Explorer – Relative Comparisons • • • Total execution time Timesteps per second Relative efficiency per event Relative speedup per event Group fraction of total Runtime breakdown Correlate events with total runtime Relative efficiency per phase Relative speedup per phase Distribution visualizations 86 VI-HPS TW 8 Workshop, Aachen Sep 5 -9, 2011.

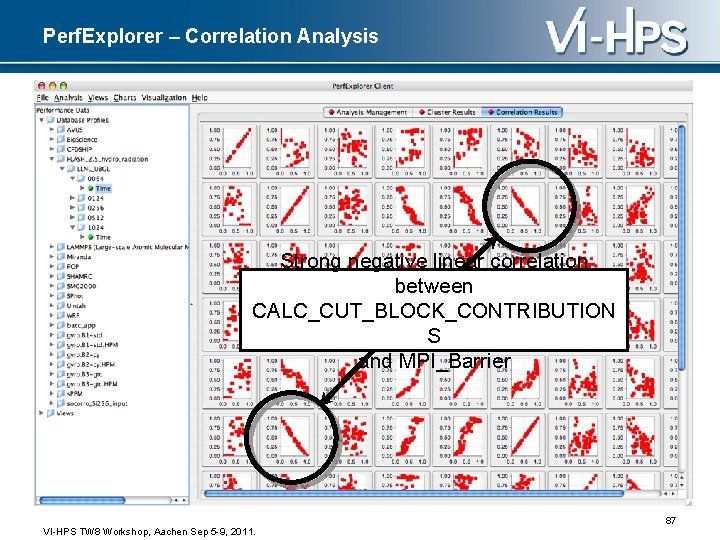
Perf. Explorer – Correlation Analysis Strong negative linear correlation between CALC_CUT_BLOCK_CONTRIBUTION S and MPI_Barrier Data: FLASH on BGL(LLNL), 64 nodes 87 VI-HPS TW 8 Workshop, Aachen Sep 5 -9, 2011.

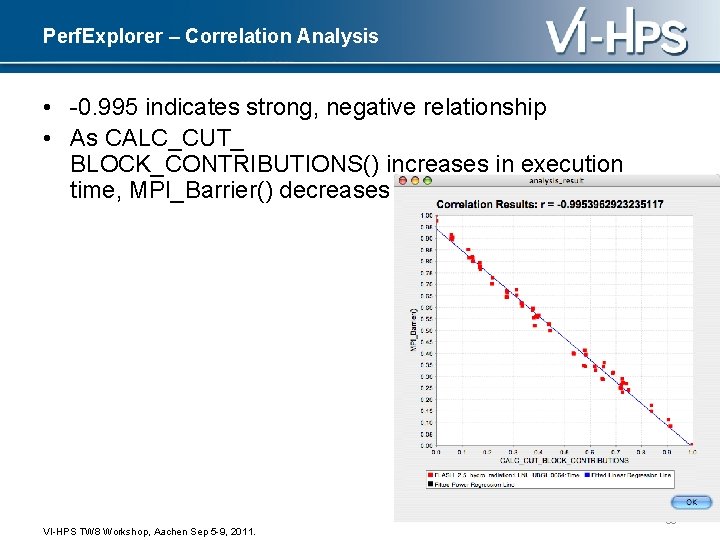
Perf. Explorer – Correlation Analysis • -0. 995 indicates strong, negative relationship • As CALC_CUT_ BLOCK_CONTRIBUTIONS() increases in execution time, MPI_Barrier() decreases 88 VI-HPS TW 8 Workshop, Aachen Sep 5 -9, 2011.

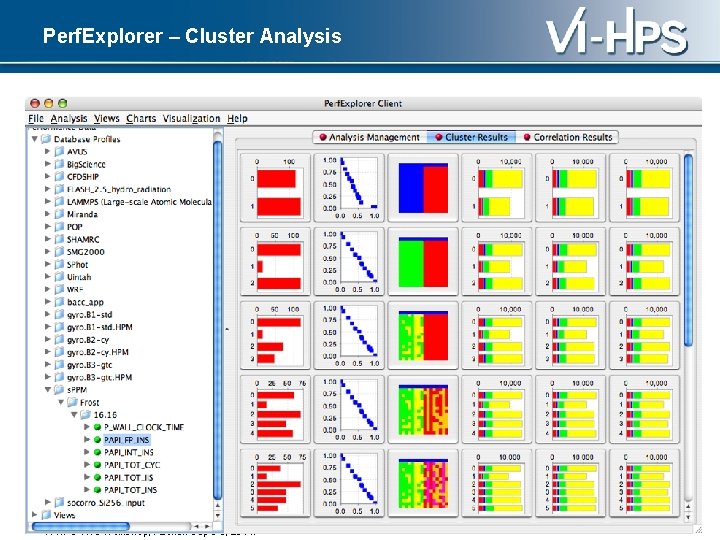
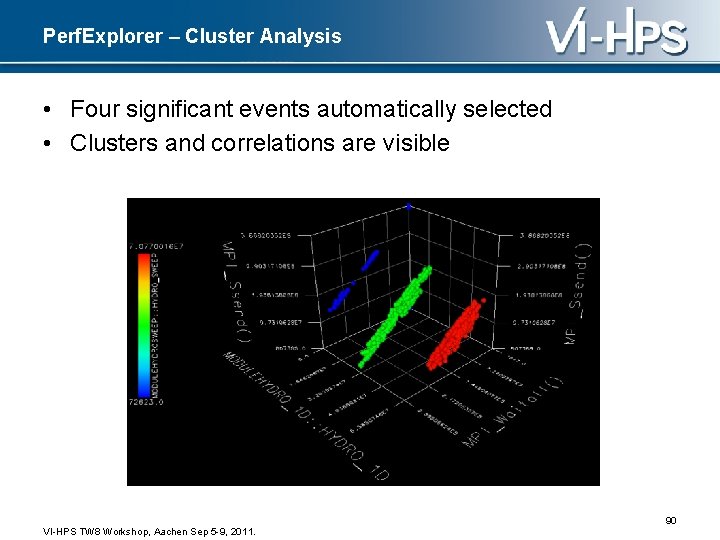
Perf. Explorer – Cluster Analysis 89 VI-HPS TW 8 Workshop, Aachen Sep 5 -9, 2011.

Perf. Explorer – Cluster Analysis • Four significant events automatically selected • Clusters and correlations are visible 90 VI-HPS TW 8 Workshop, Aachen Sep 5 -9, 2011.

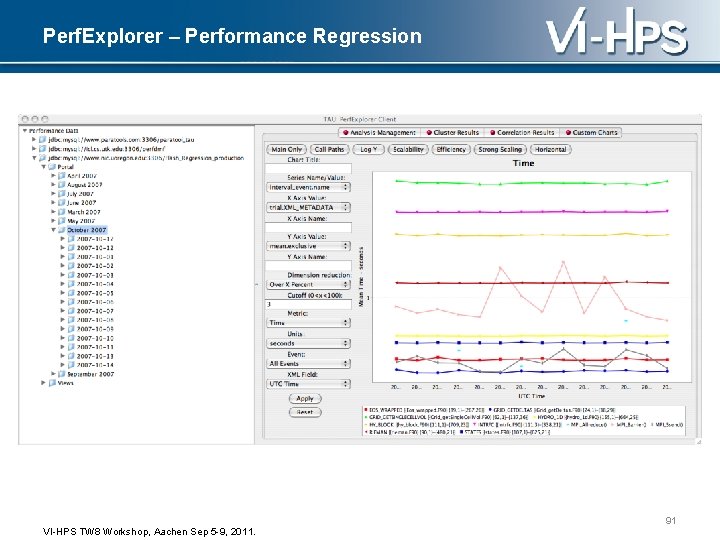
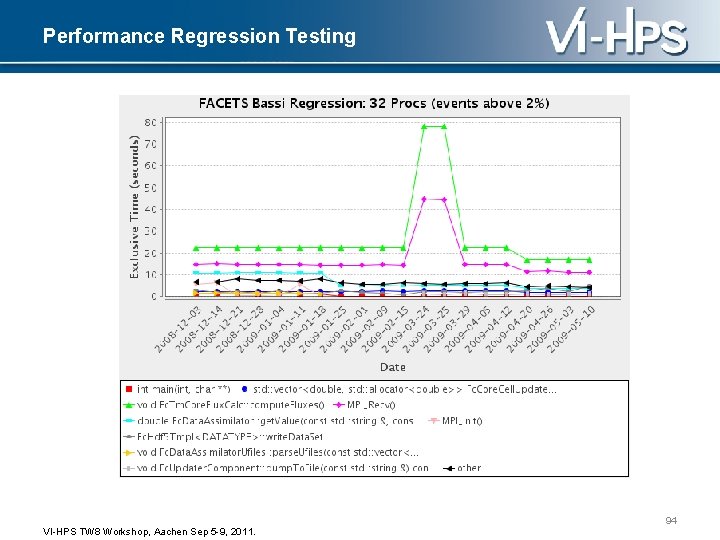
Perf. Explorer – Performance Regression 91 VI-HPS TW 8 Workshop, Aachen Sep 5 -9, 2011.

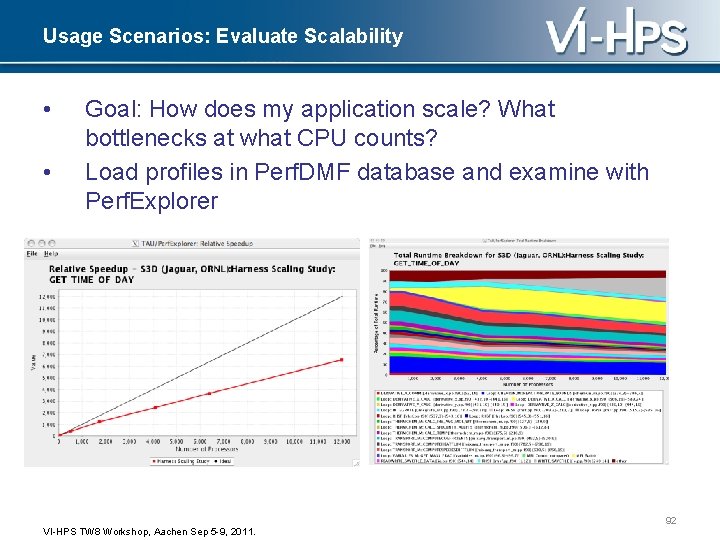
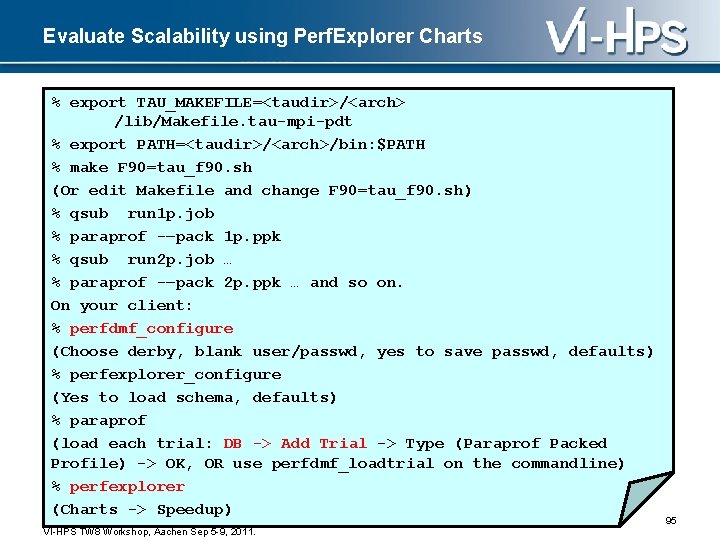
Usage Scenarios: Evaluate Scalability • • Goal: How does my application scale? What bottlenecks at what CPU counts? Load profiles in Perf. DMF database and examine with Perf. Explorer 92 VI-HPS TW 8 Workshop, Aachen Sep 5 -9, 2011.

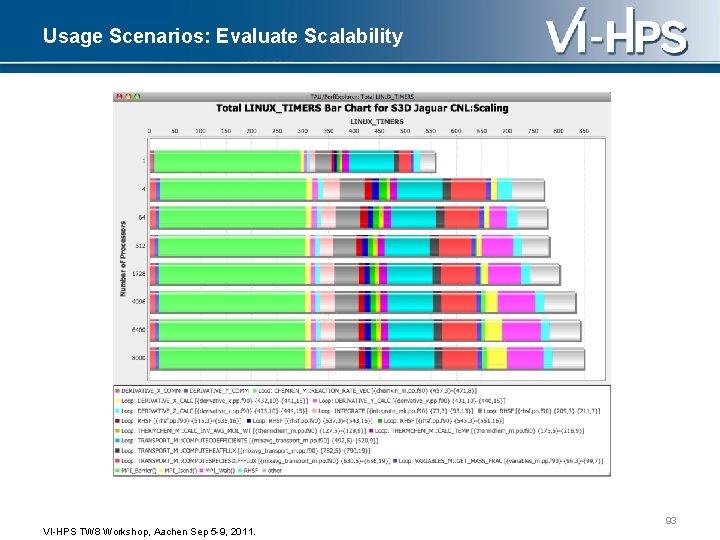
Usage Scenarios: Evaluate Scalability 93 VI-HPS TW 8 Workshop, Aachen Sep 5 -9, 2011.

Performance Regression Testing 94 VI-HPS TW 8 Workshop, Aachen Sep 5 -9, 2011.

Evaluate Scalability using Perf. Explorer Charts % export TAU_MAKEFILE=<taudir>/<arch> /lib/Makefile. tau-mpi-pdt % export PATH=<taudir>/<arch>/bin: $PATH % make F 90=tau_f 90. sh (Or edit Makefile and change F 90=tau_f 90. sh) % qsub run 1 p. job % paraprof -–pack 1 p. ppk % qsub run 2 p. job … % paraprof -–pack 2 p. ppk … and so on. On your client: % perfdmf_configure (Choose derby, blank user/passwd, yes to save passwd, defaults) % perfexplorer_configure (Yes to load schema, defaults) % paraprof (load each trial: DB -> Add Trial -> Type (Paraprof Packed Profile) -> OK, OR use perfdmf_loadtrial on the commandline) % perfexplorer (Charts -> Speedup) VI-HPS TW 8 Workshop, Aachen Sep 5 -9, 2011. 95

Other Projects in TAU • TAU Portal – Support collaborative performance study • Kernel-level system measurements (KTAU) – Application to OS noise analysis and I/O system analysis • TAU performance monitoring – TAUover. Supermon and TAUover. MRNet • Perf. Explorer integration and expert-based analysis – Open. UH compiler optimizations – Computational quality of service in CCA • Eclipse CDT and PTP integration • Performance tools integration (NSF POINT project) 96 VI-HPS TW 8 Workshop, Aachen Sep 5 -9, 2011.

Support Acknowledgements • US Department of Energy (DOE) • – Office of Science contracts – Sci. DAC, LBL contracts – LLNL-LANL-SNL ASC/NNSA contract – Battelle, PNNL contract – ANL, ORNL contract Department of Defense (Do. D) – PETTT, HPTi • National Science Foundation (NSF) – SDCI, SI-2 • • • University of Oregon Para. Tools, Inc. University of Tennessee, Knoxville – Dr. Shirley Moore T. U. Dresden, GWT – Dr. Wolfgang Nagel and Dr. Andreas Knupfer Research Centre Juelich – Dr. Bernd Mohr, Dr. Felix Wolf Dr. Markus Geimer, Dr. Brian Wylie 97

For more information • TAU Website: http: //tau. uoregon. edu – Software – Release notes – Documentation 98 VI-HPS TW 8 Workshop, Aachen Sep 5 -9, 2011.