QUALITY CONTROL UNIT III Meaning of quality Excellence


 that are used to define the nature")


")


 When a record is made of an actual measured quality")
 When the record shows only the no. of articles conforming")


 or")

 or (USL – LSL)")

 or (USL – LSL)")


 The day’s production or other lot of any")


 Control limits on C chart based on")
 Area of application: 1. Number of surface")


 curve Ø Ø Ø Measures the performance of a sampling")

 curve - In practice the shape of OC curve is")
 curve Ø Ø If a stream of lots is produced")
 curve")
 Rejectable Quality Level (RQL)")
 and the acceptance number (c) Effect of sample")
 and the acceptance number (c) Effect of Acceptance")

 Ø Ø Screening and Rectifying Inspection AOQ is the average")
 n = items in the sample having no non conforming")
")
 Average number of items inspected per lot. For a single")
")
 The average number of items inspected for a series of")
")


- Slides: 105
QUALITY CONTROL UNIT III
Meaning of quality ü Excellence of a product or service Fitness for use - Juran (1974) ü conformance to requirements or specifications – Crosby (1979) ü ü Grade Degree of preference “The quality of a product or service is the fitness of that product or service for meeting or exceeding its intended use as required by the customer”.
Quality Characteristic A physical or chemical property/element(s) that are used to define the nature of the product or service (which contributes to fitness for use) is a quality characteristic. Can be classified as: Technological/Structural – length, Weight, Strength, dia. , frequency, etc. Psychological (Sensory) – taste, odour, beauty etc. Time-oriented – Reliability, maintainability, Warranty etc. Ethical – Honesty, Integrity etc.
Quality characteristic may be 1. Directly measurable - 2. Non-measurable - weight, shear strength, Sp. Gravity, length, dia. Etc. rejections due to flaws, cracks, breakages etc.
Quality characteristic Fall in to two broad classes – Variables - Measurable, Expressed on a numerical scale and Attributes - if classified as either conforming or nonconforming to a stipulated specification
Nonconformity and Nonconforming Unit • A nonconformity is a quality characteristic that does not meet its stipulated specification. • Example • A nonconforming unit has one or more nonconformities such that the unit is unable to meet the intended standards and is unable to function as required. • Example
Defect and Defective Nonconformity - Defect and Nonconforming Unit - Defective
Quality of Product/Service Quality of Design Quality of Conformance Quality of performance
Quality of Design “ The product or service must be designed to meet at least minimally the needs of the consumer”. Design should be simplest and least expensive while still meeting the customer’s expectations. Yield strength (customer requirement) = 100 kg/cm 2 “Tightness of the specifications for manufacture of the product” Tolerance : ± 0. 001 mm and ± 0. 01 mm
Quality of Design Factors controlling Quality of Design 1. 2. 3. 4. Type of customers in the market Profit policy of the firm Environmental conditions Special requirements of the product
Cost or Value Vs. Designed quality level (Quality of Design)
Quality of Conformance “ The manufactured product or the service rendered must meet the standards selected in the design phase”. Defect prevention, finding, analysis and rectification Factors controlling Quality of conformance 1. Adequate quality of incoming raw material 2. Adequate machines tools and measuring instruments 3. Proper selection of process 4. Trained operators 5. Proper storage and shipment 6. Feedback from internal inspection and customers 7. Use of S. Q. C. techniques
Quality of performance “ How well the manufactured product functions or service performs when put to use”. Measures the degree to which the product or service satisfies the customer. Function of Quality of design Quality of conformance
Quality of service Service Industries Retailing Distribution Financial services – banking, insurance Hotels and tourism Leisure, recreation, entertainment Professional and business services like accountancy, marketing, law, consulting Healthcare Software etc.
Continue… 1. Service is intangible - it cannot be easily measured, tested and verified in advance of sales to assure quality 2. Services are perishable 3. Precise standards like manufacturing can rarely be set 4. It is created and consumed simultaneously or near simultaneously 5. Service Production and Consumption are often inseparable i. e. Customer is in service factory.
Continue… 6. Services offered can vary from “Producer to Producer” e. g. outlet to outlet 7. Outcome of Service is as important as process of delivery. assessment of quality is made during the service delivery process. 8. Service Quality is more difficult for customer, to evaluate, than product quality 9. Customer cannot retain the actual service. The effect of the service can be retained.
Cost of Quality The cost of carrying out the company’s quality functions (meeting the quality needs of the customers) are known as costs of quality. Four categories: As per ASQC Cost of Prevention Cost of Appraisal Cost of Internal failures Cost of external failures
Cost of Prevention ü ü ü 1. 2. 3. 4. 5. 6. 7. Costs incurred in planning, implementing and maintaining a quality system. Includes Salaries. Incurred to keep failure and appraisal costs to a minimum. Cost of quality planning – market research, product development, inspection plan Cost of documenting Process control cost Cost of training Costs associated with preventing recurring defects Cost of investigation, analysis and correction of causes of defects by QC and Engg. Deptt. Cost of cost consciousness programmes
Cost of Appraisal ü 1. 2. 3. 4. Costs associated with the measuring, evaluating or auditing products, components and purchased materials to assure conformance with specified standards. Cost of verification- incoming , in-process, after production Cost of quality audits (appraisal of the quality system) Cost of inspection equipments, maintenance, Calibration Cost of vendor rating
Cost of internal Failures ü 1. 2. 3. 4. 5. 6. 7. Costs associated with defective products, components and materials that fail to meet quality requirements and result in manufacturing losses. Scrap Rework or rectification Re-inspection Downgrading Waste Failure analysis Lost production time
Cost of external failures ü ü 1. 2. 3. 4. Costs which are generated because of defective products being shipped to customers. When product does not perform satisfactory after ownership is transferred Repair and servicing Customer Complaints Returns Loss of goodwill
Economics of quality of conformance
Value of quality “ Return direct or indirect gained by the manufacturer due to mission of quality control”. It is composed of 1. Value inherent in the design 2. Value inherent in the conformance to that design
Continue… Difficult to assess the value of quality. Factor for assessment: 1. 2. 3. 4. Saving due to increased production Reduction in scrap and rework cost Increased sales of good quality product Indirect factors such as a. Reputation of manufacturer and goodwill of the customer b. Psychological stability in the enterprise
Guru’s of TQM Walter. A. Shewhart - TQC & PDSA W. Edwards Deming - 14 Points & PDCA Joseph. M. Juran - Juran’s Trilogy A. Feiganbaum - Customer requirement, CWQC, Employee Involvement, TQC.
Guru’s of TQM Kaoru Ishikawa - Philips. B. Crosby - Four Absolutes-Quality-Req, Prevention of NC, Zero Defects & Measure of NC Taguchi. G. Loss Function - Disciple of Juran & Feigenbaum. TQC in Japan, SPC, Cause & Effect Diagram
W. Edwards Deming • Focus on bringing about improvements in product and service quality by reducing uncertainty and variability in goods and services design and associated processes (the beginning of his ideas in 1920 s and 1930 s). • Higher quality leads to higher productivity and lower costs. • “ 14 Points” management philosophy. • Deming Cycle – Plan, Do, Study, and Act.
Deming’s 14 points for management • Point 1: Create and publish Vision and Demonstrate Commitment • Point 2: Learn the new Philosophy • Point 3: Understand purpose of Inspection • Point 4: Stop Making Decisions Purely on the Basis of Cost • Point 5: Improve Constantly and Forever the system • Point 6: Institute Training • Point 7: Teach and Institute Leadership
Deming’s 14 points for management • • Point 8: Drive Out Fear. Create trust. Create a climate for innovation Point 9: Optimize the Efforts of Teams , Groups and staff areas Point 10: Eliminate Exhortations for the workforce Point 11: a) Eliminate Numerical Quotas for the work force b) Eliminate management by objectives • Point 12: Remove Barriers to Pride in Work • Point 13: Encourage Education and Self-Improvement • Point 14: Take Action to accomplish the transformation.
The Deming Cycle • Plan: Recognize the opportunity for improvement • Do: Test theory on a small scale • Check: Analyze results of the test phase • Act: Implement the plan to improve customer satisfaction
Joseph Juran • Wrote Quality Control Handbook in 1951, a comprehensive quality manual. • Defined quality as “fitness for use. ” • Advocated use of quality cost measurement. • Quality Trilogy: quality planning, quality control, and quality improvement
Philip B. Crosby • • Wrote Quality is Free in 1979, which brought quality to the attention of top corporate managers in the U. S. Crosby’s Absolutes of Quality Management include: Ø Quality means conformance to requirements, not elegance. Ø Quality comes from prevention. Ø The only performance standard is Zero Defects (ZD). Ø The only performance measurement is the expense of nonconformance.
Inspection and Quality Control Inspection: Checking of material, product or components of product at various stages, with reference to certain pre-determined factors and detecting and sorting out the faulty or defective items. Quality Control: Effective system for integrating quality development, quality maintenance and quality improvement efforts of various groups in an organization to enable the production to be carried out at most economical level
Difference between inspection amd QC S. N. Parameters Inspection Quality control 1 Scope Part of QC 2 Definition Checking of material, product or components of product at various stages, with reference to certain pre-determined factors and detecting and sorting out the faulty or defective items. Broad term, Inspection at particular stage Effective system for integrating quality development, quality maintenance and quality improvement efforts of various groups in an organization to enable the production to be carried out at most economical level 3 Devices used Precision measuring instruments Statistics, control charts, acceptance such as vernier calipers, sampling, process capability study, V. micrometers, profile projectors R. , quality audits etc. 4 Applicability Concerned with quality of past Concerned with quality of future production 5 Concern Mainly the responsibility of Everybody working in inspectors organization is responsible the
Quality Control A system that is used to maintain a desired level of quality in a product or service Can be achieved through 1. Planning 2. Design 3. Use of proper equipment and procedures 4. Inspection and taking corrective actions in case deviation is observed
Quality Control ◦ Offline quality control ◦ Statistical process control ◦ Acceptance sampling plans
Process Control: Process by means of which we observe the actual performance and compare it with some standard. If there is a deviation between the observed performance and the standard performance then it is necessary to take corrective action. Quality control: The process through which we measure the actual quality performance, compare it with the standards and take corrective action if there is a deviation.
Statistical Quality control When statistical techniques are employed to control, improve and maintain quality or to solve quality problems, it is called S. Q. C. Statistics: is the collection, organization, analysis, interpretation and presentation of the data. It is based on law of large numbers and mathematical theory of probability.
Basic Statistical concept The concept of variation: No two items will be perfectly identical even if extreme care is taken to make them identical in some respect. Types of variation: 1. 2. 3. Within the part itself Among the parts produced during the same period of time Among parts produced at different periods of time
Reasons for variation Tool wear ü Machine vibrations ü Loose bearings ü Play between nut and screw of the machine table ü Faulty jigs/fixtures ü Poor quality of raw material ü Carelessness of operators ü Fatigue to the operator ü Change in working condition ü Poor maintenance ü Measuring errors ü
Reasons for variation Causes of variation can be subdivided in to two groups – 1. Assignable or special causes 2. Chance or random or common causes
Statistical Process Control using control charts Control charts: Graphical tool for monitoring the activity of an ongoing process Shewhart control charts Proposed by Walter A. Shewhart Control chart description
Universe or Population Sample
Variable Data (continuous data) When a record is made of an actual measured quality characteristics, the quality is said to be expressed in variables. Examples: Dimension in mm Hardness in rockwell unit Temp. in 0 c Tensile strength in Kg/cm 2 Weight in Kg.
Attribute Data (Discrete data) When the record shows only the no. of articles conforming and the number of articles failing to conform to any specified requirements, it is said to be recorded by attributes. This method simply notes the presence or absence of a quality characteristic in the parts examined Example: Number of defective pieces found in a sample Surface finish of furniture Cracks in sheet by spot welds (Defective – Parts which do not possess the characteristics of conformity)
Control Charts For Variable Normal Curve
Control Charts For Variable Variations 1. Variations due to Assignable causes - Greater magnitude - because of difference among M/cs, workers, material etc. 2. Variations due to chance causes - Random - example – little play between nut and screw of table
Control Charts For Variable If many random samples of any given size are taken from universe, the averages of the samples will themselves form a F. D. having its own central tendency and dispersion or spread. If the universe is normal, statistical theory tells that expected F. D. of the average values will also be normal. In long run 1. Average of samples = Average of the universe 2. S. D. of the expected F. D. of the average = S. D. Of the universe / √ sample size
Control chart : Procedure Making and recording measurement Calculate the average characteristic value and Range for each subgroup Calculate the grand average range Calculation of control limits on control chart for X-chart Calculation of control limits on R-chart Plot the X and R chart Draw conclusions from control chart
Some control chart patterns Chance pattern
Some control chart patterns Chance pattern characteristics 1. Most of the points will lie near the central line 2. Very few points will be near the control limits 3. None of the points (except 3 in 1000) fall outside the control limits
Some control chart patterns Extreme variations
Some control chart patterns 1. 2. 3. 4. Extreme variations Causes Error in measurement and calculations. Sample chosen at peak position of pressure, temp. etc. Wrong setting of machine, tool etc. Sample chosen at the commencement or end of an operation
Some control chart patterns Trend
Some control chart patterns Causes of Trend 1. Tool wear 2. Wear of threads on clamping device 3. Effects of temperature and humidity 4. Accumulation of dirt and clogging of fixtures and holes On R chart 1. Increasing trend – gradual wearing of operating machine part 2. Decreasing trend – Improvement in operations, better maintenance, improved control on back process
Some control chart patterns Shift
Some control chart patterns 1. 2. 3. 4. 5. Causes of Shift Change in material Change in operator, inspection equipment Change in machine setting New operator carelessness of operator Loose fixture etc.
Some control chart patterns Erratic fluctuations
Some control chart patterns 1. 2. 3. Causes of Erratic fluctuations Frequent adjustment of machine Different types of material being processed Change in operator. Machine, test equipment etc.
Process capability Minimum spread of a specific measurement variation which will include 99. 7% of the measurements from the given process. Measure of a process spread (6σ) – Natural tolerance Process capability analysis consists of 1. 2. Finding whether the process is inherently capable of meeting the specified tolerance limit. Discovering why a process capable is failing to meet specification
Specifications and process capability Case I: 6σ < ( Xmax - Xmin ) or (USL – LSL)
Conclusion 1. In a, b, c practically all the products manufactured will meet specification as long as the process stays in control 2. X¯ may be permitted to go out of control or the distribution may be allowed to move between b and c. cost of frequent machine setup and cost and time of hunting causes will reduce. 3. If ( Xmax - Xmin )/6σ is considerably large, frequency of control chart may be reduced. 4. For economical advantages the specification limits may be tightened.
Case II: 6σ > ( Xmax - Xmin ) or (USL – LSL)
Conclusion Defective parts will always be there. The remedy will be 1. Increase the tolerance 2. Reduce the dispersion 3. Suffer and sort out the defectives 4. Important to maintain the centering of the process.
Case III: 6σ = ( Xmax - Xmin ) or (USL – LSL)
Conclusion 1. A little change in centering will cause defective parts. Calls for continuous use of control charts. 2. To increase tolerance if they are tighter than necessary. 3. Reduce dispersion if economical
Control Charts for Attributes Practical limitations of the control charts for Variables: 1. 2. 3. Can be used for quality characteristics that can be measured and expressed in numbers. However many quality characteristics can be observed only as attributes. Can be used only for one measurable quality characteristic at a time. For the reason of economy even in some cases , where the direct measurement of variable quality characteristics is possible, it is common practice to classify them as good or bad on the basis of inspection by GO-No-GO gauges.
P-Chart (control chart for fraction defectives) The day’s production or other lot of any manufactured article can be thought of as a sample from a larger quantity with some unknown fraction defective. This unknown universe fraction defective depends upon a complex set of causes influencing the production and inspection operations. Fraction defective in the sample may vary considerably. But as long as the universe fraction defective remains unchanged, relative frequencies of various sample fraction defectives may be expected to follow the binomial law.
Inspection results of magnets for nineteen observations Week No. 1 2 3 4 5 6 7 8 9 10 11 12 13 14 15 16 17 18 19 Total No. of magnets inspected 724 763 748 724 727 726 719 759 745 736 739 723 748 770 756 719 757 760 14091 No. of defective magnets 48 83 70 85 45 56 48 67 37 52 47 50 47 57 51 71 53 34 29 1030 Fraction defectives 0. 066 0. 109 0. 094 0. 114 0. 062 0. 077 0. 066 0. 093 0. 049 0. 07 0. 064 0. 068 0. 065 0. 076 0. 066 0. 094 0. 074 0. 045 0. 038
Calculate the average fraction defective and 3 sigma control limits, construct the control chart and state whether the process is in statistical control. The avg. sample size = 14091/19 = 741. 63 n = 742 (say) Total defectives in all samples The avg. Fraction defectives = Total inspected in all samples 1030 = 14091 = 0. 0731
Calculation of 3 sigma limits UCLp = 0. 1018 LCLp = 0. 0444
P-Chart
Conclusion From the resulting control chart Sample numbers 2 nd and 4 th go above the upper control limit and the sample number 19 th goes below the lower control limit. Therefore the process does not exhibit statistical control.
Problem : A certain product is given 100% inspection as it is manufactured and resultant data are summarized by the hour. In the following table, 16 hours of data are recorded. Calculate the 3 sigma limits, construct the control chart. Hour 1 2 3 4 5 6 7 8 9 10 11 12 13 14 15 16 Total No. of units inspected 48 36 50 47 48 54 50 42 32 40 47 47 46 46 48 39 720 No. of defective units 5 5 0 3 0 1 5 2 2 4 1 0 36 Fraction defective 0. 104 0. 139 0 0. 106 0 0. 056 0 0. 024 0. 156 0. 05 0. 043 0. 085 0. 022 0 0. 063 0
C-Chart (Control chart for Number of defects) Control limits on C chart based on Poisson distribution. Two conditions: 1. The area of opportunity for occurrence of defects should be fairly constant from period to period. 1. Opportunities for defects should be large, while the chances of a defect occurring in any one spot should be small.
C-Chart (Control chart for Number of defects) Area of application: 1. Number of surface defects in a roll of coated paper 2. Number of defective rivets in an aircraft wing 3. Number of small air holes in glass bottle 4. Number of imperfections observed in a cloth of unit area 5. Number of defects such as blow holes, cracks, undercuts etc in a casting or welded piece.
Problem : The following table gives the numbers of missing rivets noted at aircraft final inspection. Find C¯ compute trial control limits, and plot control chart for C’ would you suggest for the subsequent period? Air plane no. of missing rivets Air plane no. of missing rivets 1 8 10 12 19 11 2 16 11 23 20 9 3 14 12 16 21 10 4 19 13 9 22 22 5 11 14 25 23 7 6 15 15 15 24 28 7 8 16 9 25 9 8 11 17 9 9 21 18 14
C-Chart
Comparison between Attribute charts and variable charts Variable charts Attirbute charts 1. Example X¯, R, σ charts P, np, C, u charts 2. Data required Variable data ( Measured values of characteristics) Attribute data ( Using Go-No-Go gauges) 3. Field of applications Control of individual characteristics 4. Advantage provides detailed information on process average and variation 5. Disadvantage Not easily understood Control of proportion of defectives or number of defects Provides overall picture of quality history Do not recognize different degree of defectiveness
Acceptance sampling Process of evaluating a portion of the product/material in a lot for the purpose of accepting or rejecting the lot as either conforming or not conforming to a quality specifications. Inspection is carried out in two ways 1. 100% inspection 2. Sampling inspection
The main purpose of acceptance sampling is to distinguish between good lots and bad lots, and to classify the lots according to their acceptability and non acceptability. Advantages: 1. Items subjected to destructive testing must be inspected by sampling inspection. 2. Cost and time required is quite less. 3. Inspection fatigue is eliminated. 4. Smaller inspection staff. 5. Less damage to products as only few to be handled. 6. Problem of monotony and inspector error is minimized. 7. Exerts more effective pressure on quality improvement.
Limitations 1. Risk of making wrong decisions. 2. Sample usually provides less information about the product. 3. Extra planning and documentation is necessary.
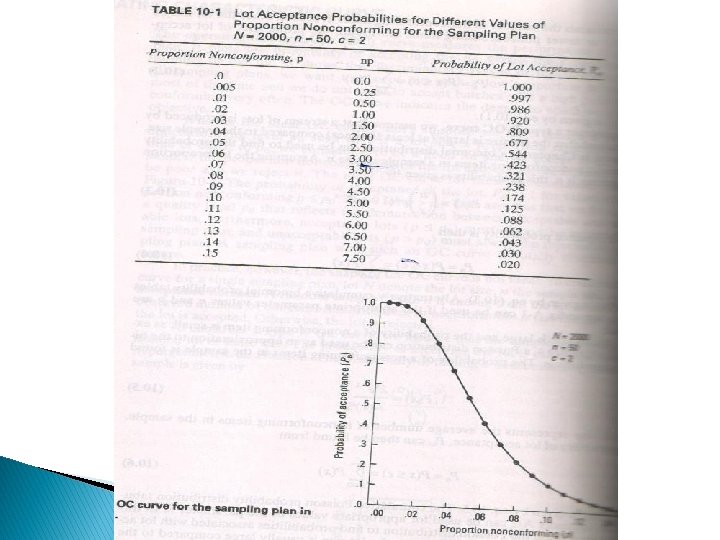
The operating characteristic (OC) curve Ø Ø Ø Measures the performance of a sampling plan Probability of acceptance of lot Vs. Proportion nonconforming of the lot Discriminatory power of sampling plan
Ideal OC curve Ø A sampling plan with such an OC curve is Totally Discriminatory
The operating characteristic (OC) curve - In practice the shape of OC curve is not ideal Let N = Lot size n = Sample Size c = Acceptance number Ø If sample is chosen from an isolated lot of finite size. The probability of acceptance (Pa) of lot is calculated based on Hypergeometric distribution.
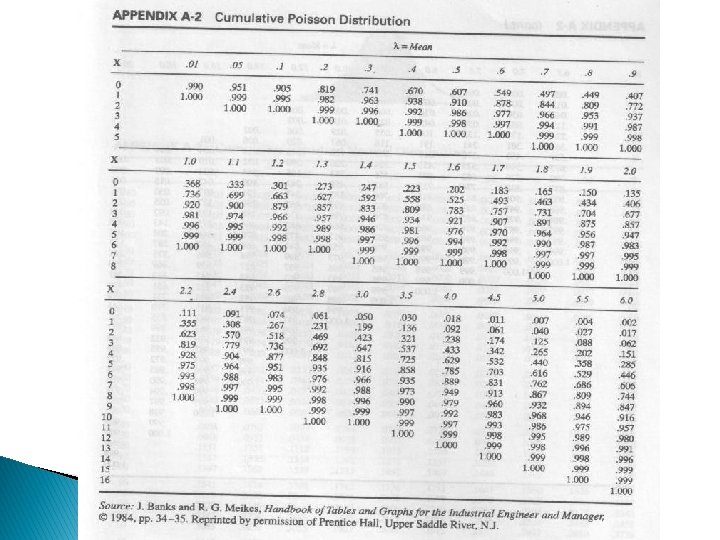
The operating characteristic (OC) curve Ø Ø If a stream of lots is produced by the process and the lot size is large (at least 10 times ) compared to the sample size. The probability of acceptance (Pa) of lot is calculated based on Binomial distribution. If the lot size is large and the probability of nonconforming item is small. The probability of acceptance (Pa) of lot is calculated based on Poisson distribution.
The operating characteristic (OC) curve
OC Curve Producer’s risk Consumer’s risk Acceptable Quality Level (AQL) Rejectable Quality Level (RQL) Indifferent Quality level (IQL)
Effect of the sample size (n) and the acceptance number (c) Effect of sample size on the shape of the OC curve
Effect of the sample size (n) and the acceptance number (c) Effect of Acceptance number on the shape of the OC curve
Evaluating Sampling Plans OC curve – measure of the performance of a sampling plan Average Outgoing Quality (AOQ) Average Total Inspection (ATI) Average Sample Number (ASN)
Average Outgoing Quality (AOQ) Ø Ø Screening and Rectifying Inspection AOQ is the average outgoing level of a series of batches that leave the inspection station, assuming rectifying inspection, after coming in for inspection at a certain quality level. Pa P (N – n) Ø AOQ = N
Average Outgoing Quality (AOQ) n = items in the sample having no non conforming items If the lot is rejected, (N-n) items will go through screening, So No non conforming items If the lot is accepted, (N-n) items in the lot will leave the inspection station with p(N-n) non conforming items The probability is Pa. So Pa p(N-n) = number of nonconforming items per lot expected to leave the inspection station. Hence the average proportion non conforming Ø AOQ = Pa P (N – n) N or
Average Outgoing Quality (AOQ)
Average Total Inspection (ATI) Average number of items inspected per lot. For a single sampling plan ATI = n + (1 – Pa) (N- n) For double sampling Plan ATI = n 1 Pa 1 + (n 1 + n 2) Pa 2 + N (1 - Pa 1 – Pa 2)
Average Total Inspection (ATI)
Average Sample Number (ASN) The average number of items inspected for a series of lots with a given incoming lot quality in order to make a decision. for a single sampling plan if inspection is not curtailed N = 800, n = 60, c =2 ASN = n = 60 For Double sampling plan ASN = n 1 P 1 + (n 1 + n 2) ( 1 - P 1) P 1 = Probability of making a decision on the first sample
Average Sample Number (ASN)
Types of sampling plan Ø Single sampling Plan Ø Double sampling plan Ø Multiple sampling plan
Types of sampling plan Ø Single sampling Plan Decision is made on the basis of N = Lot size n = Sample Size c = Acceptance number • • • Inspect a sample of n pieces If number of defectives: Does not exceed ‘c’ Exceeds ‘c’ only one sample N = 50 n=5 c=1 Accept the lot Reject the lot
Double sampling plan
Multiple sampling plan
Advantages and Disadvantages All types of Sampling plans are equivalent if they have the same Pa for batches of a given quality. 1. Simplicity – Single >Double >Multiple 2. Administrative cost – Single <Double <Multiple 3. No. of items inspected (Inspection cost) Single >Double >Multiple 4. Amount of information – Single >Double >Multiple