QUALITY ASSESSMENT What is Quality Control Quality Control


 for a laboratory test is a")


 levels are used by obstetricians")

- Slides: 18
QUALITY ASSESSMENT
What is Quality Control? Quality Control in the clinical laboratory is a system designed to increase the probability that each result reported by the laboratory is valid and can be used with confidence by the physician making a diagnostic or therapeutic decision.
Control Materials Control Values Initially use manufacturer’s insert as guidelines Clinical Laboratory Improvement Amendments (CLIA) requires that each Lab perform their own study to set limits Recommend minimum 20 measurements Over a 2 week period or 10 working days Should be processed the same way as patient samples
Investigate When results are out of control, You must resolve the problem Not just go past it without knowing the cause Especially true for systematic errors
Stop bad habits!!! Just repeating the control or just opening a new control without investigating Most often eliminates the immediate problem but not the real problem
Develop good habits Inspect the charts Random or systematic error? Identify type of error with potential cause(s) Relate possible causes to recent changes Verify the solution and document!!
Control specimen is “out of control? ” “Out of control” means that there is too much dispersion in your result compared with the rest of the results – it’s “weird” This suggests that something is wrong with the process that generated that observation Patient test results cannot be reported to physicians when there is something wrong with the testing process that is generating inaccurate reports Remember … No information is better than wrong information 7
Control specimen is “out of control? ” Things that can go wrong and what to do: ie. Corrective methods Instrumentation malfunction ( fix the machine) Reagents deteriorated, contaminated, improperly prepared or simply used up (get new reagents) Tech error (identify error and repeat the test) Control specimen is deteriorated or improperly prepared (get new control) 8
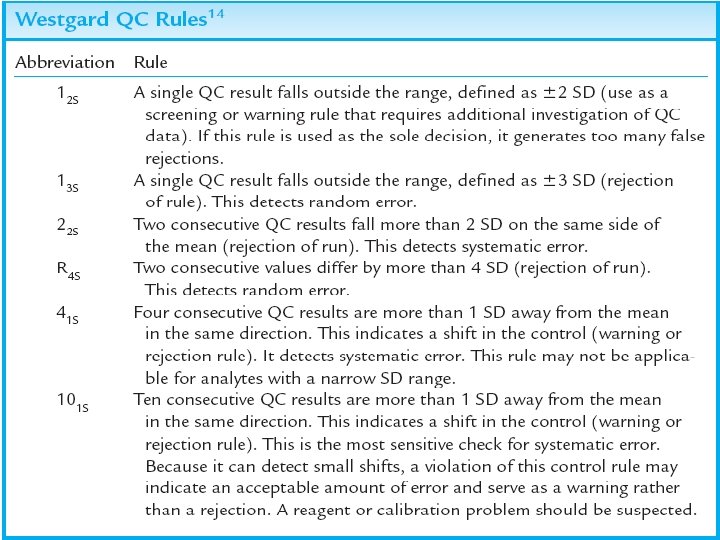
Random or systematic 13 S and R 4 S usually associated with random error 22 S, 41 S, and 10 X most often associated with systematic errors
LJ Control Charts A LJ Control Chart depend on the use of IQC specimens and is developed in the following manner: Put up the IQC specimen for at least 20 or more assay runs and record down the O. D. /cut-off value or antibody titre (whichever is applicable). Calculate the mean and standard deviations (s. d. ) Make a plot with the assay run on the x-axis, and O. D. /cut-off or antibody titre on the y axis. Draw the following lines across the y-axis: mean, -3, -2, 1, 2, and 3 s. d. Plot the O. D. /cut-off obtained for the IQC specimen for subsequent assay runs Major events such as changes in the batch no. of the kit and instruments used should be recorded on the chart.
Reference Ranges Results are most typically interpreted with respect to the range of values found in normal, clinically healthy individuals. A result is considered abnormal if the value is less than the lower limit of the normal range or is greater than the upper limit. Reference ranges are determined from measurements on specimens from a large number (several hundred) of clinically normal individuals.
Reference Ranges The reference range (or reference interval) for a laboratory test is a reference point to determine whether a disease is present or absent or if the patient is at risk for future disease states. This comparison may be used in monitoring the progression of a disease or therapeutic drug levels. Reference ranges may need to be established or confirmed when a new analyte is measured, a new or different analytical method is introduced, or there has been a significant reagent modification by the manufacturer. Laboratories are urged by manufacturers, as well as required by (Clinical Laboratory Improvement Amendments ) CLIA , to establish their own reference ranges.
Establishment of Reference Ranges Each lab must establish its own reference ranges Factors affecting reference ranges Age Sex Diet Medications Physical activity Pregnancy Personal habits ( smoking ) Geographic location ( altitude ) Body weight Laboratory instrumentation ( methodologies ) Laboratory reagents reference ranges are defined as being within 2 Standard Deviations from the mean
Establishment of Reference Ranges A minimum of 20 observations should be sampled in order to obtain valid results ( but I’ll use just 6 to save time ) Determine the normal range for fasting plasma glucose using 6 people: Sample 1 = 98 mg/dl Sample 2 = 100 mg/dl Sample 3 = 105 mg/dl Sample 4 = 106 mg/dl Sample 5 = 102 mg/dl Sample 6 = 101 mg/dl Mean SD 2 SD = 102 mg/dl = 3. 0 mg/dl = 6. 0 mg/dl That means that the normal range for this group is from 102 ± 6, or 94 – 108, which is ± 2. 0 SD from the mean
Levey-Jennings QC Practice Exercise: Cholesterol example where: Control 1 has a mean of 200 mg/d. L and standard deviation of 4. 0 mg/d. L. Control 2 has a mean of 250 mg/d. L and standard deviation of 5. 0 mg/d. L. Prepare appropriate control charts and interpret the results. Day Control 1 Value Control 2 Value 1 200 247 2 205 250 3 195 255 4 202 243 5 186 254 6 207 263 7 194 251 8 209 264 9 200 253 10 196 244 12 s Rule Violation 13 s Rule Violation Accept(A), Warning (W), or Reject(R)?
Problem 1 Calculation of Sensitivity and Specificity Alpha-fetoprotein (AFP) levels are used by obstetricians to help diagnose neural tube defects (NTD) in early pregnancy. For the following data, calculate the sensitivity & specificity of AFP for detecting NTD NUMBER OF PREGNANCIES INTERPRETATION OF AFP FINDINGS
Problem 2 For the following precision data, calculate the mean, standard deviation, and coefficient of variation for each of the two control solutions A and B. These control solutions were chosen because their concentrations were close to medical decision levels (X, ) for glucose: 120 mg/d. L for control solution A and 300 mg/dl. for control solution B. Control solution A was analyzed daily, and the following values were obtained: 118, 120, 121, 119, 125, 118, 122, 116, 124, 123, 117, 121, 120, 119, 121, 123, 120, and 122 mg/d. L Control solution B was analyzed daily and gave the following results: 295, 308, 296, 298, 304, 294, 308, 310, 296, 300, 295. 303, 305, 300, 308, 297, 305, 292, and 300 mg/d. L

 Quality control and quality assurance
 Quality management pmp
 Pmbok quality management
 Quality control basics
 Process oriented learning competencies
 Static assessment vs dynamic assessment
 Portfolio assessment matches assessment to teaching
 House model of translation quality assessment
 Quality risk assessment example
 National quality standard assessment and rating instrument
 5 principles of high quality assessment
 Principles of quality assessment
 Contoh hirarc report
 Fatality assessment and control evaluation
 Quality assurance model in nursing management
 Compliance vs quality
 Known as the fun uncle of the quality revolution
 Crosby's fourteen steps to quality improvement
 Old quality vs new quality


