
MAC Inc Living Well Center of Excellence CHRONIC
- Slides: 23
MAC Inc. Living Well Center of Excellence CHRONIC DISEASE SELF-MANAGEMENT EDUCATION PROGRAMS 1
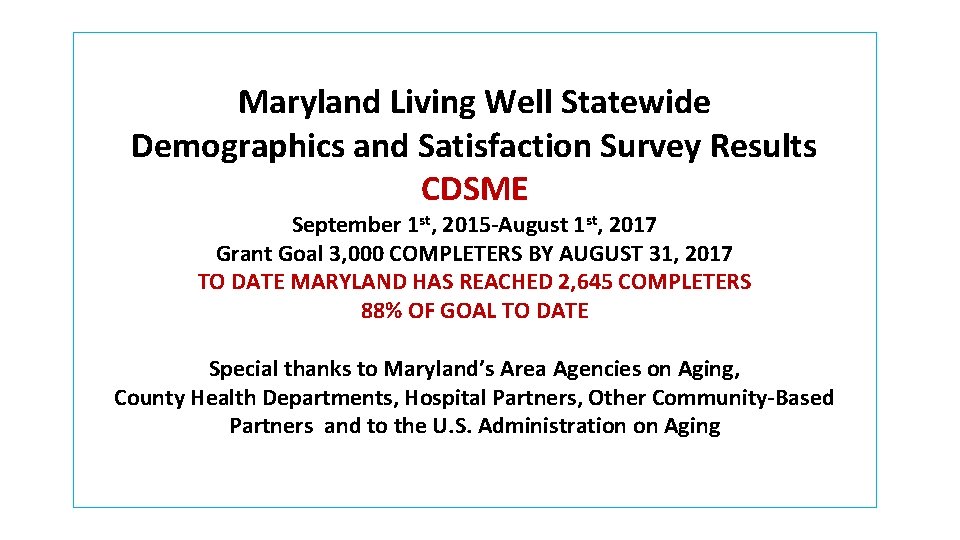
Maryland Living Well Statewide Demographics and Satisfaction Survey Results CDSME September 1 st, 2015 -August 1 st, 2017 Grant Goal 3, 000 COMPLETERS BY AUGUST 31, 2017 TO DATE MARYLAND HAS REACHED 2, 645 COMPLETERS 88% OF GOAL TO DATE Special thanks to Maryland’s Area Agencies on Aging, County Health Departments, Hospital Partners, Other Community-Based Partners and to the U. S. Administration on Aging
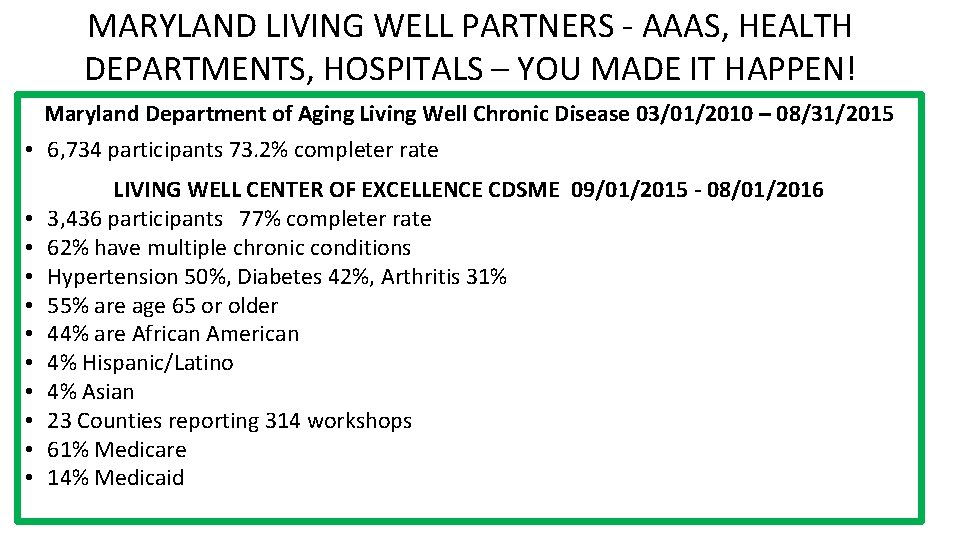
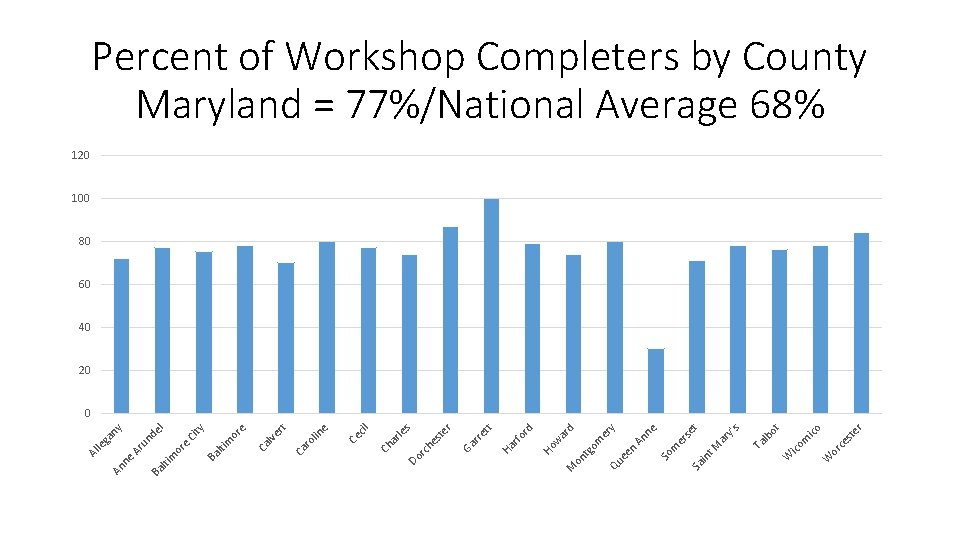
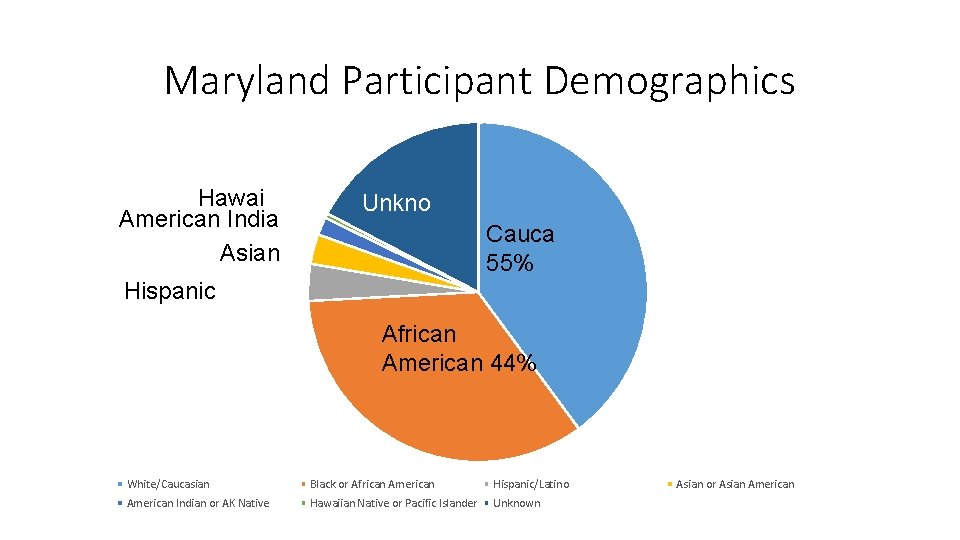
MARYLAND LIVING WELL PARTNERS - AAAS, HEALTH DEPARTMENTS, HOSPITALS – YOU MADE IT HAPPEN! Maryland Department of Aging Living Well Chronic Disease 03/01/2010 – 08/31/2015 • 6, 734 participants 73. 2% completer rate • • • LIVING WELL CENTER OF EXCELLENCE CDSME 09/01/2015 - 08/01/2016 3, 436 participants 77% completer rate 62% have multiple chronic conditions Hypertension 50%, Diabetes 42%, Arthritis 31% 55% are age 65 or older 44% are African American 4% Hispanic/Latino 4% Asian 23 Counties reporting 314 workshops 61% Medicare 14% Medicaid
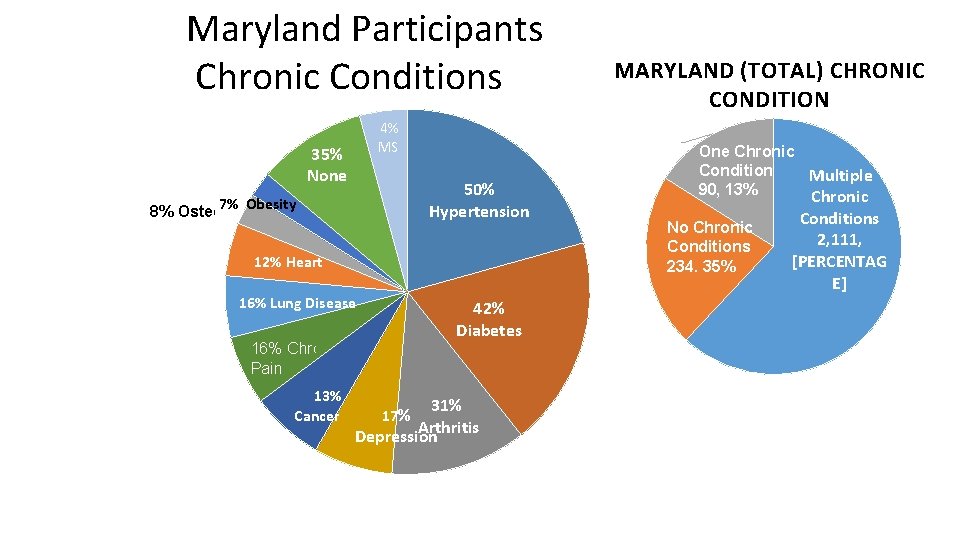
Maryland Participants Chronic Conditions 4% MS 35% None 90, 13% 50% Hypertension 7% Obesity 8% Osteoporosis 12% Heart 16% Lung Disease 42% Diabetes 16% Chronic Pain 13% Cancer 31% Arthritis Depression 17% MARYLAND (TOTAL) CHRONIC CONDITION One Chronic Condition Multiple 90, 13% Chronic No Chronic Conditions 234. 35% Conditions 2, 111, [PERCENTAG E]
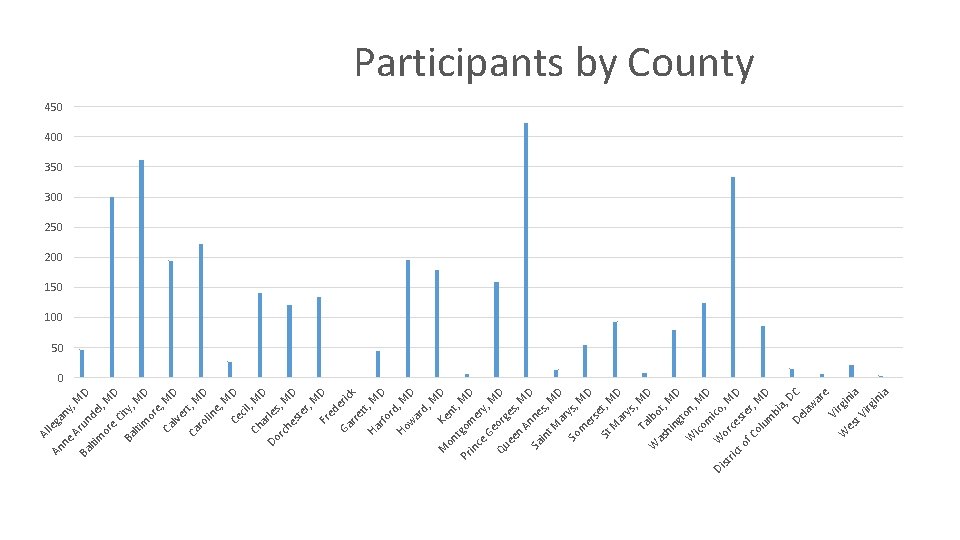
D , M D M Ga eric k rre tt, Ha M D rfo rd Ho , M D w ar d, M D Ke M on nt , tg Pr om MD in er ce Ge y, M D Qu org es ee , n An MD ne Sa s in t. M , M D ar y s So m , MD er se t, St M M D ar ys , Ta MD lb W ot as , hi ng MD t W on, ico M D m ico W Di , or st ric ce MD to s f C ter, M ol um D bi a, DC De la w ar e Vi r gin W es t V ia irg in ia ed Fr s, D D D M M D M , M er st ar le he rc Do Ch cil Ce e, lin ro Ca e, rt, lve Ca D D , M ty Ci D l, M de , M ny m or lti Ba e un or m Ba lti Ar ga le Al ne An Participants by County 450 400 350 300 250 200 150 100 50 0
er st ce W or m ico ot y's Ta lb ico W ne y se t ar t. M in Sa An m er So en Qu e d ar w om er tg on M Ho rd rfo Ha tt rre Ga r s le te es ch Do r ar Ch cil Ce e rt lin Ca ro lve Ca e or ty Ci tim Ba l or e l de ny ga un Ar m lti Ba ne An le Al Percent of Workshop Completers by County Maryland = 77%/National Average 68% 120 100 80 60 40 20 0
Maryland Participant Demographics Hawaiian 1% Unknown American Indian 2% Asian 4% Caucasian 55% Hispanic Latino 4% African American 44% White/Caucasian Black or African American Hispanic/Latino American Indian or AK Native Hawaiian Native or Pacific Islander Unknown Asian or Asian American
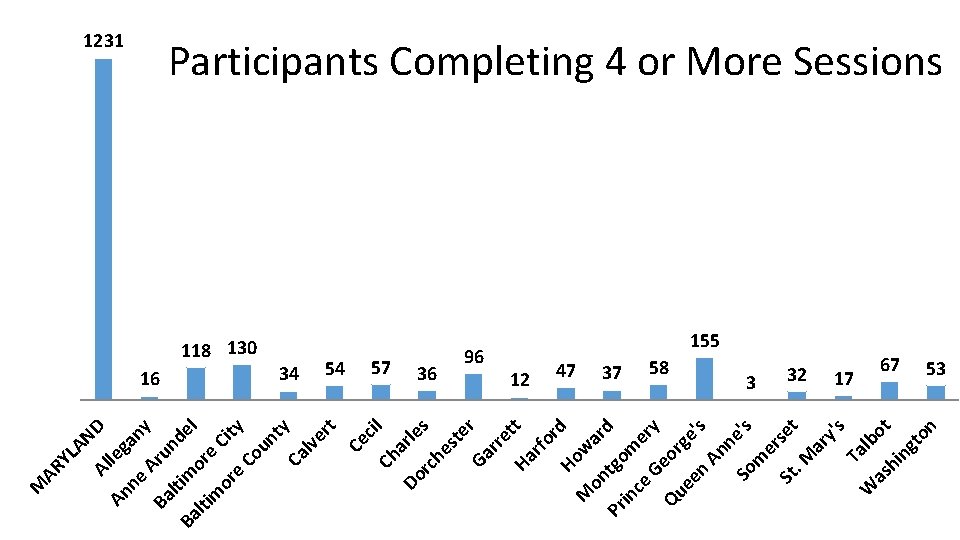
an le g D y A r Ba un lti m del Ba or lti e m or Cit y e Co un ty Ca lv er t Ce cil Ch Do arle s rc he st er Ga rr et Ha t rfo r Ho d M w on ar Pr tgo d in ce mer Ge y Qu or ee ge' s n An n So e's m er St set. M ar y's T W alb ot as hi ng to n ne An Al AN YL AR M 1231 Participants Completing 4 or More Sessions 118 130 16 34 54 57 36 96 155 12 47 37 58 3 32 17 67 53
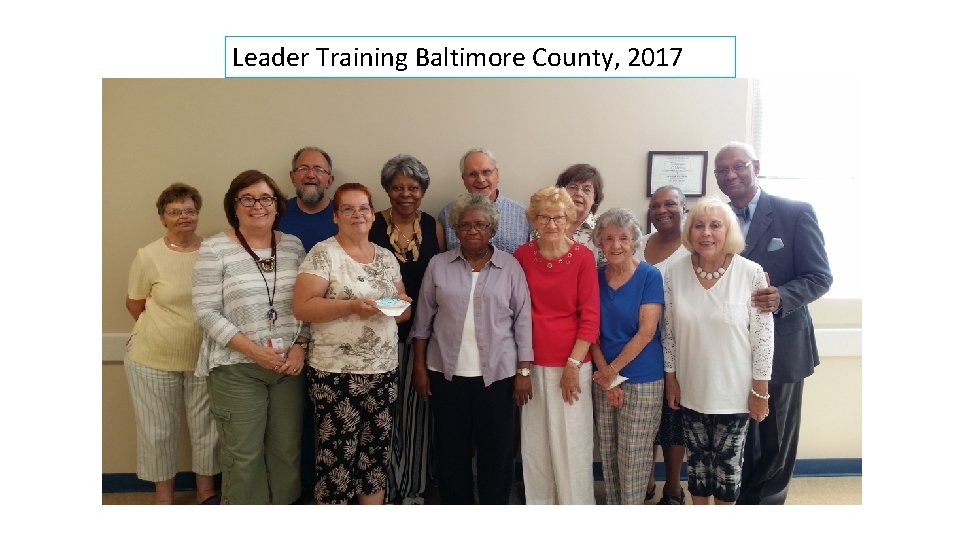
Leader Training Baltimore County, 2017
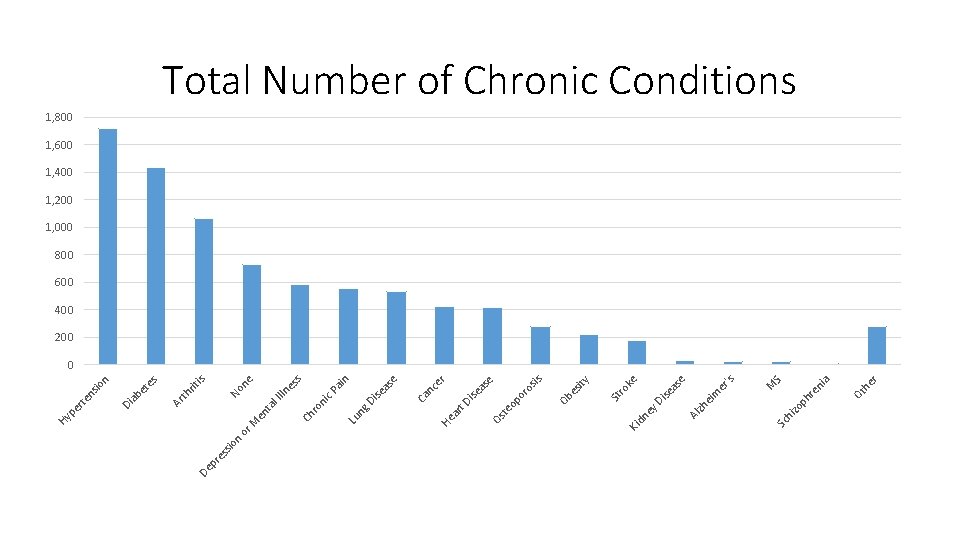
De n sio es pr zo p hi Sc r he Ot ia en hr S M 's er m ei e as ise y. D zh Al ne ke ro St ity es Ob sis ro po e er as se Di n s as e nc Ca se Di eo ar t Os t He ng Lu ai c. P ni ro Ch es ln ne No l Il ta en M Ki d or is s n te rit th Ar be Di a io ns rte pe Hy Total Number of Chronic Conditions 1, 800 1, 600 1, 400 1, 200 1, 000 800 600 400 200 0
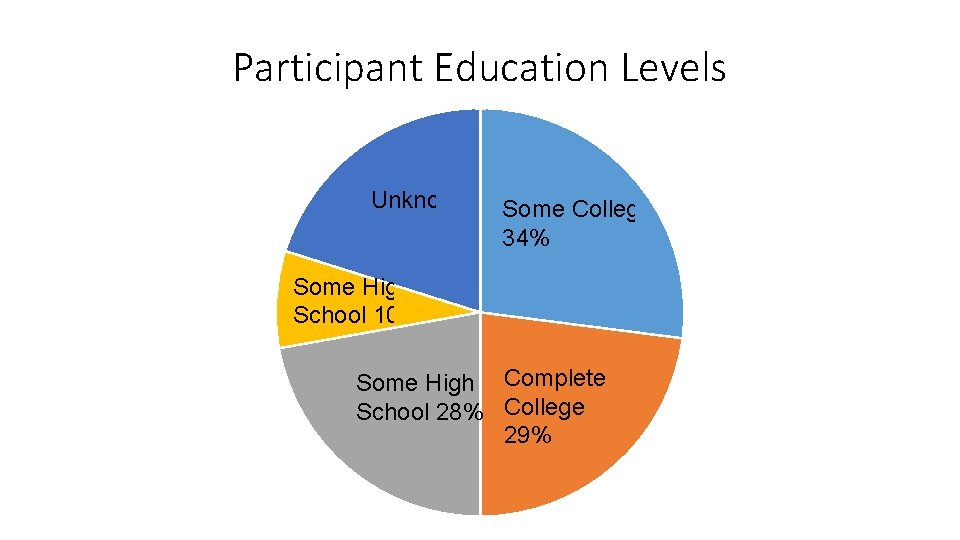
Participant Education Levels Unknown Some College 34% Some High School 10% Some High Completed School 28% College 29%
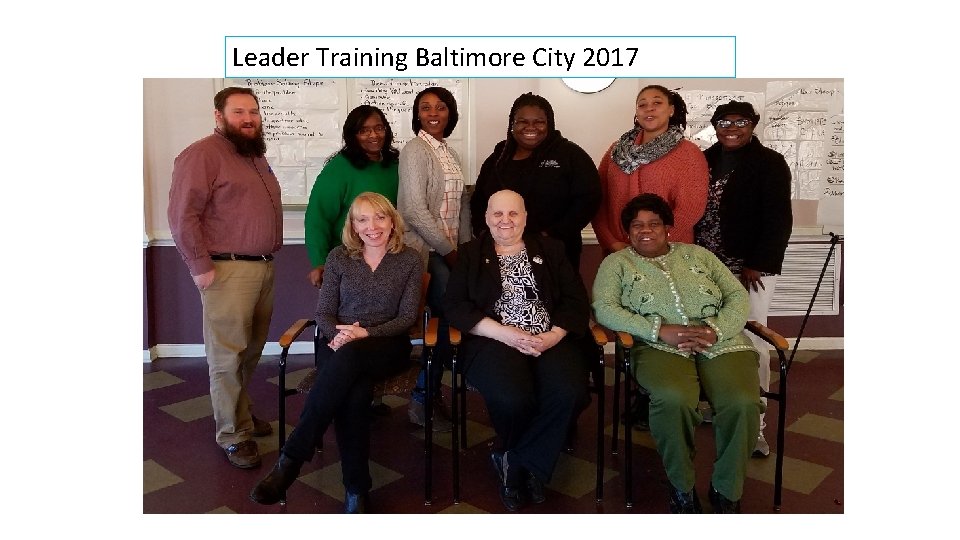
Leader Training Baltimore City 2017
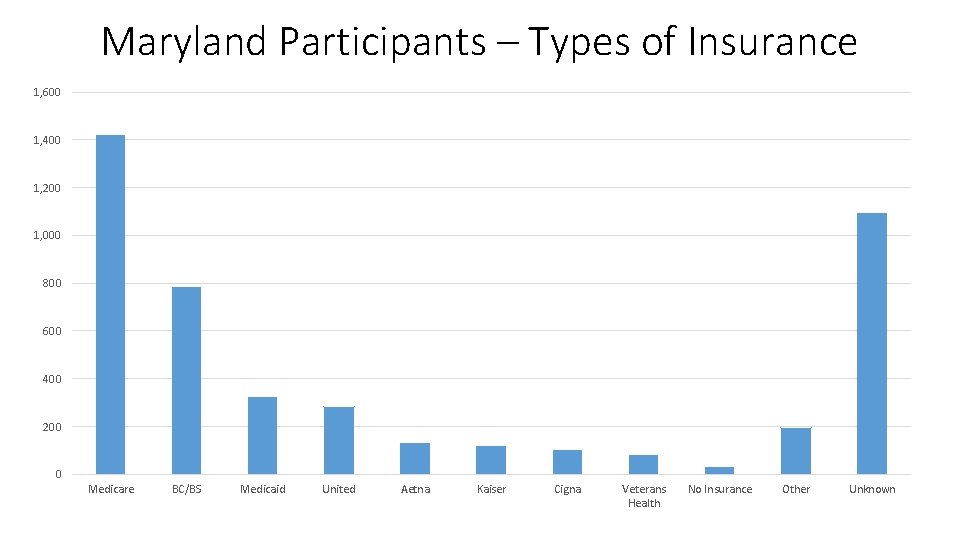
Maryland Participants – Types of Insurance 1, 600 1, 400 1, 200 1, 000 800 600 400 200 0 Medicare BC/BS Medicaid United Aetna Kaiser Cigna Veterans Health No Insurance Other Unknown
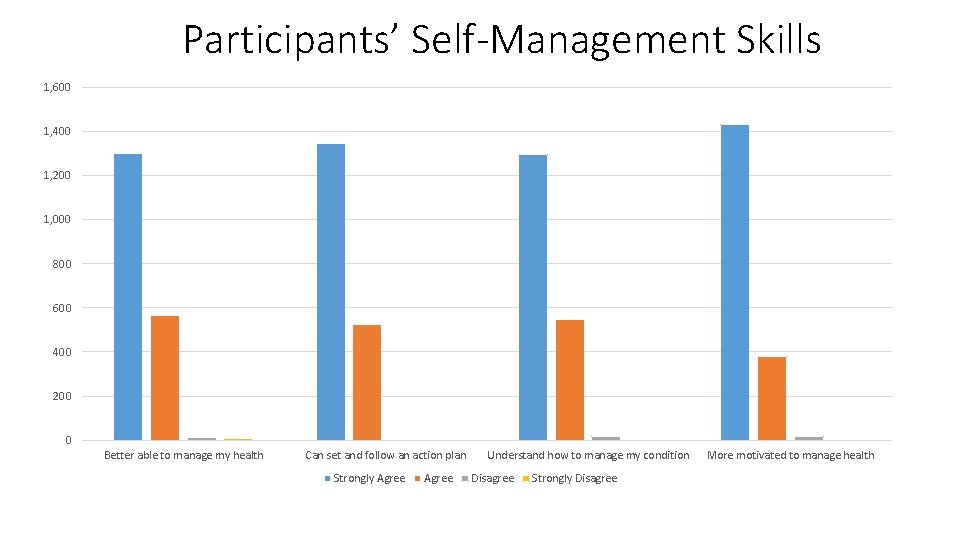
Participants’ Self-Management Skills 1, 600 1, 400 1, 200 1, 000 800 600 400 200 0 Better able to manage my health Can set and follow an action plan Strongly Agree Understand how to manage my condition Disagree Strongly Disagree More motivated to manage health
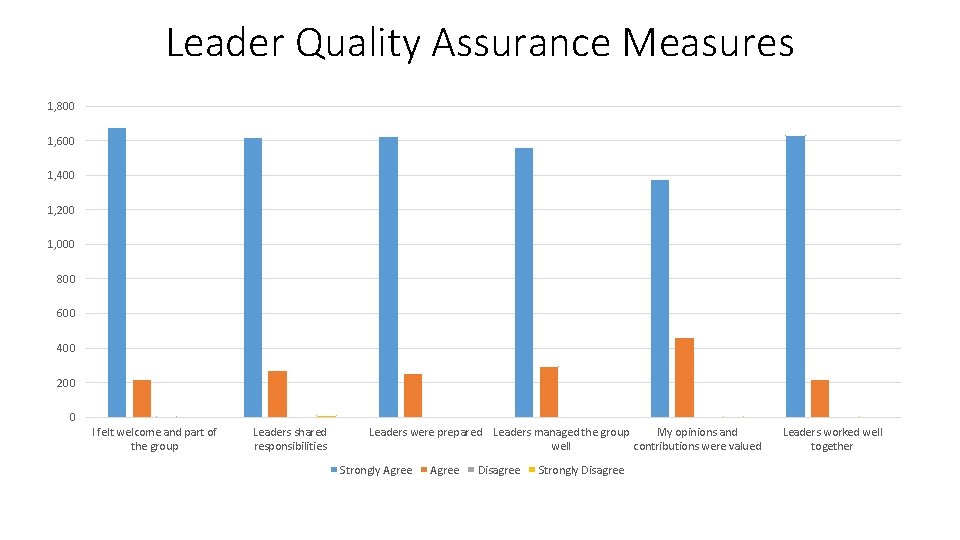
Leader Quality Assurance Measures 1, 800 1, 600 1, 400 1, 200 1, 000 800 600 400 200 0 I felt welcome and part of the group Leaders shared responsibilities Leaders were prepared Leaders managed the group My opinions and well contributions were valued Strongly Agree Disagree Strongly Disagree Leaders worked well together
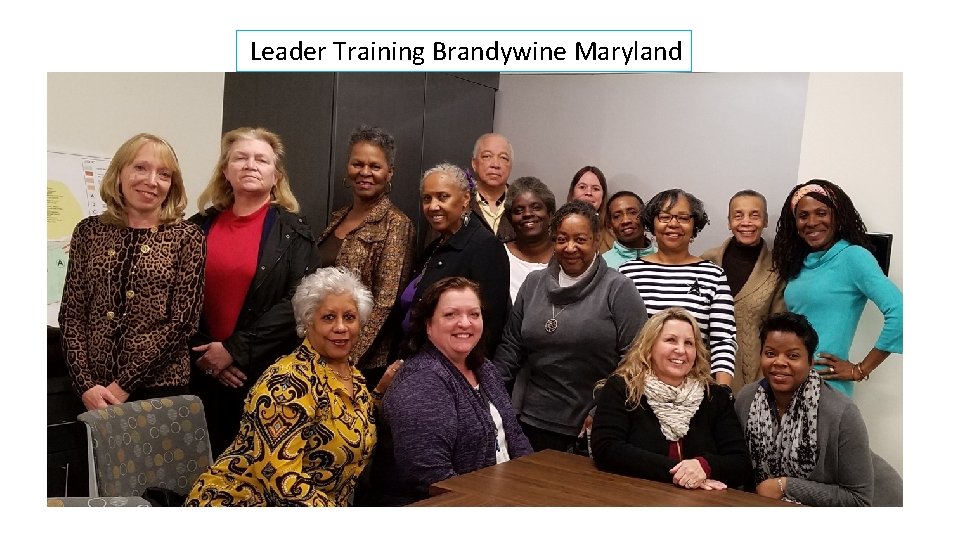
Leader Training Brandywine Maryland
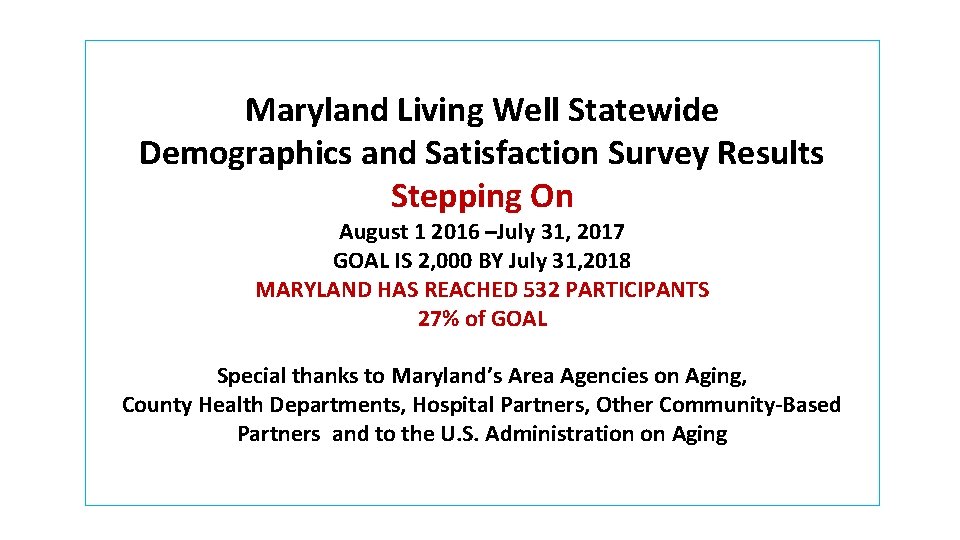
Maryland Living Well Statewide Demographics and Satisfaction Survey Results Stepping On August 1 2016 –July 31, 2017 GOAL IS 2, 000 BY July 31, 2018 MARYLAND HAS REACHED 532 PARTICIPANTS 27% of GOAL Special thanks to Maryland’s Area Agencies on Aging, County Health Departments, Hospital Partners, Other Community-Based Partners and to the U. S. Administration on Aging
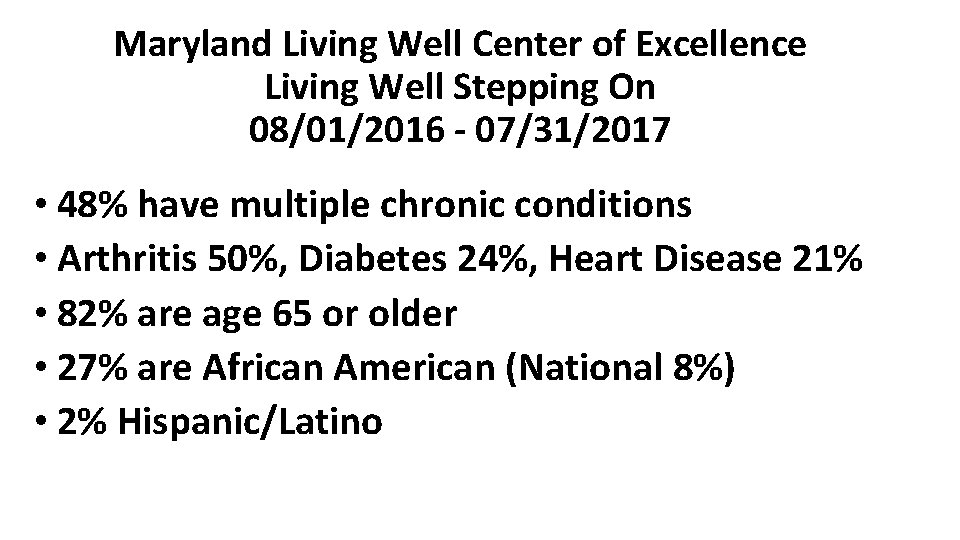
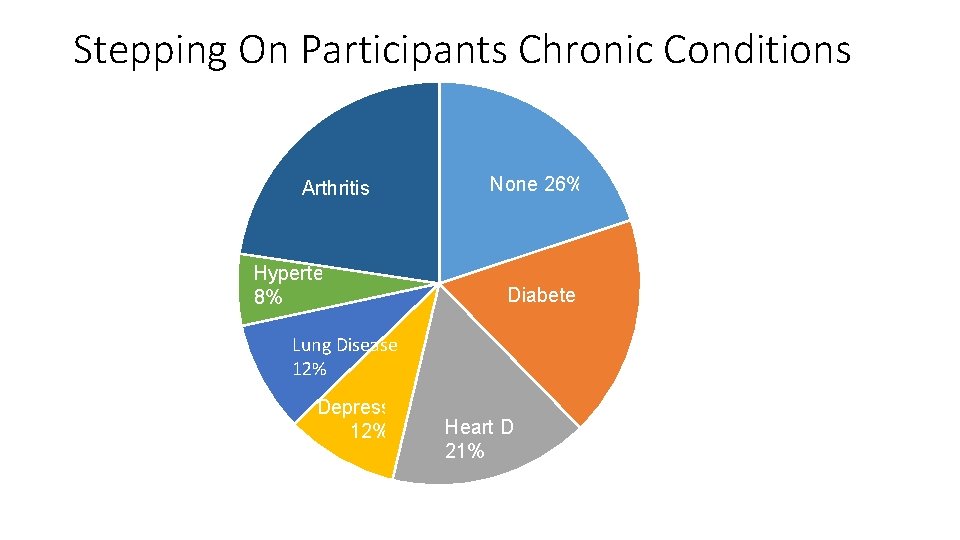
Maryland Living Well Center of Excellence Living Well Stepping On 08/01/2016 - 07/31/2017 • 48% have multiple chronic conditions • Arthritis 50%, Diabetes 24%, Heart Disease 21% • 82% are age 65 or older • 27% are African American (National 8%) • 2% Hispanic/Latino
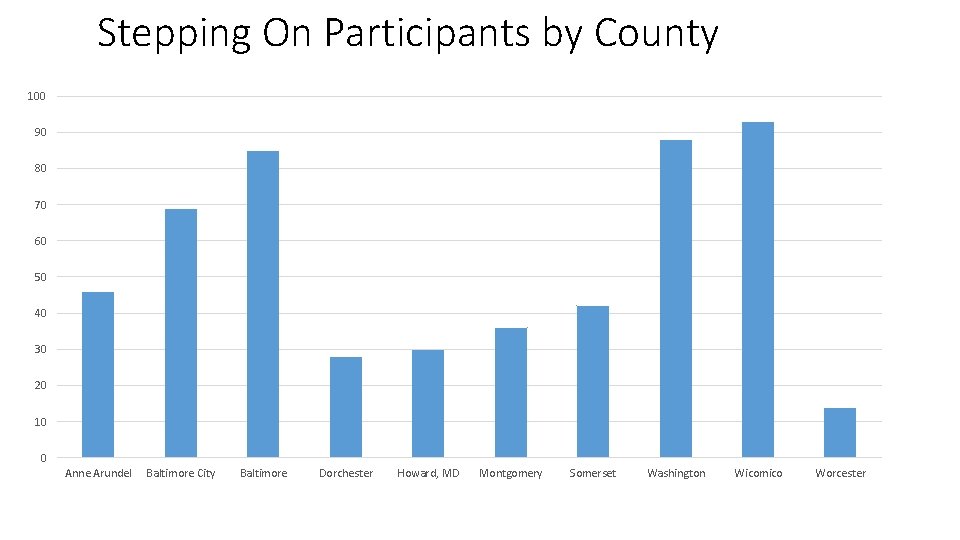
Stepping On Participants by County 100 90 80 70 60 50 40 30 20 10 0 Anne Arundel Baltimore City Baltimore Dorchester Howard, MD Montgomery Somerset Washington Wicomico Worcester
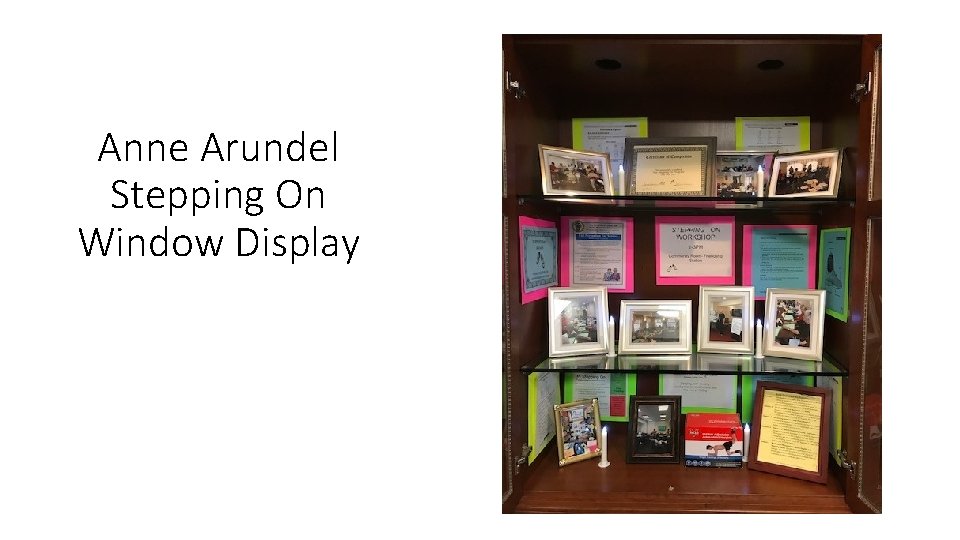
Anne Arundel Stepping On Window Display
Stepping On Participants Chronic Conditions Arthritis 50% Hypertension 8% None 26% Diabetes 24% l Lung Disease 12% Depression 12% Heart Disease 21%
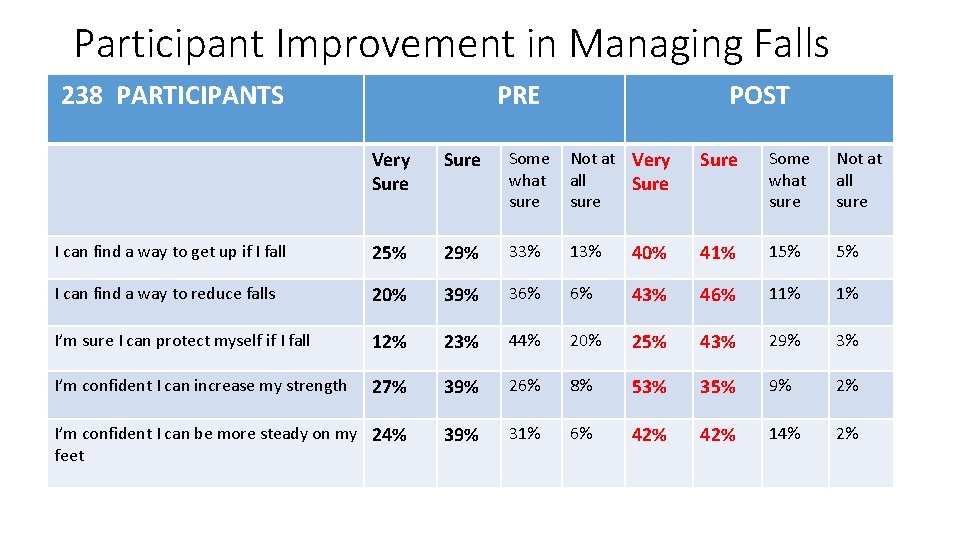
Participant Improvement in Managing Falls 238 PARTICIPANTS PRE POST Very Sure Some what sure Not at Very all Sure sure Some what sure Not at all sure I can find a way to get up if I fall 25% 29% 33% 13% 40% 41% 15% 5% I can find a way to reduce falls 20% 39% 36% 6% 43% 46% 11% 1% I’m sure I can protect myself if I fall 12% 23% 44% 20% 25% 43% 29% 3% I’m confident I can increase my strength 27% 39% 26% 8% 53% 35% 9% 2% I’m confident I can be more steady on my 24% feet 39% 31% 6% 42% 14% 2%
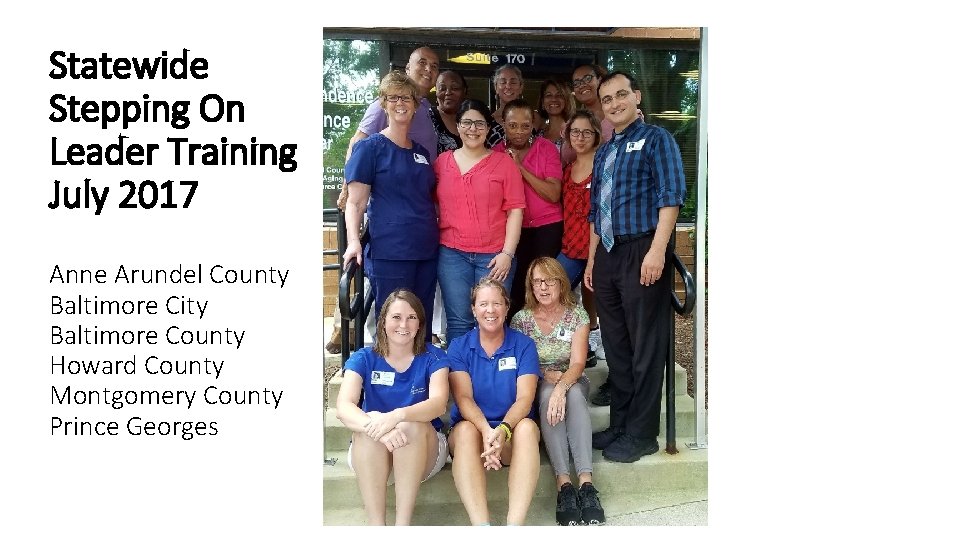
Statewide Stepping On Leader Training July 2017 Anne Arundel County Baltimore City Baltimore County Howard County Montgomery County Prince Georges