Oregon Supported Employment Center for Excellence Statewide Conference


 with a reported")


 in July.")


 is projected to grow at a faster")


")
- Slides: 70
Oregon Supported Employment Center for Excellence Statewide Conference Salem Oregon September 11 -12, 2012 “Oregon Economy and Employment Opportunities” Presenter Malcolm G Boswell Work. Source Oregon Employment Department
Oregon’s Employment Situation Updated: August 23, 2012
Oregon’s unemployment rate has fallen by nearly 3 percentage points since the peak of 11. 6% in 2009. We are now close to the national rate. Oregon’s July Unemployment Rate In 2010: 10. 6% In 2011: 9. 6% In 2012: 8. 7%
This recession’s unemployment rate peaked at 11. 6% in Oregon, slightly below the 12. 1% of the early ‘ 80 s.
The “additional” unemployed came from layoffs during the recession. New and returning “entrants” have kept unemployment levels relatively high even as layoffs have slowed.
The unemployment rate in rural areas is still well above urban areas.
July 2012 Seasonally adjusted unemployment rates vary from Benton County’s 6. 3% to Crook County’s 14. 1%. Sixteen of Oregon’s 36 counties have rates at or below the statewide level of 8. 7 percent.
Types of Unemployment Seasonally Adjusted Unemployment Rates means that we remove the seasonal ups and downs by removing the average annual increases / decreases common to the season from the data. Full Employment Frictional Unemployment Structural Unemployment
How Do Businesses React To Changes In Unemployment? IMPORTANT! When Unemployment is High (over 6%) Demand for skills goes up A trend is a change over time. It takes six or more months of unemployment data to determine if it is going up or down! Wages offered tend to drop EMPLOYER’S MARKET Full Employment When Unemployment is Low (over 5%) Demand for skills goes down Wages offered tend to rise JOB SEEKER’S MARKET
Men experienced a more dramatic increase in unemployment than women in recent years.
Unemployment also varies by age groups. It’s especially high among younger workers.
Unemployment rates by race and ethnicity differ less now than in the past, but all remain at high levels.
Average labor force participation rate of population (16 yrs or older) with a reported disability during this same time period: 21. 7% Compared to a 70. 3 % participation rate for people with no reported disability
Currently, two out of every five unemployed Oregonians have been jobless for 27 weeks or longer. Long-term unemployment trend since 2002: Fewest: 10, 800 in January 2007 Peaked: 101, 900 in June 2010 Current: 72, 700 in July 2012
How to help the long-term unemployed is one of the biggest challenges we face.
Some employers may be hesitant to hire applicants who are unemployed… During the annual conference of the Oregon Employer Council, attendees were asked what reasons, if any, might prevent them from hiring the long-term unemployed. Responses included: • The long-term unemployed may have a bad attitude and/or lack motivation. • They may lack interview skills and/or do not properly prepare for an interview. • In some cases, the laid-off “weren’t the cream of the crop” to begin with. • Their skills may have become stale. • In some cases, they lack soft skills, i. e. time management, selfconfidence, acting as a team player.
…but job seekers can address some of those concerns. The majority of employers said they would consider hiring the long-term unemployed if they … … have the skill set to fill the position. … were doing something productive - volunteering, attending school, homemaking - during their period of unemployment (It was noted that it’s very important the long-term unemployed note these activities on their resume; otherwise, they don’t get to the interview and don’t have the opportunity to describe what they’ve done) … have a reasonable reason as to why they’ve been unemployed.
The labor force has been flat over the last year, which helps keep the unemployment rate low. • Slow population growth • Retirements • Low teen participation
Total employment has also shown some growth. Up by 59, 800 since the most recent low in October 2009. Includes farm jobs, self -employed, based on place of residence … so includes Oregonians who work in Washington or elsewhere.
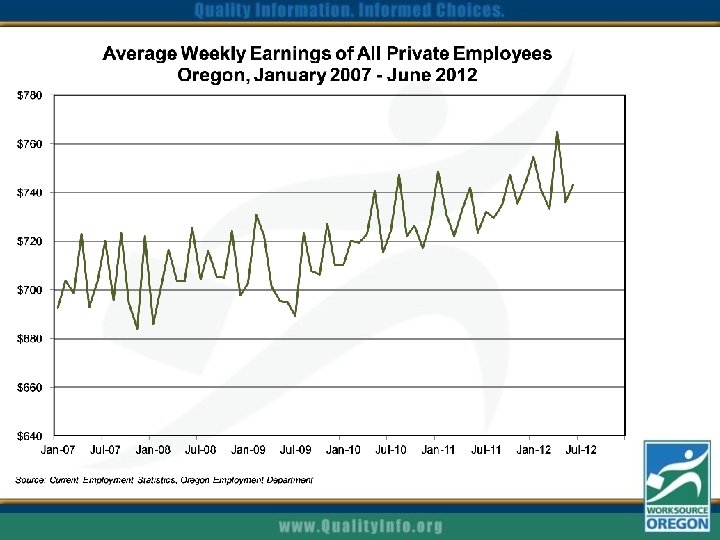
The last few months have included some decent news. But … we have to keep things in perspective. It’s a long climb back.
Reducing the unemployment rate? Based on OEA population projections and recent labor force participation rate: Steady: Average of +800 jobs per month keeps rate about 8. 5% Decline: Need to average +3, 300 per month to reach 7. 5% by 2015. Current: Averaged +2, 400 per month in January to June 2012. Note: changes in the rate of Baby Boomer retirements, in-migration to Oregon, and labor force participation have effects on these scenarios.
Last year was off to a strong start, then job growth stalled. This year looks off to a strong start… From January 2011 to April 2011: Average monthly nonfarm employment gain: +2, 950 jobs From May 2011 to December 2011: Average monthly nonfarm employment change: -50 jobs Jan. to June 2012: Average monthly nonfarm employment change: 2, 200 jobs
The private sector shed more than 150, 000 jobs during the recession. It’s been the driver of growth in Oregon and has now gained back than 50, 500 jobs.
Number of Help-Wanted Ads in Oregon decreased 2, 100 ( -3. 7%) in July.
Oregon and U. S. ad growth following similar trends.
Help Wanted Online Ads growth has been uneven across the United States. • Ads in neighboring states showed mixed trends in July • • • Nevada +1, 700 Idaho +100 Oregon -2, 100 Washington -2, 400 California -9, 200 • Number of ads fell by 153, 600 in the U. S. in July • U. S. is now 7. 4% above pre-recession high. • Oregon is still 26. 2% below pre-recession high.
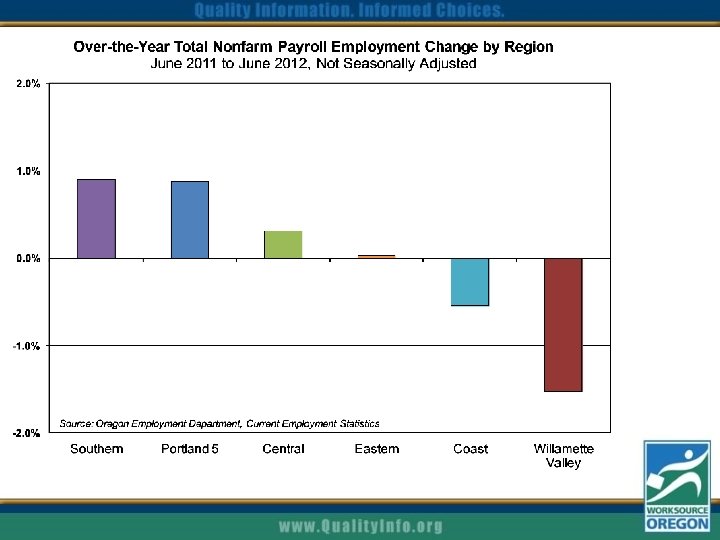
The year-over-year picture in the private sector is a lot more positive than it’s been in a while.
Construction’s job growth is building slowly. The industry’s only 3, 400 above its recessionary low. Construction employment is at levels not seen since 1995.
We lost nearly 40 percent of our construction jobs. It’s going to take a while – a long while – to get them back, just as it did following the 1980 s recession …
Manufacturing added 6, 000 jobs since the low point in October 2009. We’re still at the lowest levels since about 1970.
Wholesale trade is adding back jobs.
Retail is adding jobs, despite talk of slowing consumer spending.
Transportation, warehousing, and utilities is one of those industries experiencing increased volatility … making discernment of a real trend difficult.
Financial services employment may be coming off its recessionary low.
Professional and business services are growing again and have added 12, 800 jobs since the low in October 2009. Employment services growth has slowed…
Professional and technical services has reached a new high following the recession.
Health services growth has slowed, but it’s still adding jobs. Social services are experiencing job cuts. Over the year: Ambulatory: +1, 500 Hospitals: -200 Nursing and residential: +1, 200 Social assistance: -1, 800
Leisure and hospitality – bottomed out in December 2009 and added 6, 200 jobs since.
Losses in the public sector have been led by job cuts in local education, but state and federal are also cutting jobs.
By the way, while it’s easy to focus on the doom and gloom right now, if we take the long-term view, Oregon’s had a pretty great track record of creating jobs.
We’ve tended to grow faster than the US in the good times, but lose more jobs (relative to our size) in the tough times.
Oregon’s job losses were actually worse in the early 1980 s, but this recovery could take just as long. Source: Oregon Office of Economic Analysis, June 2012
Forecast calls for strong and steady job growth.
Where do we go from here? Job losses generally ended – in a “net” sense – in the fourth quarter of 2009. But we don’t surpass prerecession employment levels until the 1 st quarter of 2015.
…but the growth won’t cover all jobs lost in the recession.
Many industries won’t regain their job losses by the time the entire economy does.
Modest occupational job growth between 2010 -2020 • We expect 18. 1% occupational growth • Robust health care job growth related to growing and ageing population … 27. 9% • Projecting significant growth in construction occupations. But, even with this growth, they will not get back to pre-recession levels ü No major changes in educational requirements ü High wage jobs (>$50, 000 median wage) will account for nearly a third of all job openings
Portland is expected to grow the fastest…
…while rural areas lag behind.
All occupational groups should add jobs
Three out of five job openings are expected due to replacement needs
All major occupational categories projected to grow at 15% or faster
ü Health care dominates top 20 ü Some construction occupations also near the top (but 2020 employment in these occupations will be below prerecession levels)
Although most projected job openings do not require any postsecondary training, …
… training and work experience give job seekers a competitive edge
Not all occupational openings are for low-wage jobs
Occupational groups with the most openings offer few high-wage opportunities
US vs Oregon • Oregon (18. 1%) is projected to grow at a faster pace from 2010 -2020 compared to the US (14. 3%) • 62% of US job openings are due to replacement needs vs. Oregon’s 59% • Health care also fastest growing sector in US
Barriers to Employment for People with Disabilities “People with disabilities face significant barriers to employment” Tell that to…
Lu Dong of China, Gold Medal Backstroke 2012 Paralympics
Christine Ha, Master Chef Finalist
Huang Guofu, Painter
Steven Hawkins, Physicist
Ludwig Van Beethoven, Composer
John Forbes Nash, Jr. , Mathematician Nobel Prize in Economics “A Beautiful Mind”
Karen Carpenter, Singer
And these less famous, yet not less inspiring folks
Malcolm G Boswell, Workforce Analyst Oregon Employment Department Malcolm. G. Boswell@state. or. us (503) 666 -1985 Ext. 6 To find this presentation online, go to www. Quality. Info. org and use the search box to look up my name Join the conversation: Oregon. Employment. blogspot. com Twitter @Or. Employment