Longitudinal Data Analysis for Social Science Researchers Introduction







- Slides: 64
Longitudinal Data Analysis for Social Science Researchers Introduction to Panel Models www. longitudinal. stir. ac. uk
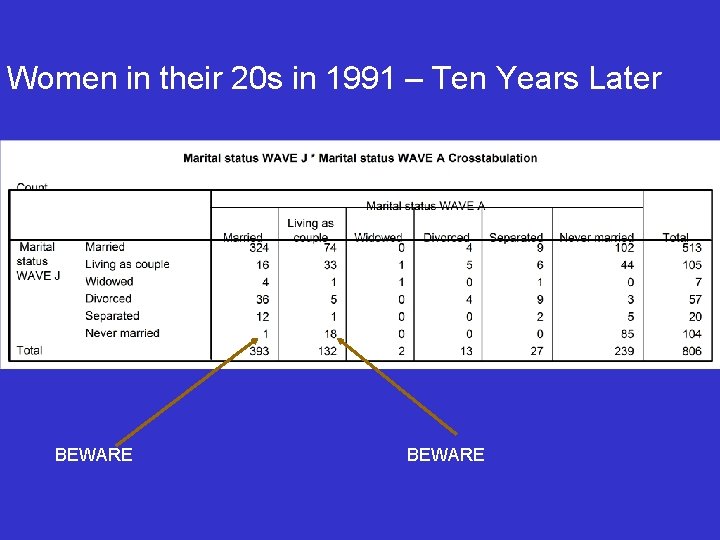
SIMPLE TABLE – PANEL DATA
Women in their 20 s in 1991 – Ten Years Later BEWARE
• Traditionally used in social mobility work • Can be made more exotic for example by incorporating techniques from loglinear modelling (there is a large body of methodological literature in this area)
Change Score • Less likely to use this approach in mainstream social science • Understanding this will help you understand the foundation of more complex panel models (especially this afternoon)
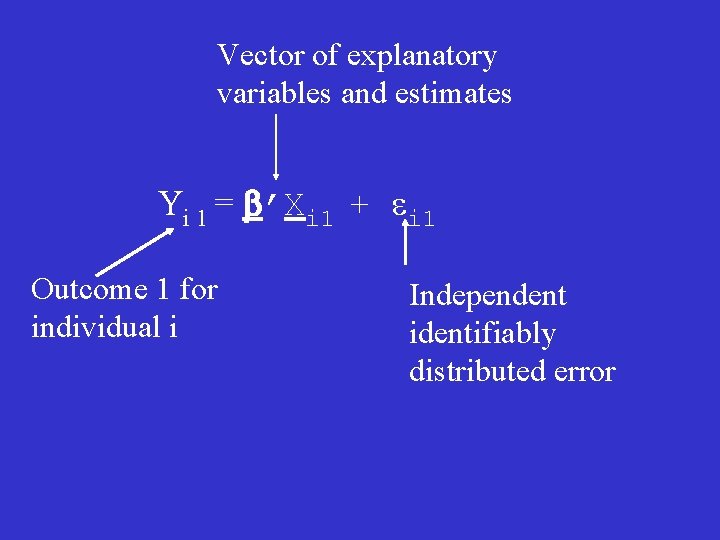
Vector of explanatory variables and estimates Yi 1 = b’Xi 1 + ei 1 Outcome 1 for individual i Independent identifiably distributed error
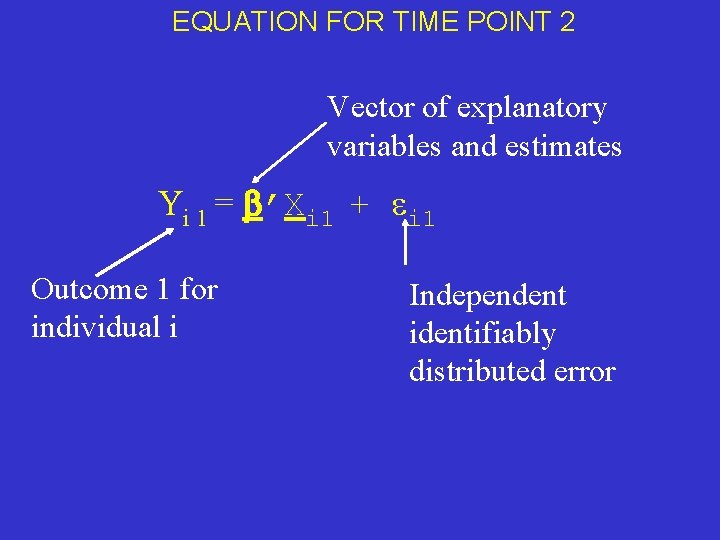
EQUATION FOR TIME POINT 2 Vector of explanatory variables and estimates Yi 1 = b’Xi 1 + ei 1 Outcome 1 for individual i Independent identifiably distributed error
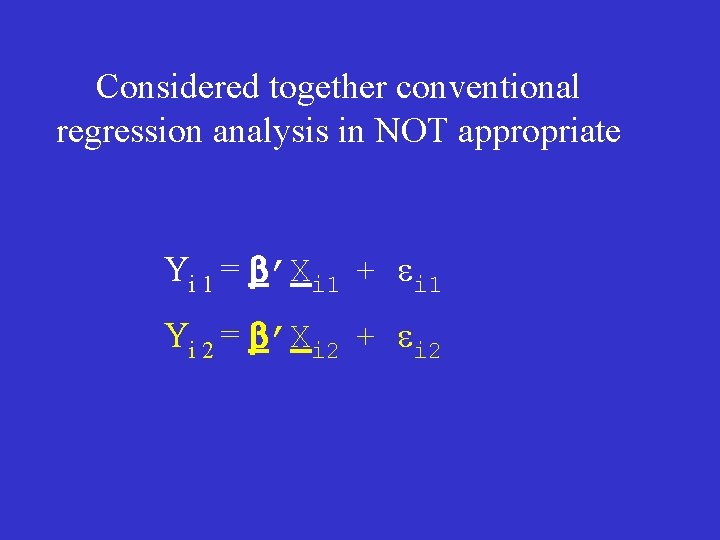
Considered together conventional regression analysis in NOT appropriate Yi 1 = b’Xi 1 + ei 1 Yi 2 = b’Xi 2 + ei 2
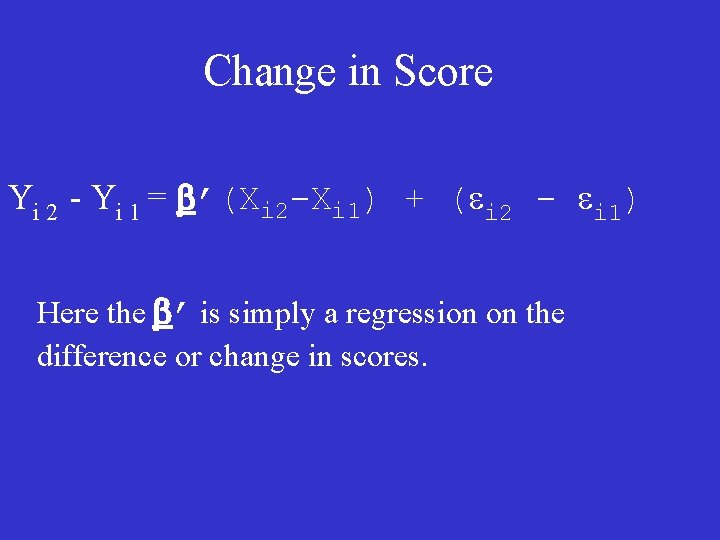
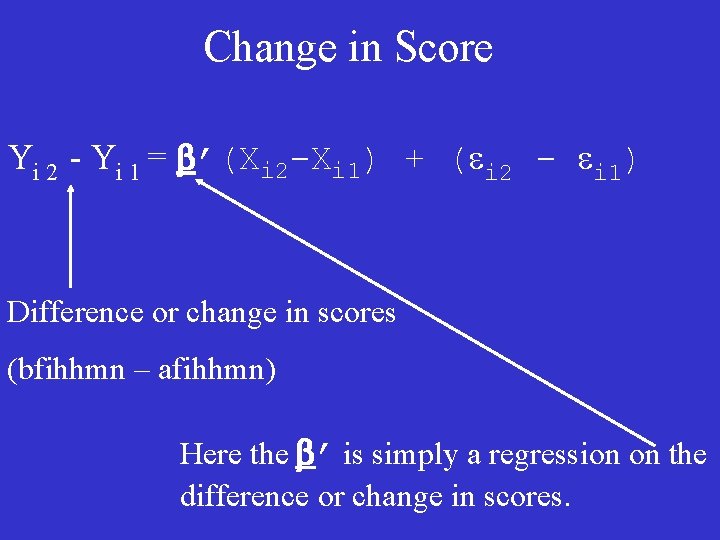
Change in Score Yi 2 - Yi 1 = b’(Xi 2 -Xi 1) + (ei 2 - ei 1) Here the b’ is simply a regression on the difference or change in scores.
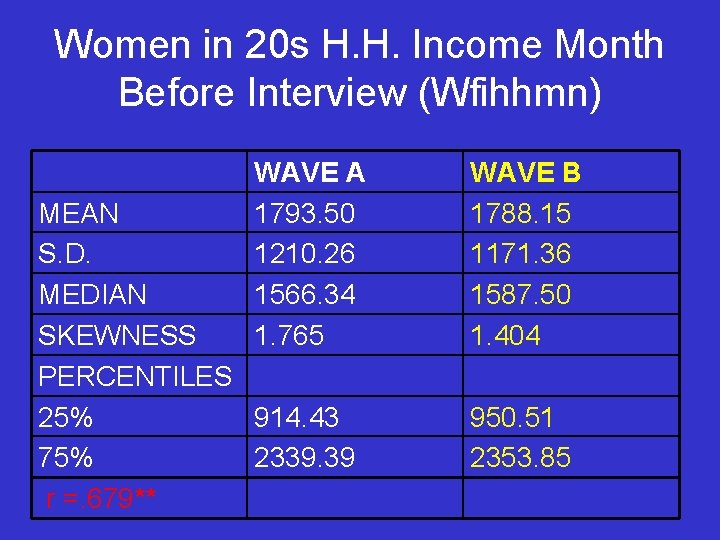
Women in 20 s H. H. Income Month Before Interview (Wfihhmn) WAVE A 1793. 50 1210. 26 1566. 34 1. 765 MEAN S. D. MEDIAN SKEWNESS PERCENTILES 25% 914. 43 75% 2339. 39 r =. 679** WAVE B 1788. 15 1171. 36 1587. 50 1. 404 950. 51 2353. 85
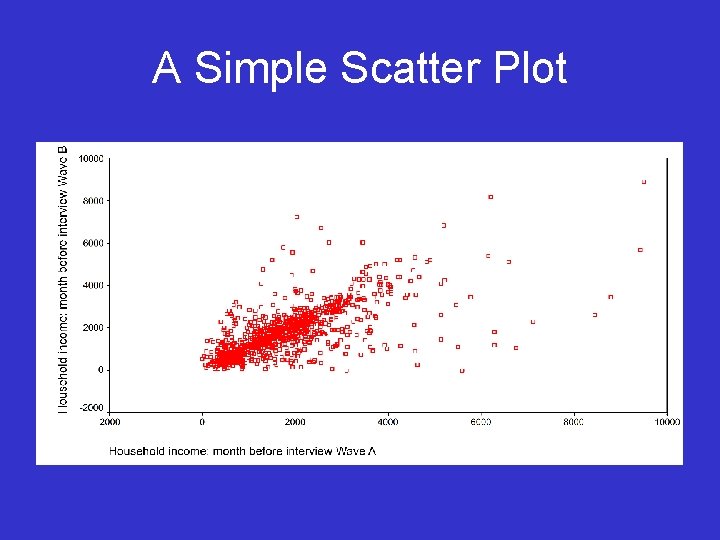
A Simple Scatter Plot
Change in Score Yi 2 - Yi 1 = b’(Xi 2 -Xi 1) + (ei 2 - ei 1) Difference or change in scores (bfihhmn – afihhmn) Here the b’ is simply a regression on the difference or change in scores.
Models for Multiple Measures
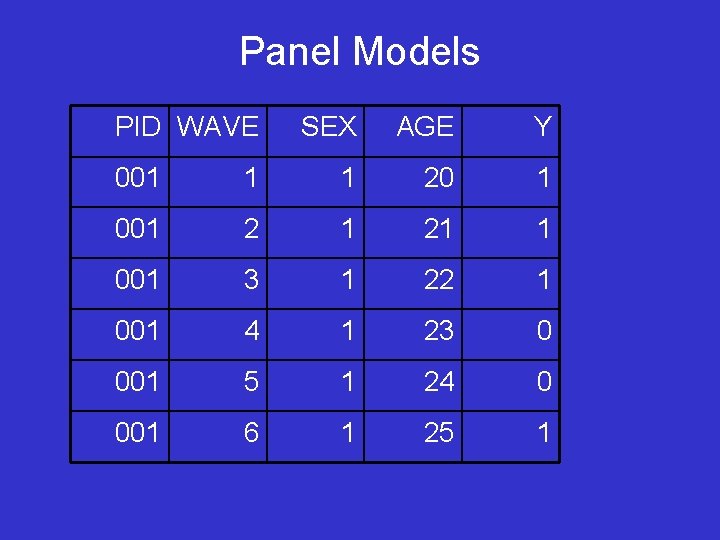
Panel Models PID WAVE SEX AGE Y 001 1 1 20 1 001 2 1 21 1 001 3 1 22 1 001 4 1 23 0 001 5 1 24 0 001 6 1 25 1
Models for Multiple Repeated Measures “Increasingly, I tend to think of these approaches as falling under the general umbrella of generalised linear modelling (glm). This allows me to think about longitudinal data analysis simply as an extension of more familiar statistical models from the regression family. It also helps to facilitate the interpretation of results. ”
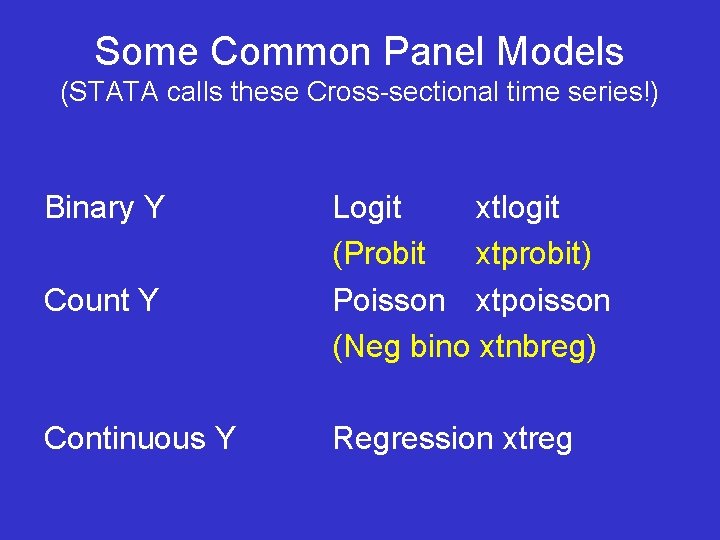
Some Common Panel Models (STATA calls these Cross-sectional time series!) Binary Y Count Y Continuous Y Logit xtlogit (Probit xtprobit) Poisson xtpoisson (Neg bino xtnbreg) Regression xtreg
Models for Multiple Measures
As social scientists we are often substantively interested in whether a specific event has occurred. Therefore for the next 30 minutes I will mostly be concentrating on models for binary outcomes
Recurrent events are merely outcomes that can take place on a number of occasions. A simple example is unemployment measured month by month. In any given month an individual can either be employed or unemployed. If we had data for a calendar year we would have twelve discrete outcome measures (i. e. one for each month).
Consider a binary outcome or two-state event 0 = Event has not occurred 1 = Event has occurred In the cross-sectional situation we are used to modelling this with logistic regression.
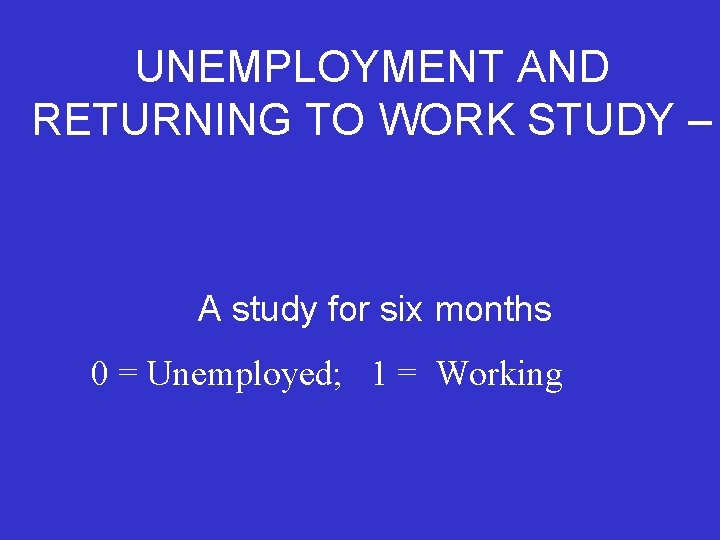
UNEMPLOYMENT AND RETURNING TO WORK STUDY – A study for six months 0 = Unemployed; 1 = Working
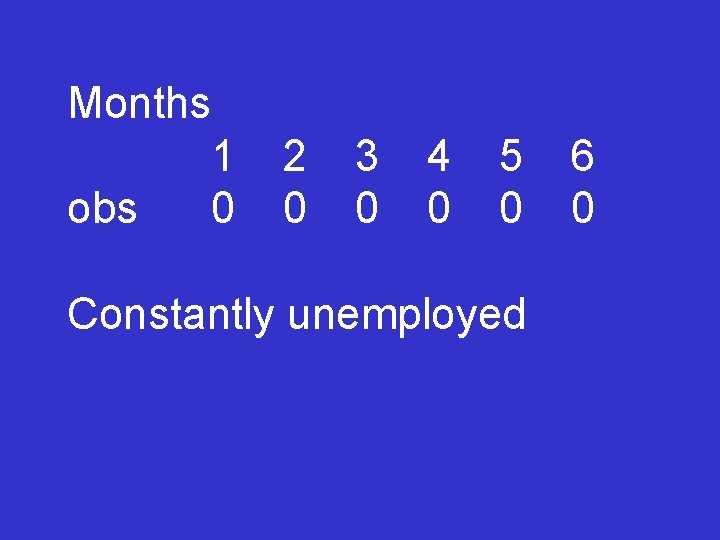
Months 1 obs 0 2 0 3 0 4 0 5 0 Constantly unemployed 6 0
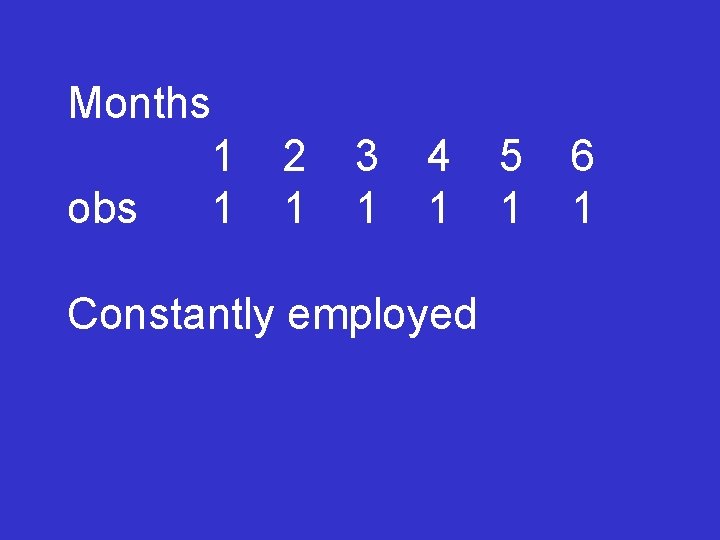
Months 1 obs 1 2 1 3 1 4 1 Constantly employed 5 1 6 1
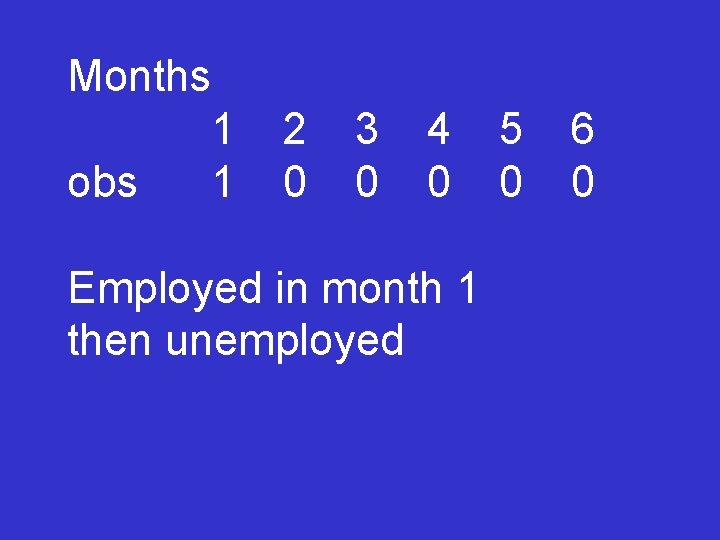
Months 1 obs 1 2 0 3 0 4 0 Employed in month 1 then unemployed 5 0 6 0
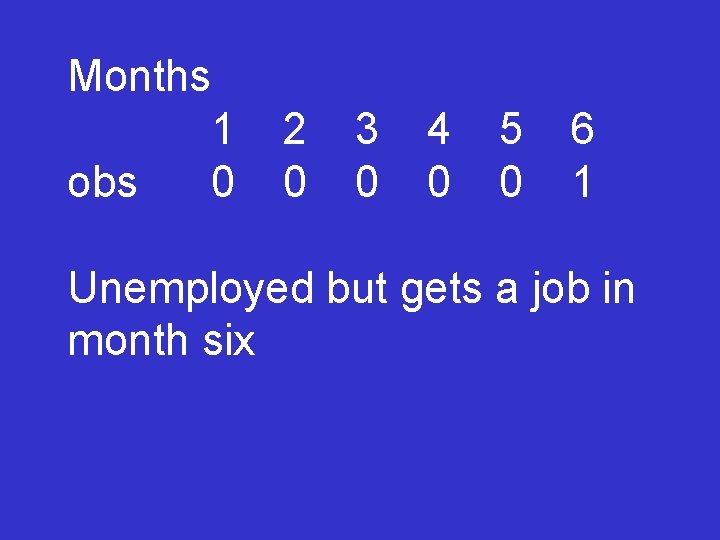
Months 1 obs 0 2 0 3 0 4 0 5 0 6 1 Unemployed but gets a job in month six
Here we have a binary outcome – so could we simply use logistic regression to model it? Yes and No – We need to think about this issue.
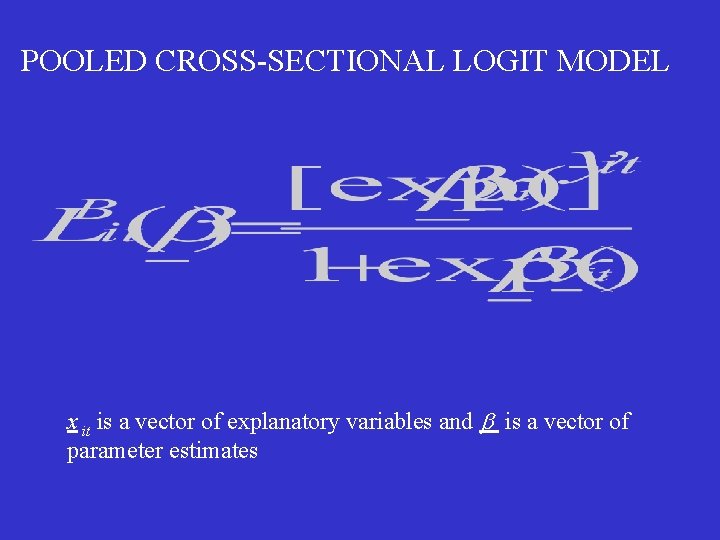
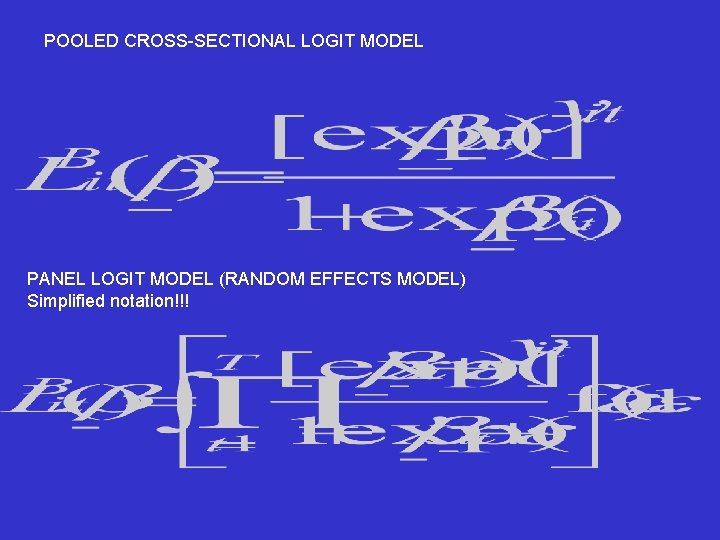
POOLED CROSS-SECTIONAL LOGIT MODEL x it is a vector of explanatory variables and b is a vector of parameter estimates
We could fit a pooled crosssectional model to our recurrent events data. This approach can be regarded as a naïve solution to our data analysis problem.
We need to consider a number of issues….
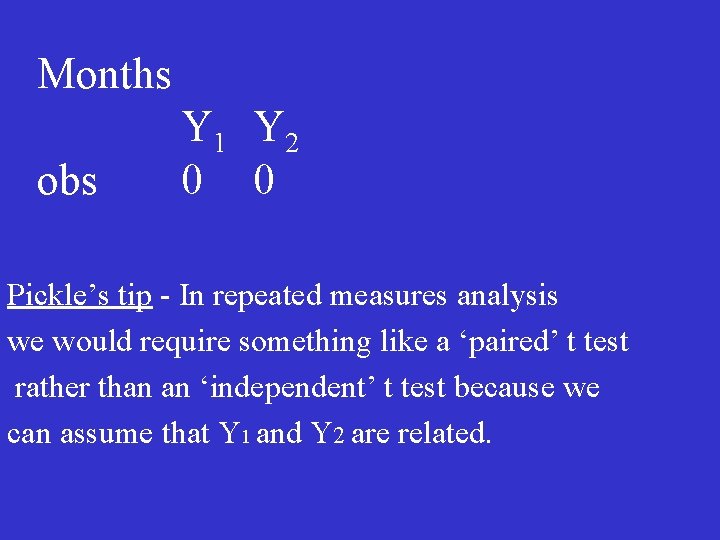
Months obs Y 1 Y 2 0 0 Pickle’s tip - In repeated measures analysis we would require something like a ‘paired’ t test rather than an ‘independent’ t test because we can assume that Y 1 and Y 2 are related.
Repeated measures data violate an important assumption of conventional regression models. The responses of an individual at different points in time will not be independent of each other.
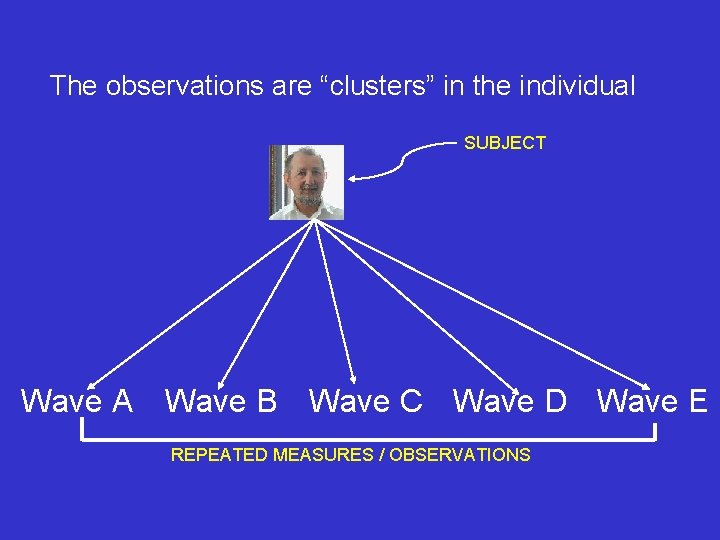
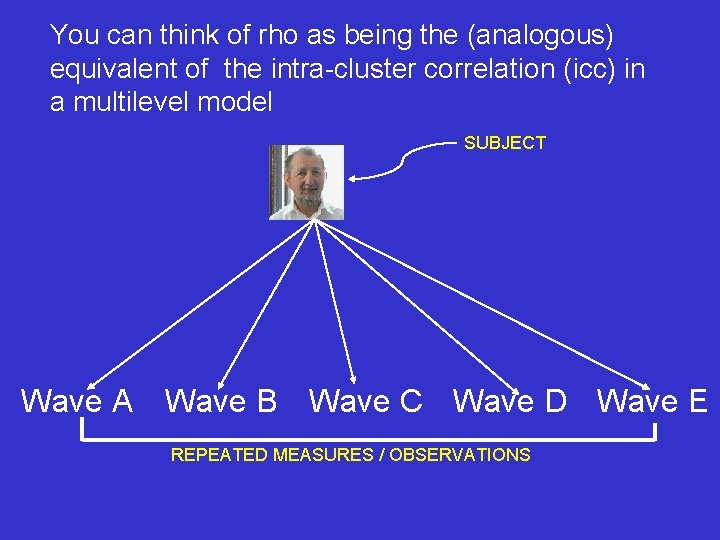
The observations are “clusters” in the individual SUBJECT Wave A Wave B Wave C Wave D Wave E REPEATED MEASURES / OBSERVATIONS
Repeated measures data violate an important assumption of conventional regression models. The responses of an individual at different points in time will not be independent of each other. This problem has been overcome by the inclusion of an additional, individual-specific error term.
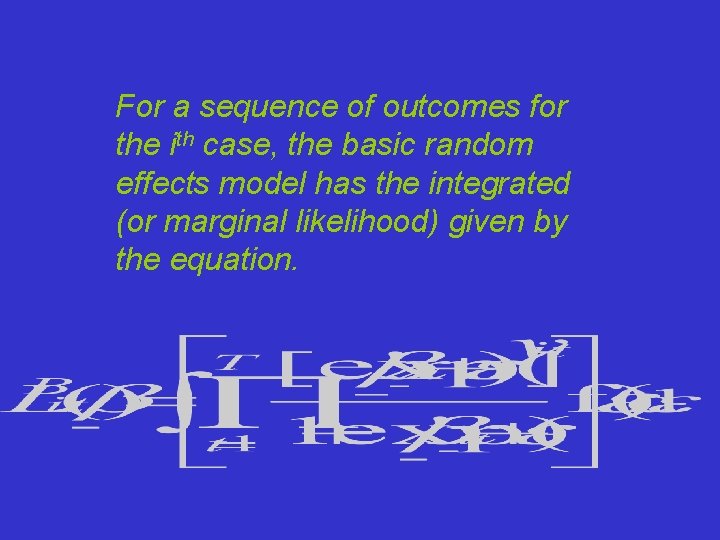
POOLED CROSS-SECTIONAL LOGIT MODEL PANEL LOGIT MODEL (RANDOM EFFECTS MODEL) Simplified notation!!!
For a sequence of outcomes for the ith case, the basic random effects model has the integrated (or marginal likelihood) given by the equation.
The random effects model extends the pooled cross-sectional model to include a case-specific random error term this helps to account for residual heterogeneity.
Davies and Pickles (1985) have demonstrated that the failure to explicitly model the effects of residual heterogeneity may cause severe bias in parameter estimates. Using longitudinal data the effects of omitted explanatory variables can be overtly accounted for within the statistical model. This greatly improves the accuracy of the estimated effects of the explanatory variables.
An simple example – Davies, Elias & Penn (1992) The relationship between a husband’s unemployment and his wife’s participation in the labour force
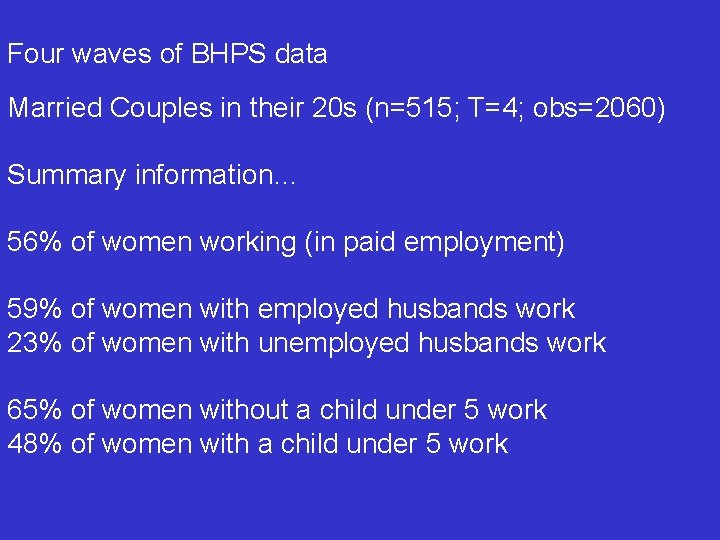
Four waves of BHPS data Married Couples in their 20 s (n=515; T=4; obs=2060) Summary information… 56% of women working (in paid employment) 59% of women with employed husbands work 23% of women with unemployed husbands work 65% of women without a child under 5 work 48% of women with a child under 5 work
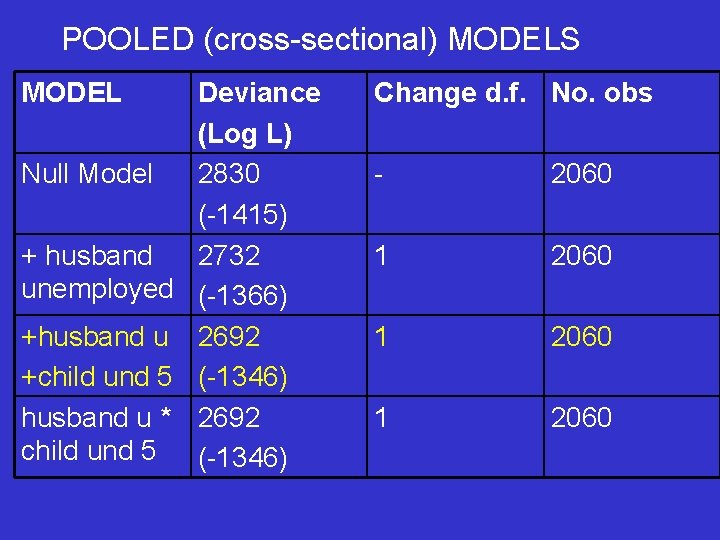
POOLED (cross-sectional) MODELS MODEL Deviance (Log L) Null Model 2830 (-1415) + husband 2732 unemployed (-1366) +husband u 2692 +child und 5 (-1346) husband u * 2692 child und 5 (-1346) Change d. f. No. obs - 2060 1 2060
First glimpse at STATA • Models for panel data • STATA – unhelpfully calls this ‘crosssectional time-series’ • xt commands suite
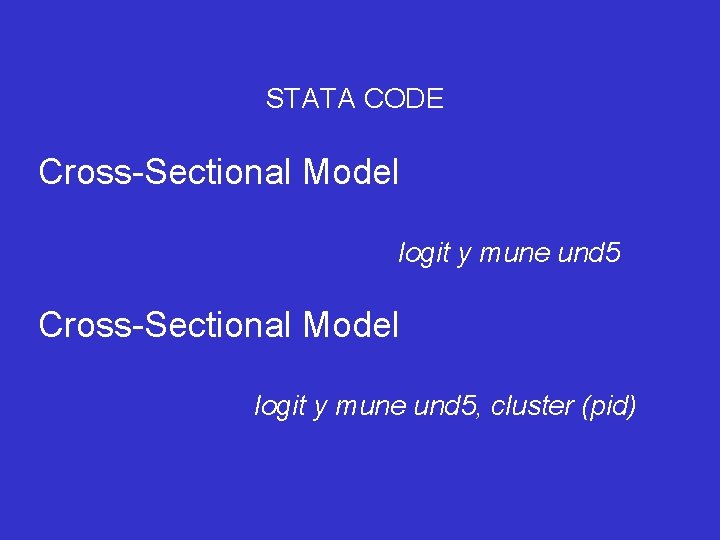
STATA CODE Cross-Sectional Model logit y mune und 5, cluster (pid)
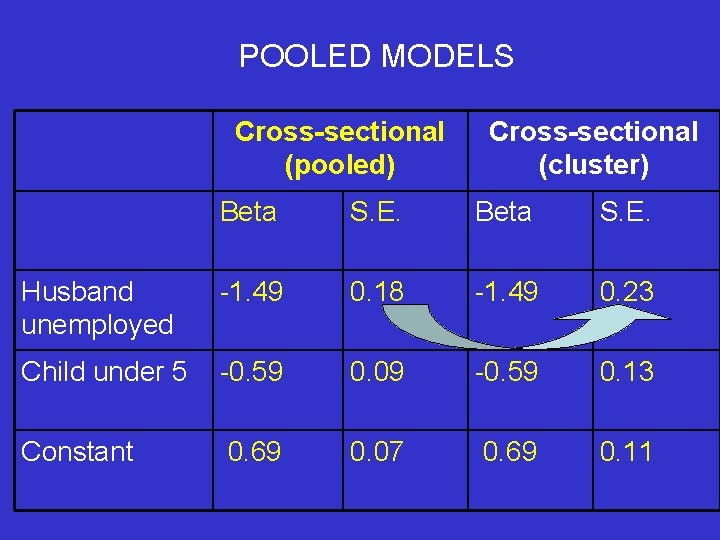
POOLED MODELS Cross-sectional (pooled) Cross-sectional (cluster) Beta S. E. Husband unemployed -1. 49 0. 18 -1. 49 0. 23 Child under 5 -0. 59 0. 09 -0. 59 0. 13 Constant 0. 69 0. 07 0. 69 0. 11
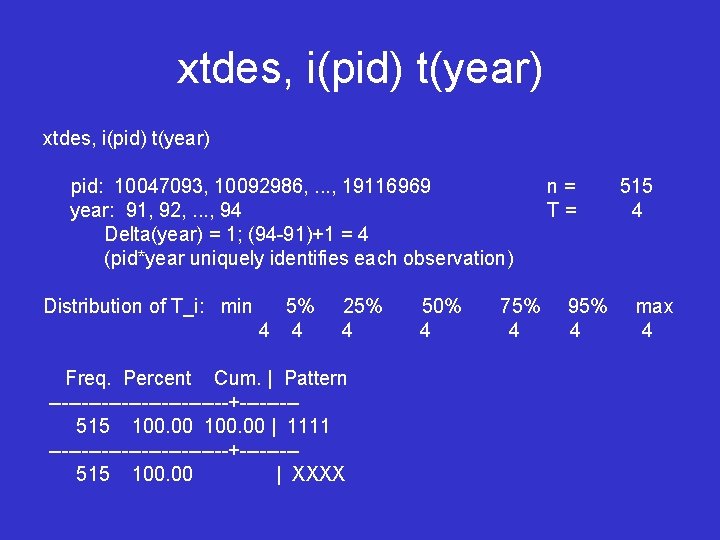
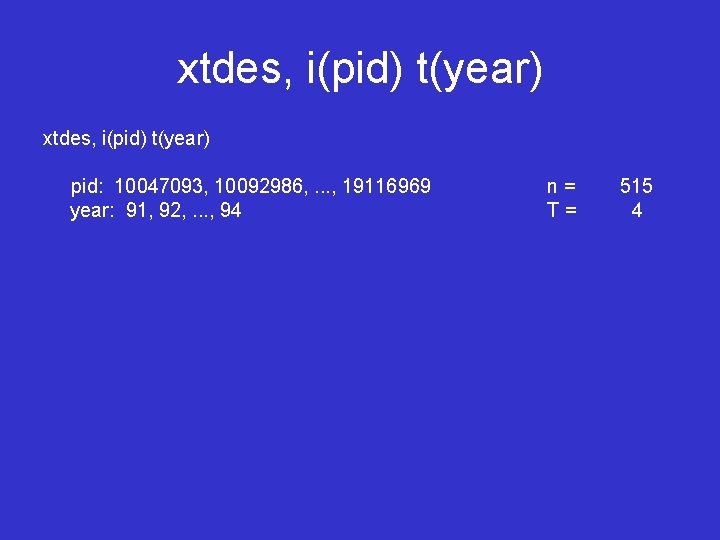
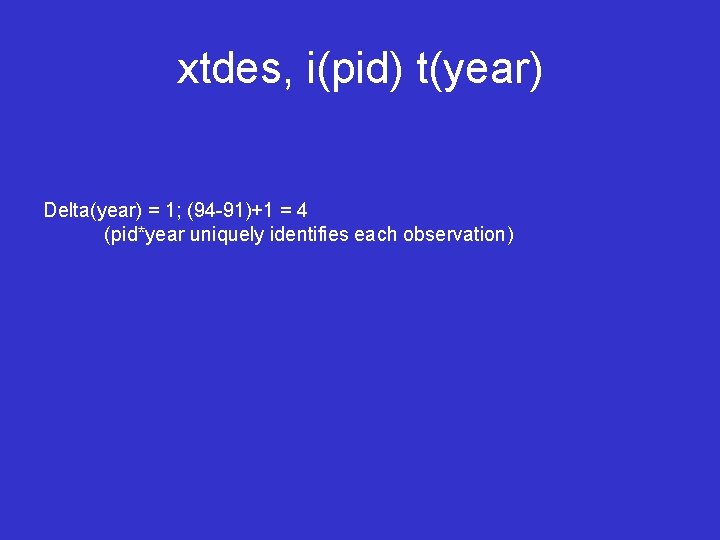
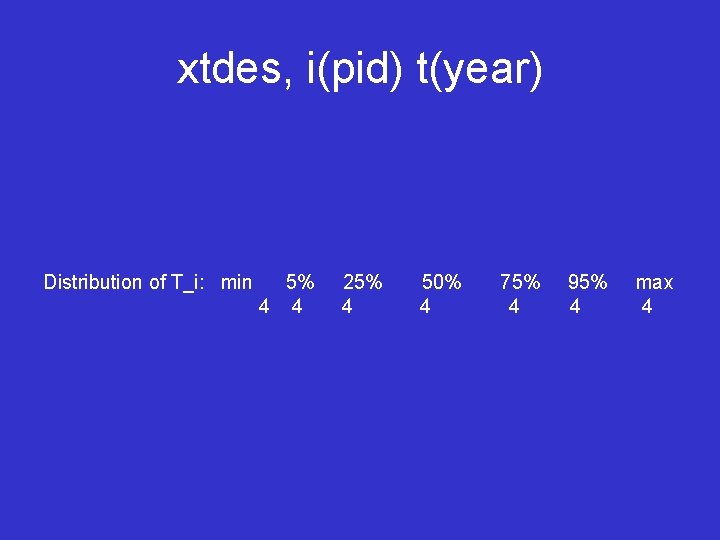
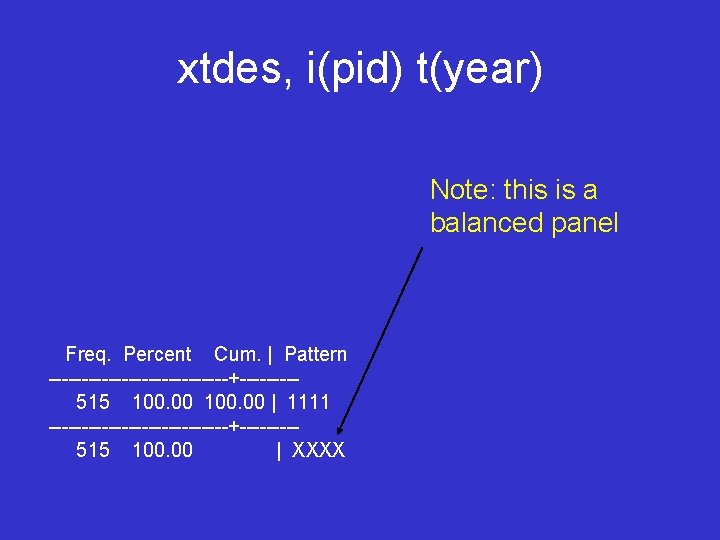
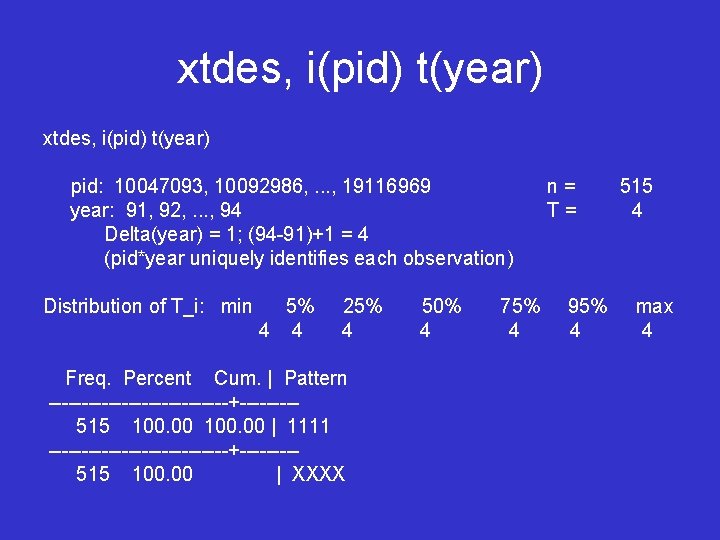
xtdes, i(pid) t(year) pid: 10047093, 10092986, . . . , 19116969 year: 91, 92, . . . , 94 Delta(year) = 1; (94 -91)+1 = 4 (pid*year uniquely identifies each observation) Distribution of T_i: min 5% 4 4 25% 4 Freq. Percent Cum. | Pattern --------------+----515 100. 00 | 1111 --------------+----515 100. 00 | XXXX 50% 4 75% 4 n= T= 95% 4 515 4 max 4
xtdes, i(pid) t(year) pid: 10047093, 10092986, . . . , 19116969 year: 91, 92, . . . , 94 n= T= 515 4
xtdes, i(pid) t(year) Delta(year) = 1; (94 -91)+1 = 4 (pid*year uniquely identifies each observation)
xtdes, i(pid) t(year) Distribution of T_i: min 5% 4 4 25% 4 50% 4 75% 4 95% 4 max 4
xtdes, i(pid) t(year) Note: this is a balanced panel Freq. Percent Cum. | Pattern --------------+----515 100. 00 | 1111 --------------+----515 100. 00 | XXXX
xtdes, i(pid) t(year) pid: 10047093, 10092986, . . . , 19116969 year: 91, 92, . . . , 94 Delta(year) = 1; (94 -91)+1 = 4 (pid*year uniquely identifies each observation) Distribution of T_i: min 5% 4 4 25% 4 Freq. Percent Cum. | Pattern --------------+----515 100. 00 | 1111 --------------+----515 100. 00 | XXXX 50% 4 75% 4 n= T= 95% 4 515 4 max 4
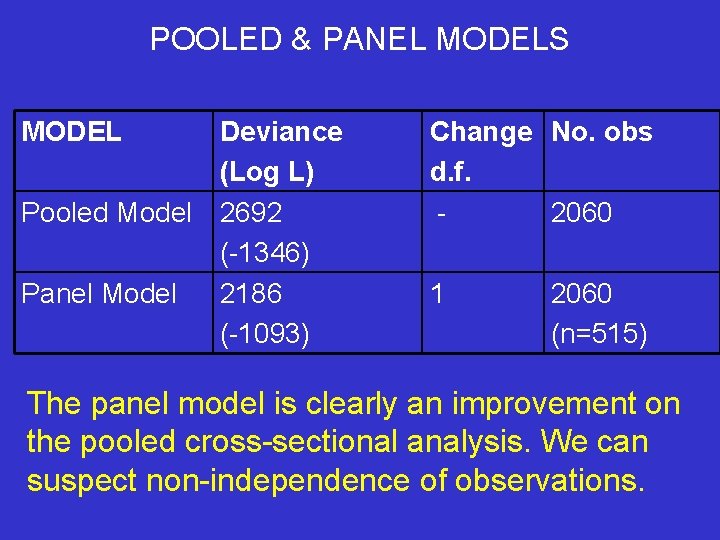
POOLED & PANEL MODELS MODEL Deviance (Log L) Pooled Model 2692 (-1346) Panel Model 2186 (-1093) Change No. obs d. f. 2060 1 2060 (n=515) The panel model is clearly an improvement on the pooled cross-sectional analysis. We can suspect non-independence of observations.
FURTHER - EXPLORATION
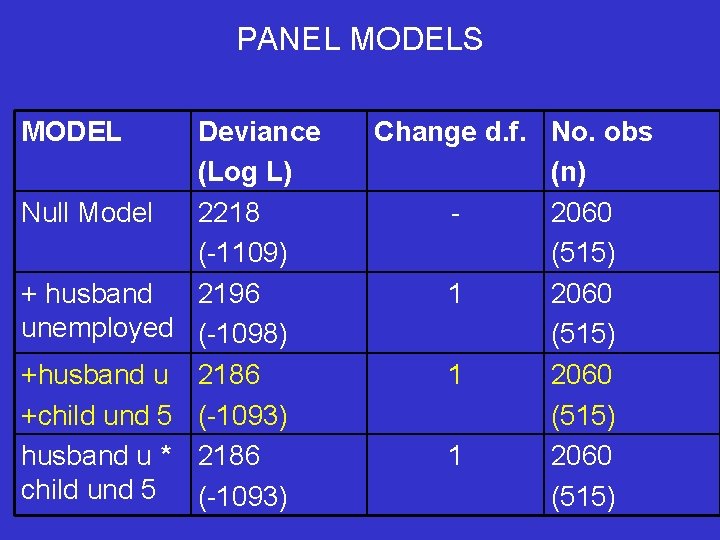
PANEL MODELS MODEL Deviance (Log L) Null Model 2218 (-1109) + husband 2196 unemployed (-1098) +husband u 2186 +child und 5 (-1093) husband u * 2186 child und 5 (-1093) Change d. f. No. obs (n) 2060 (515) 1 2060 (515)
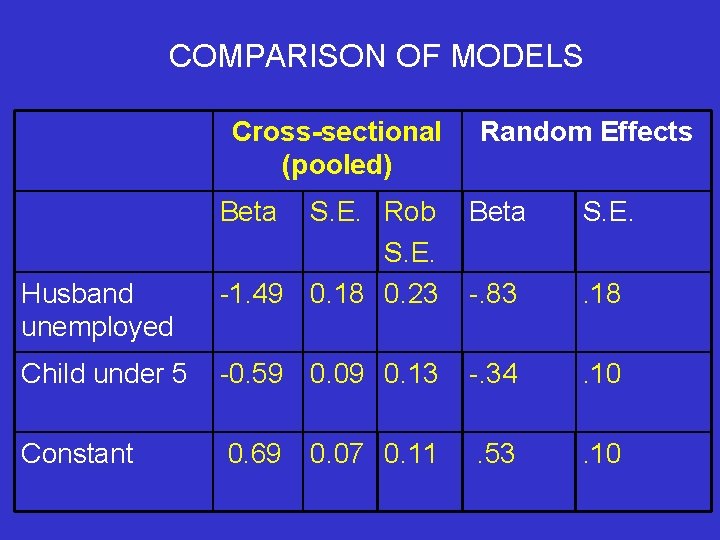
COMPARISON OF MODELS Cross-sectional (pooled) Beta Random Effects S. E. Rob S. E. -1. 49 0. 18 0. 23 Beta S. E. -. 83 . 18 Child under 5 -0. 59 0. 09 0. 13 -. 34 . 10 Constant 0. 69 . 53 . 10 Husband unemployed 0. 07 0. 11
STATA OUTPUT
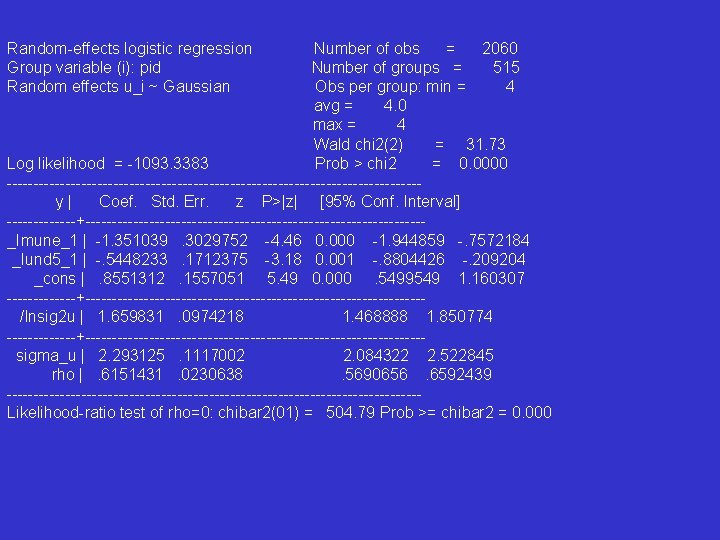
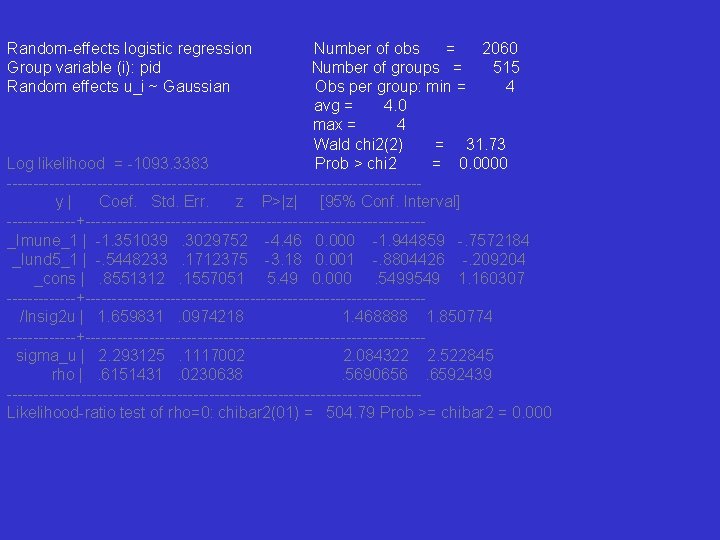
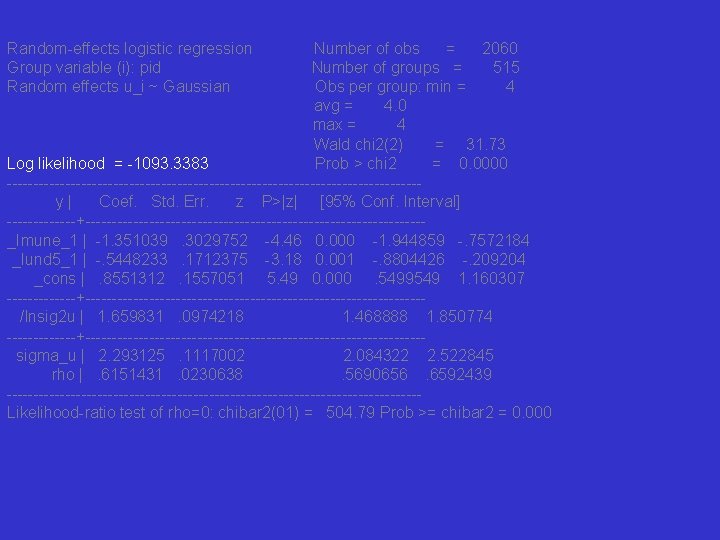
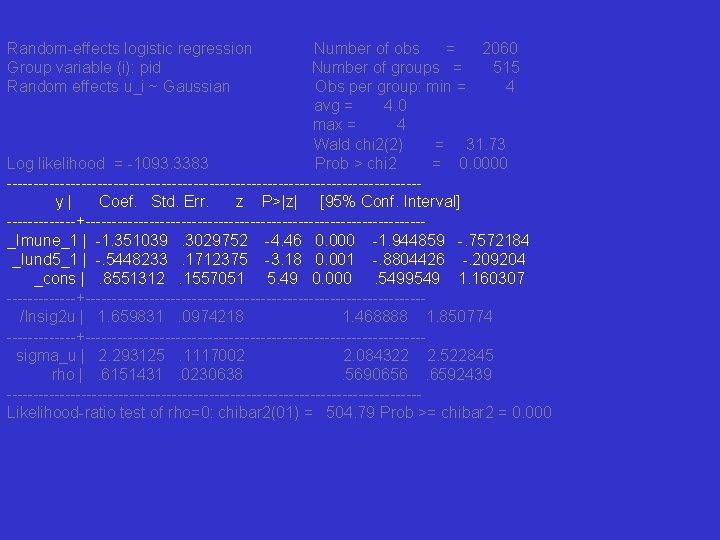
Random-effects logistic regression Group variable (i): pid Random effects u_i ~ Gaussian Number of obs = 2060 Number of groups = 515 Obs per group: min = 4 avg = 4. 0 max = 4 Wald chi 2(2) = 31. 73 Log likelihood = -1093. 3383 Prob > chi 2 = 0. 0000 ---------------------------------------y| Coef. Std. Err. z P>|z| [95% Conf. Interval] -------+--------------------------------_Imune_1 | -1. 351039. 3029752 -4. 46 0. 000 -1. 944859 -. 7572184 _Iund 5_1 | -. 5448233. 1712375 -3. 18 0. 001 -. 8804426 -. 209204 _cons |. 8551312. 1557051 5. 49 0. 000. 5499549 1. 160307 -------+--------------------------------/lnsig 2 u | 1. 659831. 0974218 1. 468888 1. 850774 -------+--------------------------------sigma_u | 2. 293125. 1117002 2. 084322 2. 522845 rho |. 6151431. 0230638. 5690656. 6592439 ---------------------------------------Likelihood-ratio test of rho=0: chibar 2(01) = 504. 79 Prob >= chibar 2 = 0. 000
Random-effects logistic regression Group variable (i): pid Random effects u_i ~ Gaussian Number of obs = 2060 Number of groups = 515 Obs per group: min = 4 avg = 4. 0 max = 4 Wald chi 2(2) = 31. 73 Log likelihood = -1093. 3383 Prob > chi 2 = 0. 0000 ---------------------------------------y| Coef. Std. Err. z P>|z| [95% Conf. Interval] -------+--------------------------------_Imune_1 | -1. 351039. 3029752 -4. 46 0. 000 -1. 944859 -. 7572184 _Iund 5_1 | -. 5448233. 1712375 -3. 18 0. 001 -. 8804426 -. 209204 _cons |. 8551312. 1557051 5. 49 0. 000. 5499549 1. 160307 -------+--------------------------------/lnsig 2 u | 1. 659831. 0974218 1. 468888 1. 850774 -------+--------------------------------sigma_u | 2. 293125. 1117002 2. 084322 2. 522845 rho |. 6151431. 0230638. 5690656. 6592439 ---------------------------------------Likelihood-ratio test of rho=0: chibar 2(01) = 504. 79 Prob >= chibar 2 = 0. 000
Random-effects logistic regression Group variable (i): pid Random effects u_i ~ Gaussian Number of obs = 2060 Number of groups = 515 Obs per group: min = 4 avg = 4. 0 max = 4 Wald chi 2(2) = 31. 73 Log likelihood = -1093. 3383 Prob > chi 2 = 0. 0000 ---------------------------------------y| Coef. Std. Err. z P>|z| [95% Conf. Interval] -------+--------------------------------_Imune_1 | -1. 351039. 3029752 -4. 46 0. 000 -1. 944859 -. 7572184 _Iund 5_1 | -. 5448233. 1712375 -3. 18 0. 001 -. 8804426 -. 209204 _cons |. 8551312. 1557051 5. 49 0. 000. 5499549 1. 160307 -------+--------------------------------/lnsig 2 u | 1. 659831. 0974218 1. 468888 1. 850774 -------+--------------------------------sigma_u | 2. 293125. 1117002 2. 084322 2. 522845 rho |. 6151431. 0230638. 5690656. 6592439 ---------------------------------------Likelihood-ratio test of rho=0: chibar 2(01) = 504. 79 Prob >= chibar 2 = 0. 000
Random-effects logistic regression Group variable (i): pid Random effects u_i ~ Gaussian Number of obs = 2060 Number of groups = 515 Obs per group: min = 4 avg = 4. 0 max = 4 Wald chi 2(2) = 31. 73 Log likelihood = -1093. 3383 Prob > chi 2 = 0. 0000 ---------------------------------------y| Coef. Std. Err. z P>|z| [95% Conf. Interval] -------+--------------------------------_Imune_1 | -1. 351039. 3029752 -4. 46 0. 000 -1. 944859 -. 7572184 _Iund 5_1 | -. 5448233. 1712375 -3. 18 0. 001 -. 8804426 -. 209204 _cons |. 8551312. 1557051 5. 49 0. 000. 5499549 1. 160307 -------+--------------------------------/lnsig 2 u | 1. 659831. 0974218 1. 468888 1. 850774 -------+--------------------------------sigma_u | 2. 293125. 1117002 2. 084322 2. 522845 rho |. 6151431. 0230638. 5690656. 6592439 ---------------------------------------Likelihood-ratio test of rho=0: chibar 2(01) = 504. 79 Prob >= chibar 2 = 0. 000
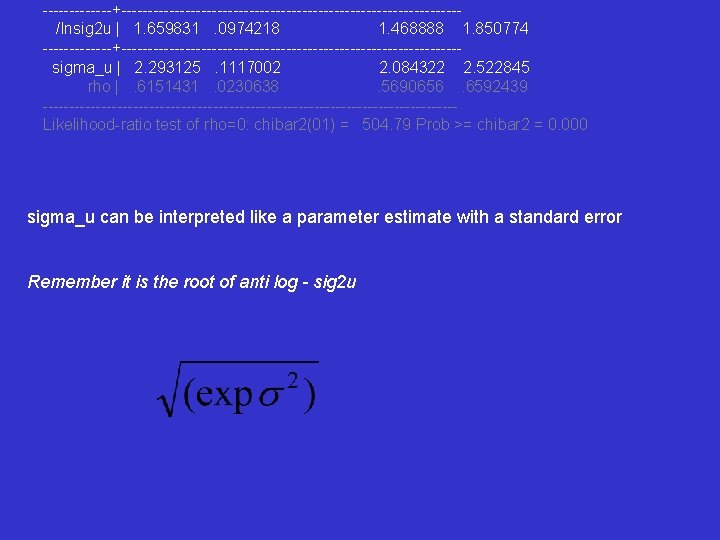
-------+--------------------------------/lnsig 2 u | 1. 659831. 0974218 1. 468888 1. 850774 -------+--------------------------------sigma_u | 2. 293125. 1117002 2. 084322 2. 522845 rho |. 6151431. 0230638. 5690656. 6592439 ---------------------------------------Likelihood-ratio test of rho=0: chibar 2(01) = 504. 79 Prob >= chibar 2 = 0. 000 sigma_u can be interpreted like a parameter estimate with a standard error Remember it is the root of anti log - sig 2 u
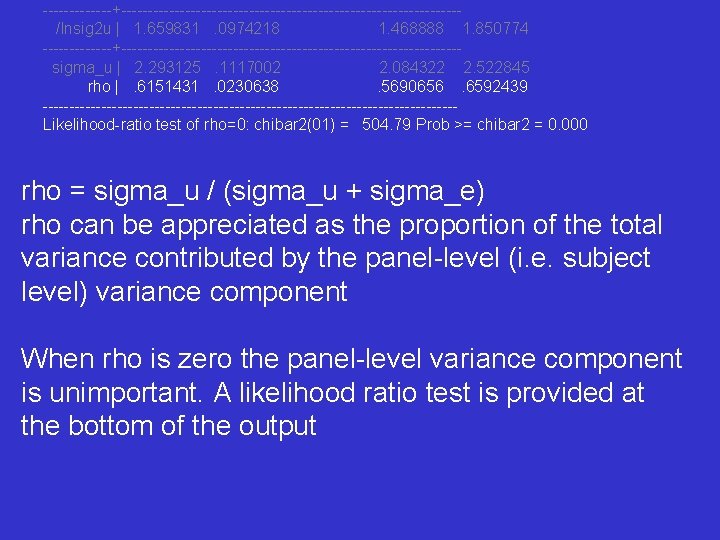
-------+--------------------------------/lnsig 2 u | 1. 659831. 0974218 1. 468888 1. 850774 -------+--------------------------------sigma_u | 2. 293125. 1117002 2. 084322 2. 522845 rho |. 6151431. 0230638. 5690656. 6592439 ---------------------------------------Likelihood-ratio test of rho=0: chibar 2(01) = 504. 79 Prob >= chibar 2 = 0. 000 rho = sigma_u / (sigma_u + sigma_e) rho can be appreciated as the proportion of the total variance contributed by the panel-level (i. e. subject level) variance component When rho is zero the panel-level variance component is unimportant. A likelihood ratio test is provided at the bottom of the output
You can think of rho as being the (analogous) equivalent of the intra-cluster correlation (icc) in a multilevel model SUBJECT Wave A Wave B Wave C Wave D Wave E REPEATED MEASURES / OBSERVATIONS
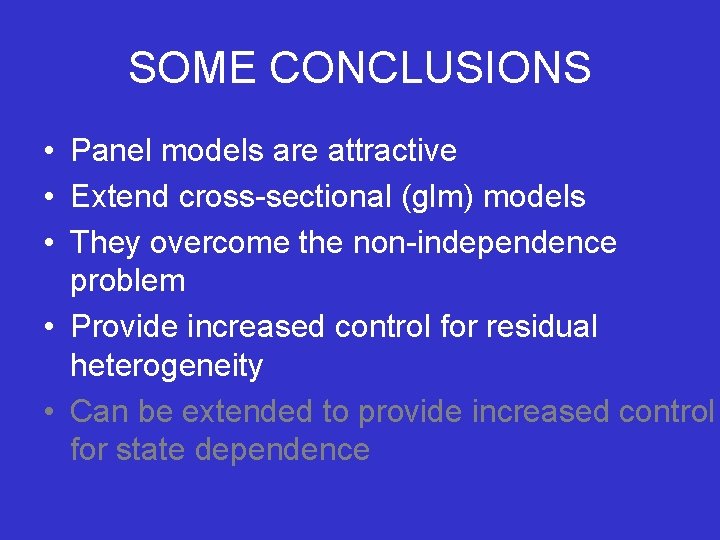
SOME CONCLUSIONS • Panel models are attractive • Extend cross-sectional (glm) models • They overcome the non-independence problem • Provide increased control for residual heterogeneity • Can be extended to provide increased control for state dependence
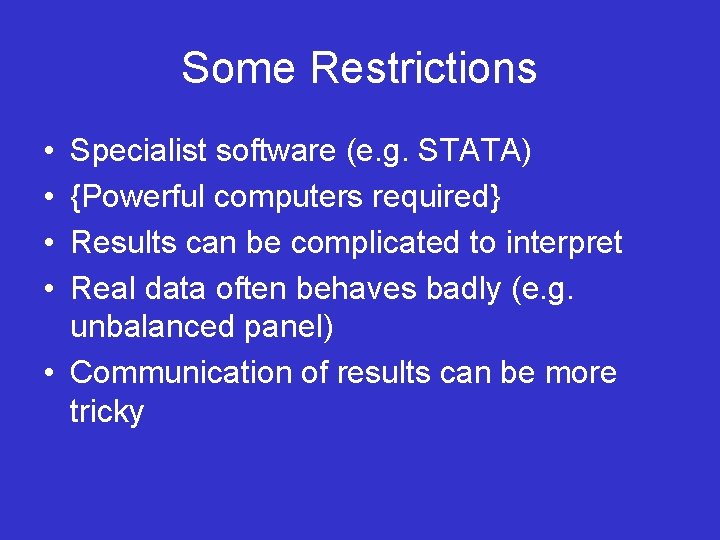
Some Restrictions • • Specialist software (e. g. STATA) {Powerful computers required} Results can be complicated to interpret Real data often behaves badly (e. g. unbalanced panel) • Communication of results can be more tricky