
Quantitative Longitudinal Data Paul Lambert and Vernon Gayle
Quantitative Longitudinal Data Paul Lambert and Vernon Gayle Stirling University Prepared for “Longitudinal Data Analysis for Social Science Researchers: Introductory Seminar”, Stirling University, 2 -6 th September 2006
Five Approaches to Longitudinal Data Analysis http: //www. longitudinal. stir. ac. uk/ Introducing quantitative longitudinal data analysis 1. Repeated cross-sections 2. Panel datasets 3. Cohort studies 4. Event history datasets 5. Time series analyses April 2006: LDA 2
Quantitative longitudinal research in the social sciences • Survey resources – Micro-data (individuals, households, . . ) – Macro-data (aggregate summary for year, country. . ) Data analysis is used to give a parsimonious summary of patterns of relations between variables in the survey dataset • Longitudinal – Research which studies the temporal context of processes • Data concerned with more than one time point • Repeated measures over time April 2006: LDA 3
Motivations for Qn. LR • Focus on time / durations Ø Trends in repeated information over time Ø Substantive role of durations (e. g. , Unemployment) • Focus on change / stability • Focus on the life course Ø Distinguish age, period and cohort effects Ø Career trajectories / life course sequences • Getting the ‘full picture’ Ø Causality and residual heterogeneity Ø Examining multivariate relationships Ø Representative conclusions April 2006: LDA 4
• Specific features to Qn. LR – Tends to use ‘large and complex’ secondary data Ø Multiple points of measurement Ø Complex (hierarchical) survey structure / relations Ø Complex variable measures / survey samples Ø Secondary data analysis positives: other users; cheap access; range of topics available – Particular techniques of data analysis – Algebra – Computer software manuals – Spectacles April 2006: LDA 5
Some drawbacks • Dataset expense • mostly secondary; limited access to some data (cf. disclosure risk) • Data analysis • software issues (complexity of some methods) • Data management • complex file & variable management requires training and skills of good practice April 2006: LDA 6
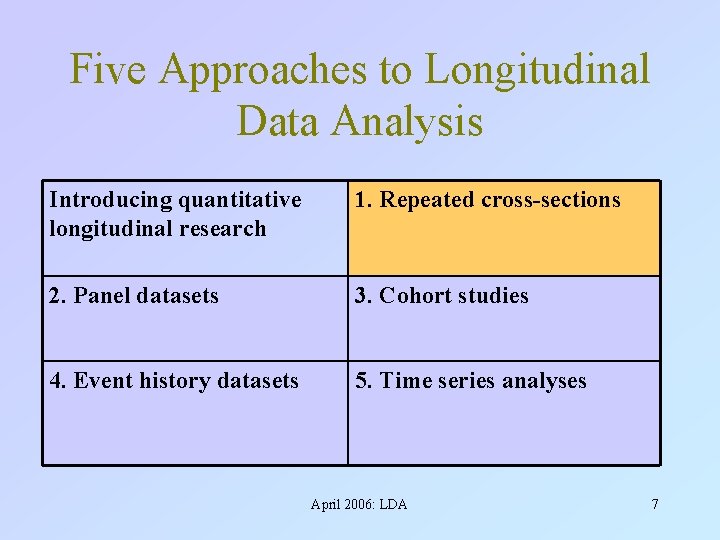
Five Approaches to Longitudinal Data Analysis Introducing quantitative longitudinal research 1. Repeated cross-sections 2. Panel datasets 3. Cohort studies 4. Event history datasets 5. Time series analyses April 2006: LDA 7
Repeated Cross-sections • By far the most widely used longitudinal analysis in contemporary social sciences Whole surveys, with same variables, repeated at different time points and Same information extracted from different surveys from different time points April 2006: LDA 8
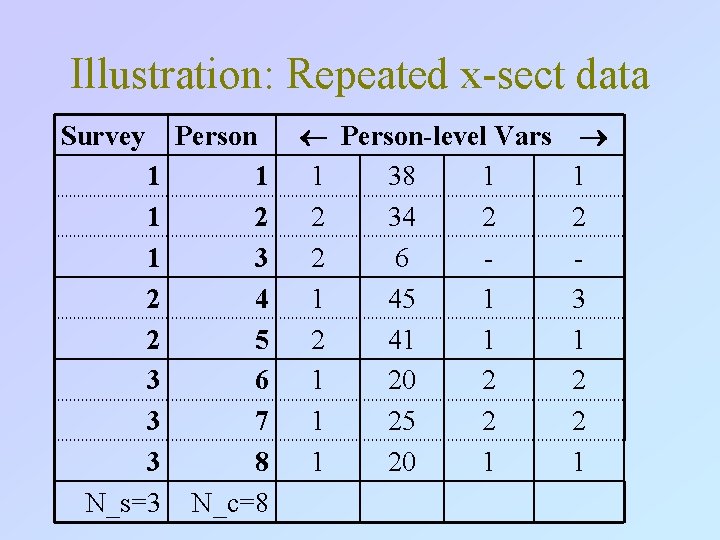
Illustration: Repeated x-sect data Survey 1 1 1 2 2 3 3 3 N_s=3 Person 1 2 3 4 5 6 7 8 N_c=8 Person-level Vars 1 38 1 2 34 2 2 6 1 45 1 2 41 1 1 20 2 1 25 2 1 20 1 1 2 3 1 2 2 1
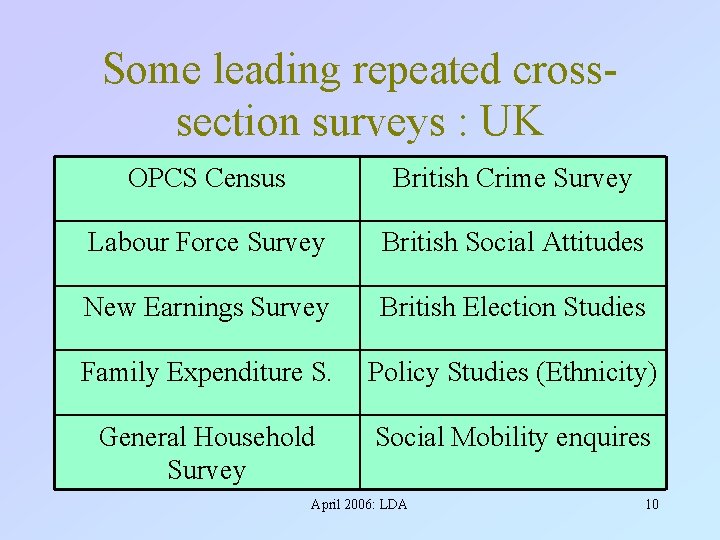
Some leading repeated crosssection surveys : UK OPCS Census British Crime Survey Labour Force Survey British Social Attitudes New Earnings Survey British Election Studies Family Expenditure S. Policy Studies (Ethnicity) General Household Survey Social Mobility enquires April 2006: LDA 10
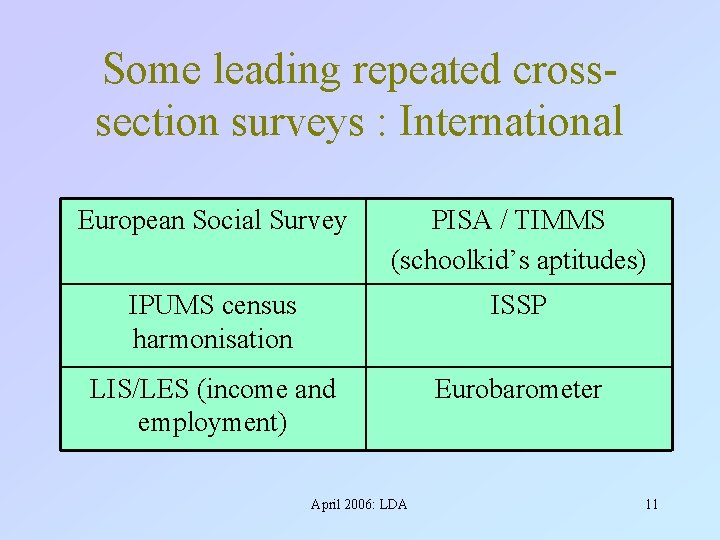
Some leading repeated crosssection surveys : International European Social Survey PISA / TIMMS (schoolkid’s aptitudes) IPUMS census harmonisation ISSP LIS/LES (income and employment) Eurobarometer April 2006: LDA 11
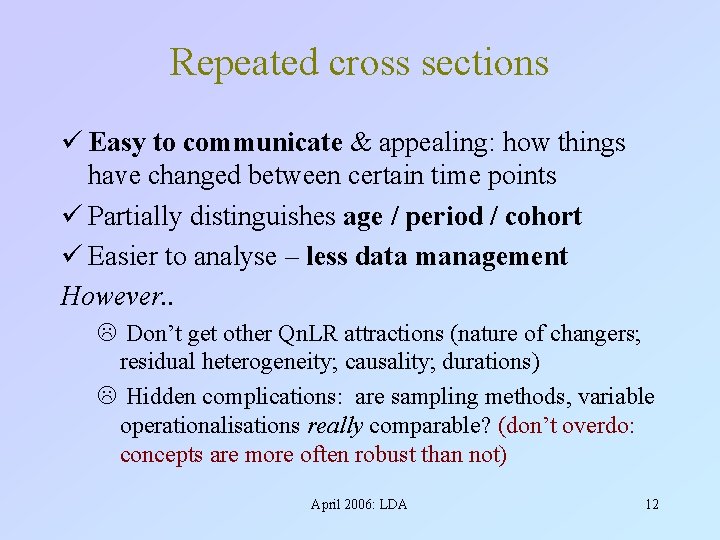
Repeated cross sections ü Easy to communicate & appealing: how things have changed between certain time points ü Partially distinguishes age / period / cohort ü Easier to analyse – less data management However. . L Don’t get other Qn. LR attractions (nature of changers; residual heterogeneity; causality; durations) L Hidden complications: are sampling methods, variable operationalisations really comparable? (don’t overdo: concepts are more often robust than not) April 2006: LDA 12
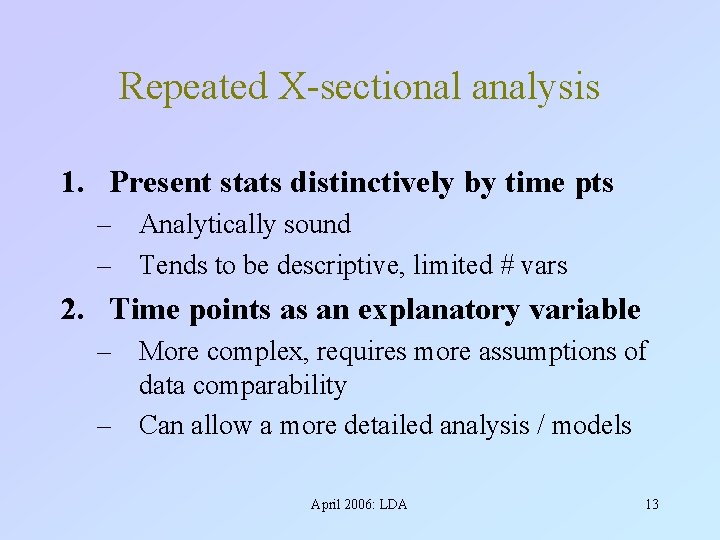
Repeated X-sectional analysis 1. Present stats distinctively by time pts – Analytically sound – Tends to be descriptive, limited # vars 2. Time points as an explanatory variable – More complex, requires more assumptions of data comparability – Can allow a more detailed analysis / models April 2006: LDA 13
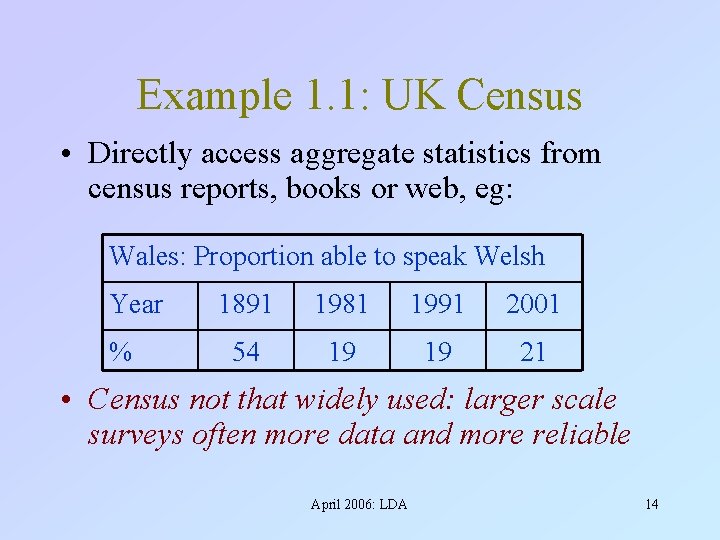
Example 1. 1: UK Census • Directly access aggregate statistics from census reports, books or web, eg: Wales: Proportion able to speak Welsh Year % 1891 1981 1991 2001 54 19 19 21 • Census not that widely used: larger scale surveys often more data and more reliable April 2006: LDA 14
Eg 1. 2: UK Labour Force Survey LFS: free download from UK data archive http: //www. data-archive. ac. uk/ Same questions asked yearly / quarterly April 2006: LDA 15
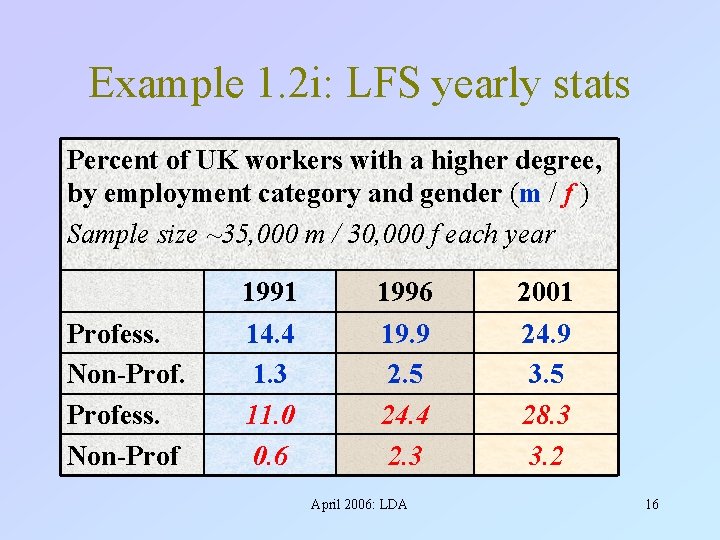
Example 1. 2 i: LFS yearly stats Percent of UK workers with a higher degree, by employment category and gender (m / f ) Sample size ~35, 000 m / 30, 000 f each year Profess. Non-Prof 1991 14. 4 1. 3 11. 0 0. 6 1996 19. 9 2. 5 24. 4 2. 3 April 2006: LDA 2001 24. 9 3. 5 28. 3 3. 2 16
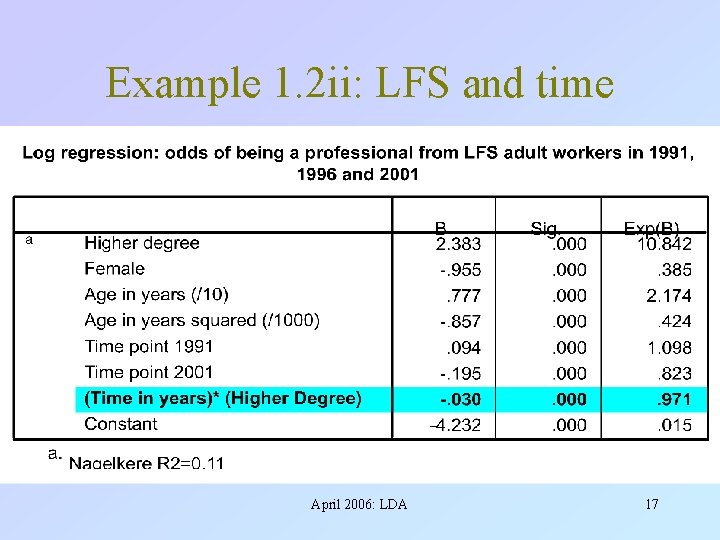
Example 1. 2 ii: LFS and time April 2006: LDA 17
Five Approaches to Longitudinal Data Analysis Introducing quantitative longitudinal research 1. Repeated cross-sections 2. Panel datasets 3. Cohort studies 4. Event history datasets 5. Time series analyses April 2006: LDA 18
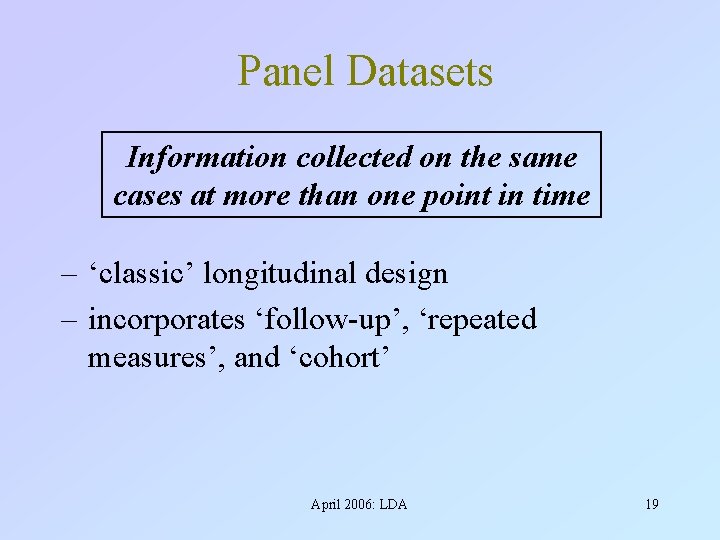
Panel Datasets Information collected on the same cases at more than one point in time – ‘classic’ longitudinal design – incorporates ‘follow-up’, ‘repeated measures’, and ‘cohort’ April 2006: LDA 19
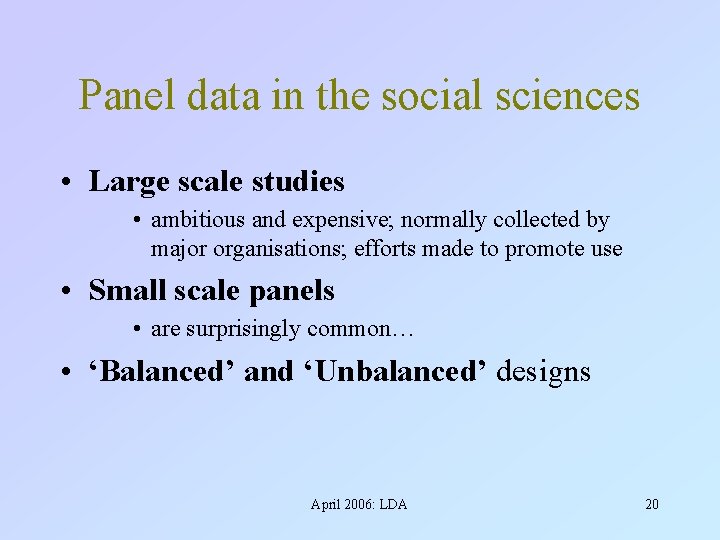
Panel data in the social sciences • Large scale studies • ambitious and expensive; normally collected by major organisations; efforts made to promote use • Small scale panels • are surprisingly common… • ‘Balanced’ and ‘Unbalanced’ designs April 2006: LDA 20
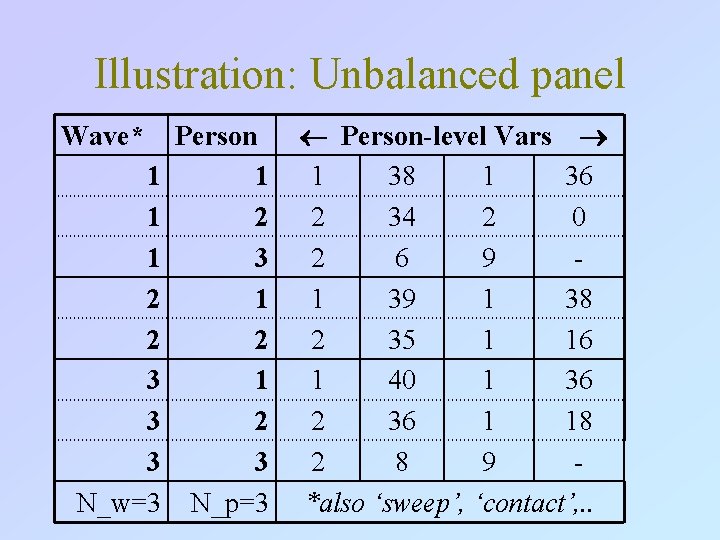
Illustration: Unbalanced panel Wave* 1 1 1 2 2 3 3 3 N_w=3 Person 1 2 3 N_p=3 Person-level Vars 1 38 1 36 2 34 2 0 2 6 9 1 38 2 35 1 16 1 40 1 36 2 36 1 18 2 8 9 *also ‘sweep’, ‘contact’, . .
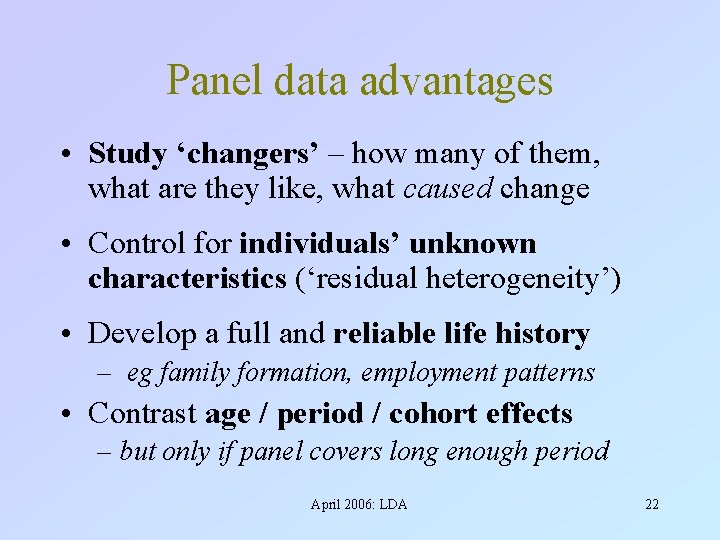
Panel data advantages • Study ‘changers’ – how many of them, what are they like, what caused change • Control for individuals’ unknown characteristics (‘residual heterogeneity’) • Develop a full and reliable life history – eg family formation, employment patterns • Contrast age / period / cohort effects – but only if panel covers long enough period April 2006: LDA 22
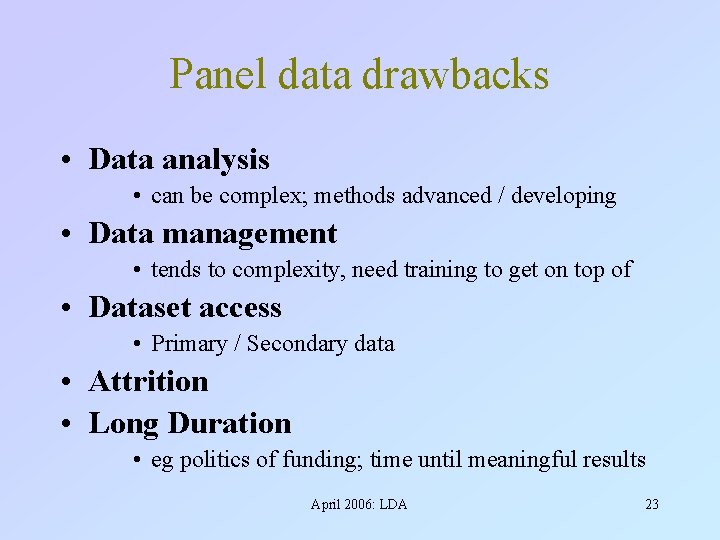
Panel data drawbacks • Data analysis • can be complex; methods advanced / developing • Data management • tends to complexity, need training to get on top of • Dataset access • Primary / Secondary data • Attrition • Long Duration • eg politics of funding; time until meaningful results April 2006: LDA 23
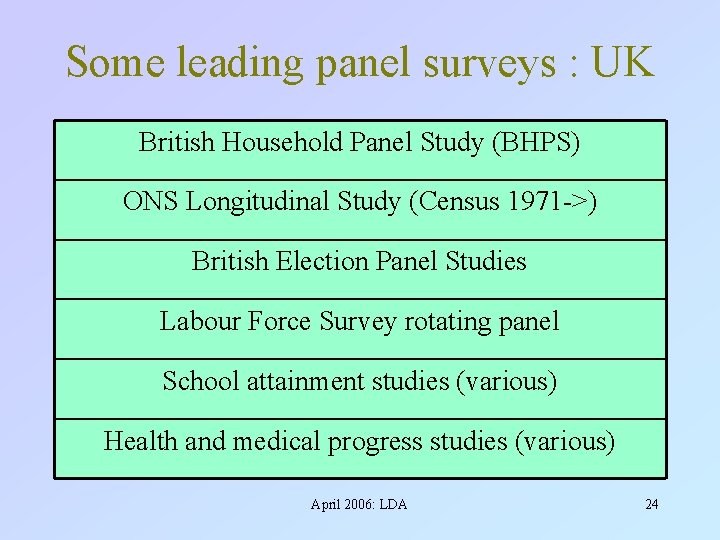
Some leading panel surveys : UK British Household Panel Study (BHPS) ONS Longitudinal Study (Census 1971 ->) British Election Panel Studies Labour Force Survey rotating panel School attainment studies (various) Health and medical progress studies (various) April 2006: LDA 24
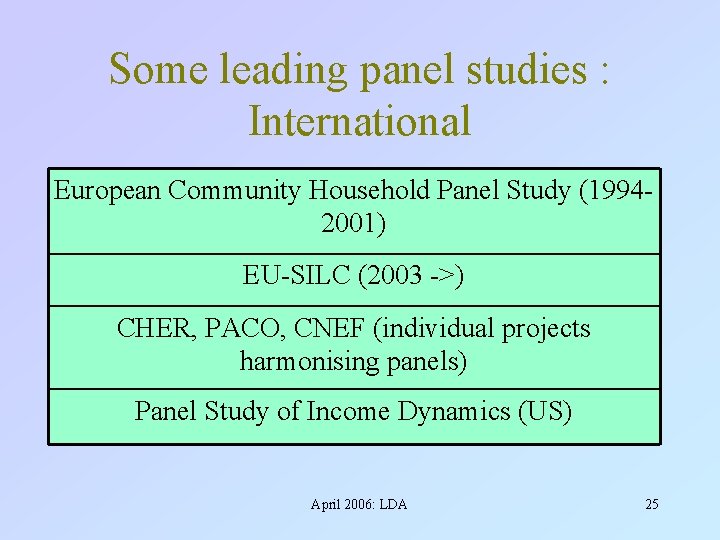
Some leading panel studies : International European Community Household Panel Study (19942001) EU-SILC (2003 ->) CHER, PACO, CNEF (individual projects harmonising panels) Panel Study of Income Dynamics (US) April 2006: LDA 25
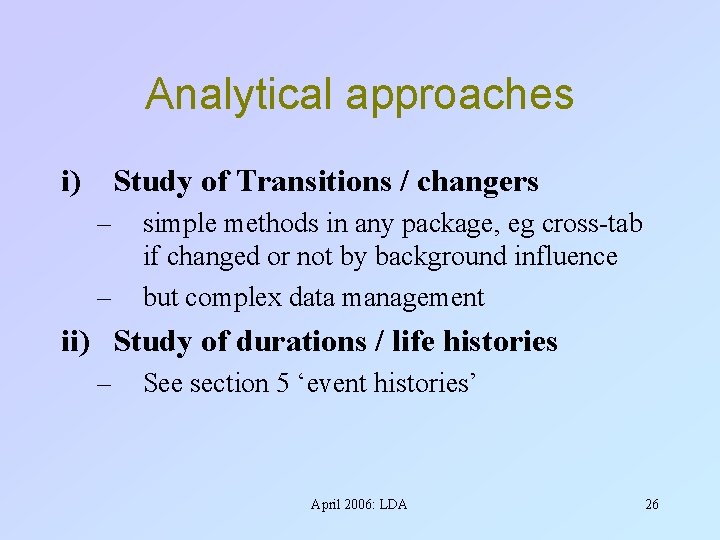
Analytical approaches i) Study of Transitions / changers – – simple methods in any package, eg cross-tab if changed or not by background influence but complex data management ii) Study of durations / life histories – See section 5 ‘event histories’ April 2006: LDA 26
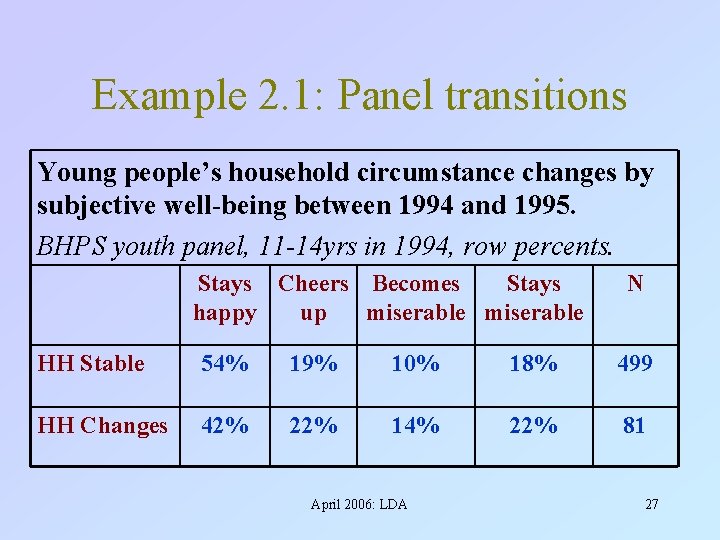
Example 2. 1: Panel transitions Young people’s household circumstance changes by subjective well-being between 1994 and 1995. BHPS youth panel, 11 -14 yrs in 1994, row percents. Stays Cheers Becomes Stays happy up miserable N HH Stable 54% 19% 10% 18% 499 HH Changes 42% 22% 14% 22% 81 April 2006: LDA 27
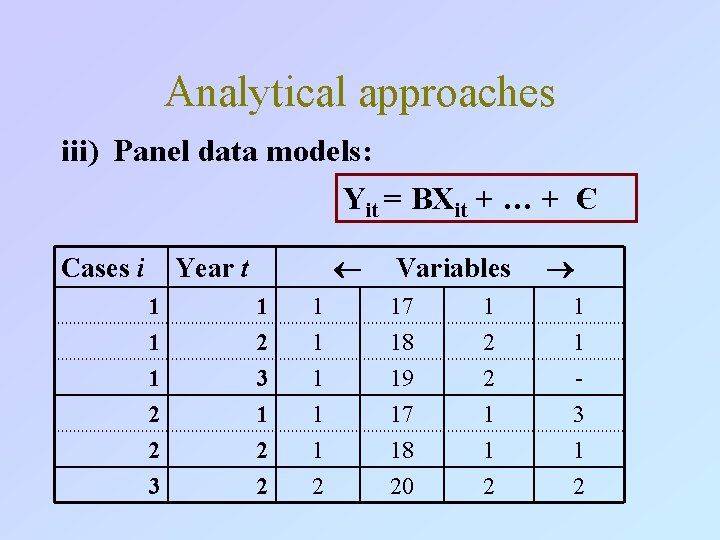
Analytical approaches iii) Panel data models: Yit = ΒXit + … + Є Cases i Year t Variables 1 1 2 3 1 17 18 19 1 2 2 1 1 - 2 2 3 1 2 2 1 1 2 17 18 20 1 1 2 3 1 2
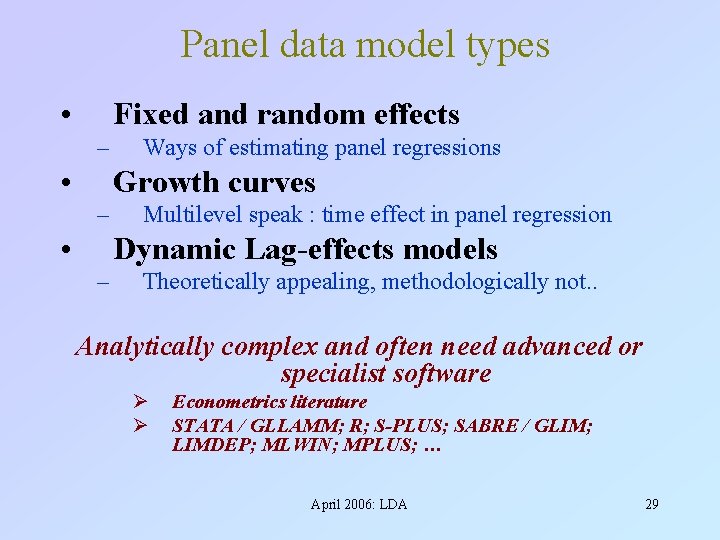
Panel data model types • Fixed and random effects – • Ways of estimating panel regressions Growth curves – • Multilevel speak : time effect in panel regression Dynamic Lag-effects models – Theoretically appealing, methodologically not. . Analytically complex and often need advanced or specialist software Ø Ø Econometrics literature STATA / GLLAMM; R; S-PLUS; SABRE / GLIM; LIMDEP; MLWIN; MPLUS; … April 2006: LDA 29
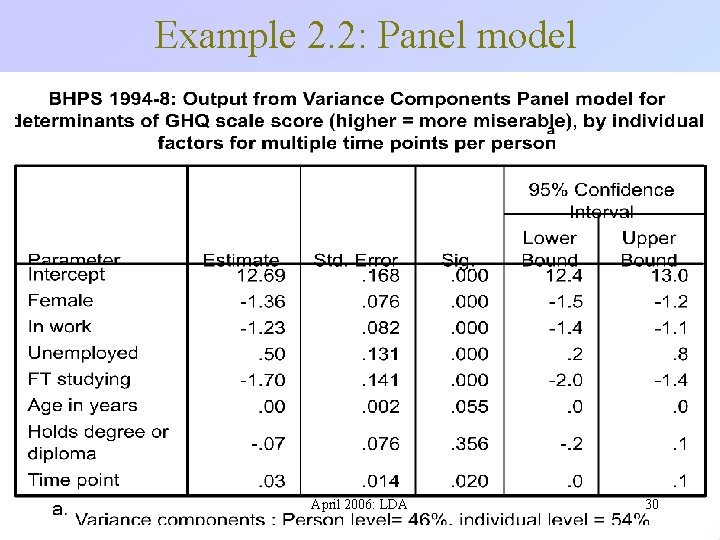
Example 2. 2: Panel model April 2006: LDA 30
Five Approaches to Longitudinal Data Analysis Introducing quantitative longitudinal research 1. Repeated cross-sections 2. Panel datasets 3. Cohort studies 4. Event history datasets 5. Time series analyses April 2006: LDA 31
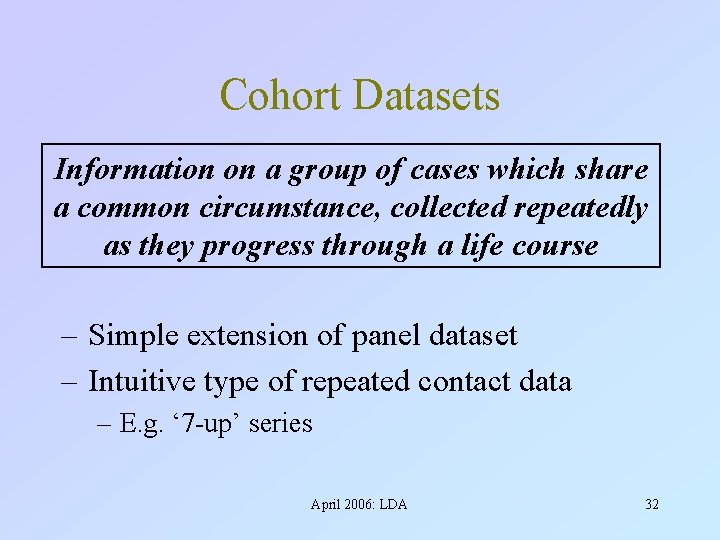
Cohort Datasets Information on a group of cases which share a common circumstance, collected repeatedly as they progress through a life course – Simple extension of panel dataset – Intuitive type of repeated contact data – E. g. ‘ 7 -up’ series April 2006: LDA 32
Cohort data in the social sciences • Circumstances parallel other panel types: ØLarge scale studies ambitious & expensive ØSmall scale cohorts still quite common… v. Attrition problems often more severe v. Considerable study duration problems – have to wait for generations to age April 2006: LDA 33
Cohort data advantages • Study of ‘changers’ • a main focus, looking at how groups of cases develop after a certain point in time • Full and reliable life history • as often covers a very long span • Variety of issues • Topics of relevance can evolve as cohort progresses through lifecourse • Age / period / cohort effects • Better chance of distinguishing (if >1 cohort studied) April 2006: LDA 34
Cohort data drawbacks • • {Data analysis / management demands} Attrition problems more severe than panel Longer Duration Very specific findings – eg only for isolated people of a specific cohort April 2006: LDA 35
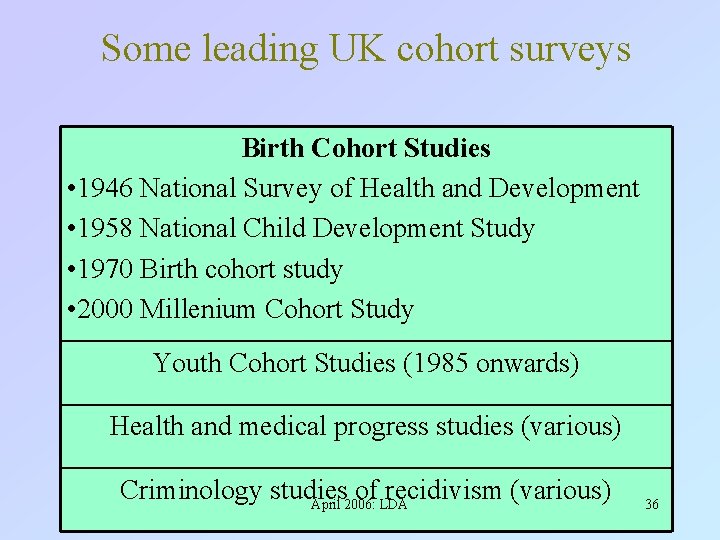
Some leading UK cohort surveys Birth Cohort Studies • 1946 National Survey of Health and Development • 1958 National Child Development Study • 1970 Birth cohort study • 2000 Millenium Cohort Study Youth Cohort Studies (1985 onwards) Health and medical progress studies (various) Criminology studies of recidivism (various) April 2006: LDA 36
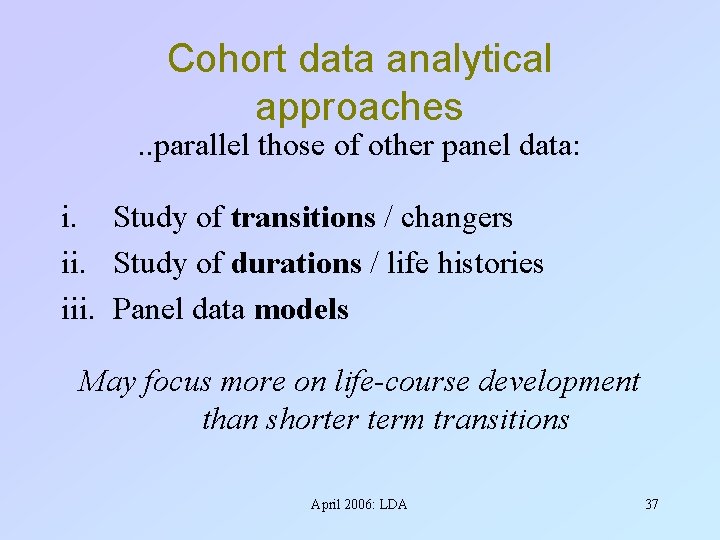
Cohort data analytical approaches . . parallel those of other panel data: i. Study of transitions / changers ii. Study of durations / life histories iii. Panel data models May focus more on life-course development than shorter term transitions April 2006: LDA 37
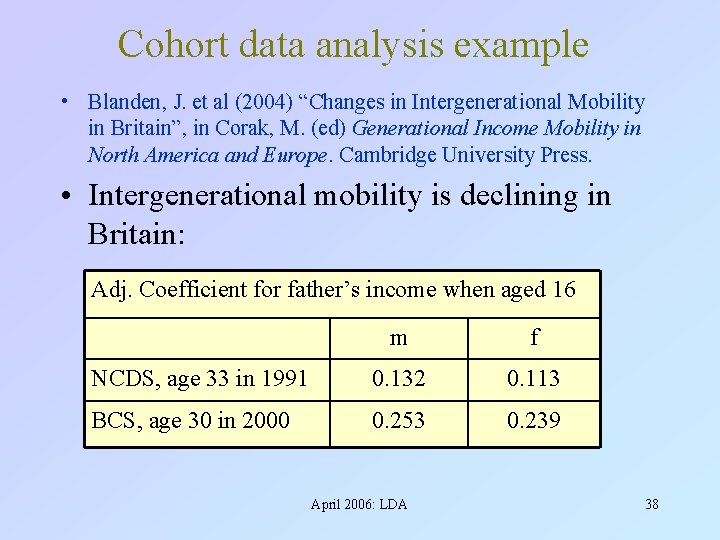
Cohort data analysis example • Blanden, J. et al (2004) “Changes in Intergenerational Mobility in Britain”, in Corak, M. (ed) Generational Income Mobility in North America and Europe. Cambridge University Press. • Intergenerational mobility is declining in Britain: Adj. Coefficient for father’s income when aged 16 m f NCDS, age 33 in 1991 0. 132 0. 113 BCS, age 30 in 2000 0. 253 0. 239 April 2006: LDA 38
. . but with repeated cross-sections. . April 2006: LDA 39
Five Approaches to Longitudinal Data Analysis Introducing quantitative longitudinal research 1. Repeated cross-sections 2. Panel datasets 3. Cohort studies 4. Event history datasets 5. Time series analyses April 2006: LDA 40
Event history data analysis Focus shifts to length of time in a ‘state’ analyses determinants of time in state • Alternative data sources: – Panel / cohort (more reliable) – Retrospective (cheaper, but recall errors) • Aka: ‘Survival data analysis’; ‘Failure time analysis’; ‘hazards’; ‘risks’; . . April 2006: LDA 41
Social Science event histories: • Time to labour market transitions • Time to family formation • Time to recidivism Comment: Data analysis techniques relatively limited, and not suited to complex variates Many event history applications have used quite simplistic variable operationalisations April 2006: LDA 42
Event histories differ: • In form of dataset (cases are spells in time, not individuals) Ø Some complex data management issues • In types of analytical method Ø Many techniques are new or rare, and specialist software may be needed April 2006: LDA 43
Key to event histories is ‘state space’ April 2006: LDA 44

April 2006: LDA 45

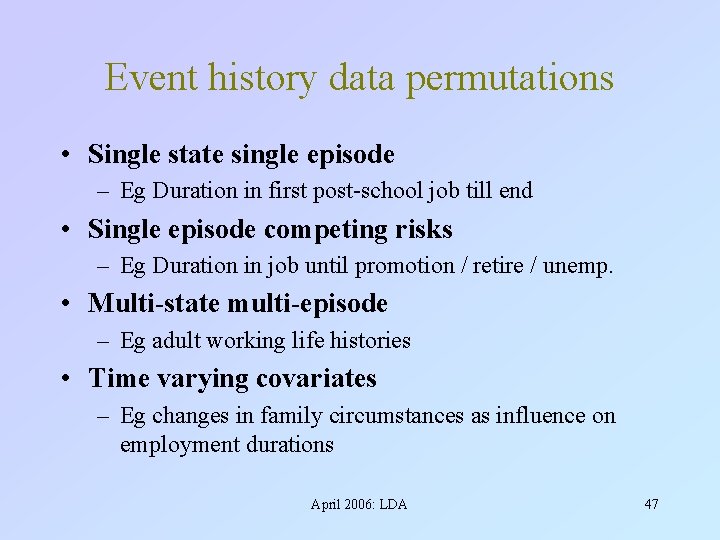
Event history data permutations • Single state single episode – Eg Duration in first post-school job till end • Single episode competing risks – Eg Duration in job until promotion / retire / unemp. • Multi-state multi-episode – Eg adult working life histories • Time varying covariates – Eg changes in family circumstances as influence on employment durations April 2006: LDA 47
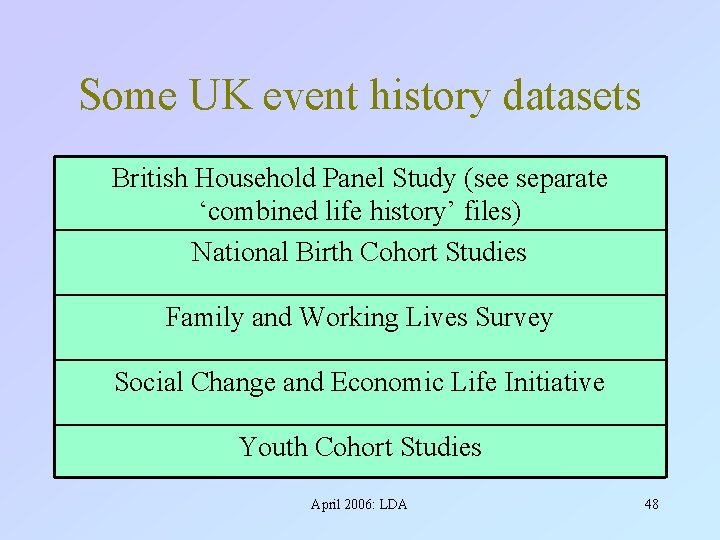
Some UK event history datasets British Household Panel Study (see separate ‘combined life history’ files) National Birth Cohort Studies Family and Working Lives Survey Social Change and Economic Life Initiative Youth Cohort Studies April 2006: LDA 48
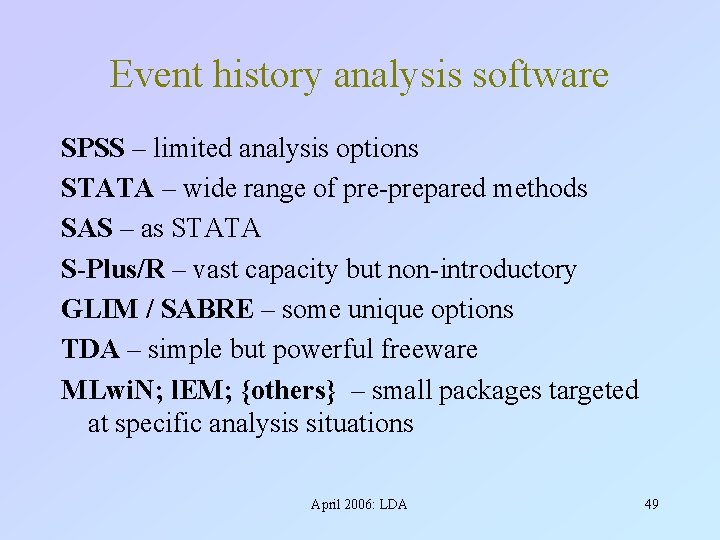
Event history analysis software SPSS – limited analysis options STATA – wide range of pre-prepared methods SAS – as STATA S-Plus/R – vast capacity but non-introductory GLIM / SABRE – some unique options TDA – simple but powerful freeware MLwi. N; l. EM; {others} – small packages targeted at specific analysis situations April 2006: LDA 49
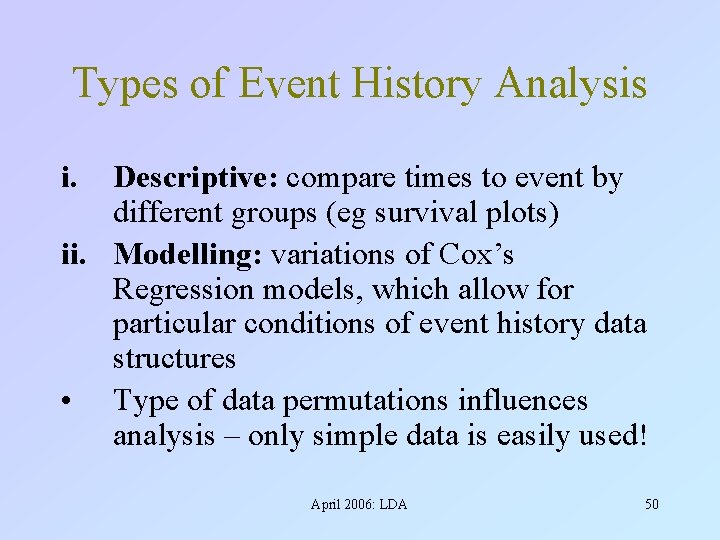
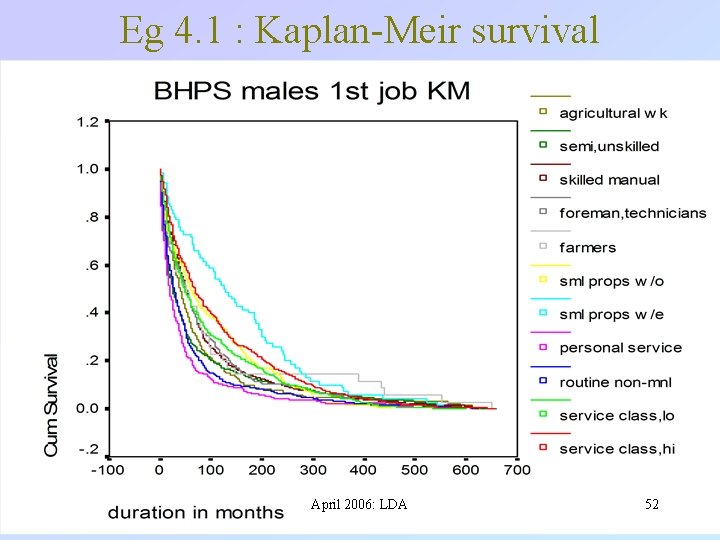
Types of Event History Analysis i. Descriptive: compare times to event by different groups (eg survival plots) ii. Modelling: variations of Cox’s Regression models, which allow for particular conditions of event history data structures • Type of data permutations influences analysis – only simple data is easily used! April 2006: LDA 50
Eg 4. 1 : Mean durations by states April 2006: LDA 51
Eg 4. 1 : Kaplan-Meir survival April 2006: LDA 52
Eg 4. 2: Cox’s regression April 2006: LDA 53
Five Approaches to Longitudinal Data Analysis Introducing quantitative longitudinal research 1. Repeated cross-sections 2. Panel datasets 3. Cohort studies 4. Event history datasets 5. Time series analyses April 2006: LDA 54
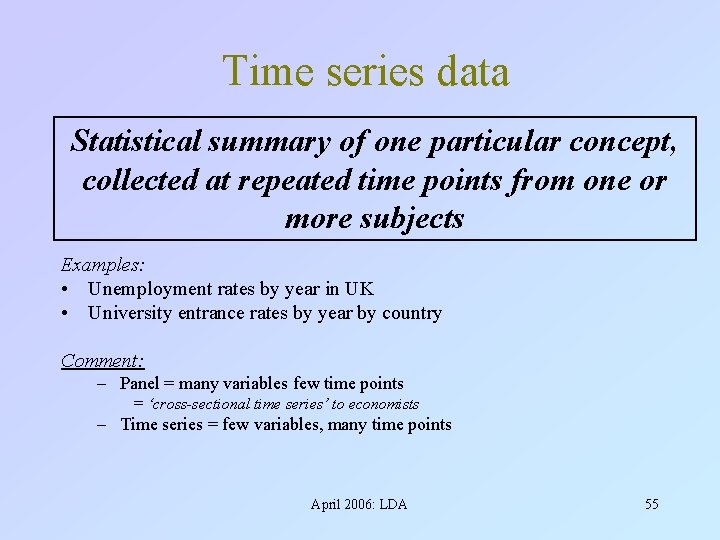
Time series data Statistical summary of one particular concept, collected at repeated time points from one or more subjects Examples: • Unemployment rates by year in UK • University entrance rates by year by country Comment: – Panel = many variables few time points = ‘cross-sectional time series’ to economists – Time series = few variables, many time points April 2006: LDA 55
Time Series Analysis i) Descriptive analyses – – – charts / text commentaries on values by time periods and different groups Widely used in social science research But exactly equivalent to repeated crosssectional descriptives. April 2006: LDA 56
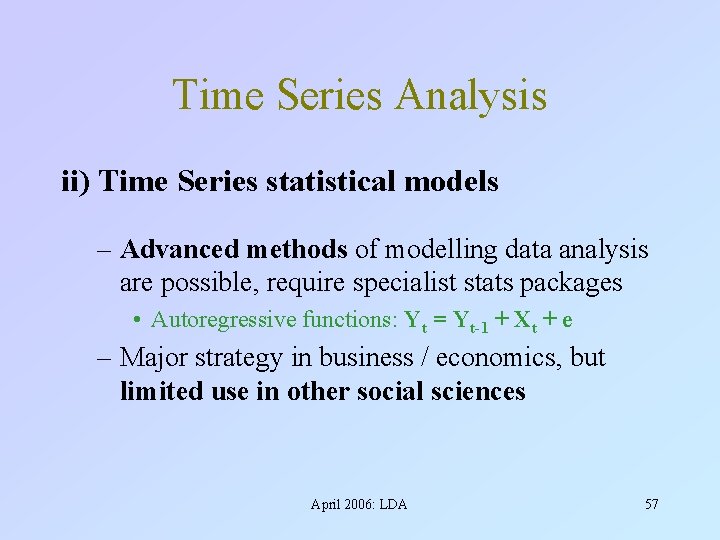
Time Series Analysis ii) Time Series statistical models – Advanced methods of modelling data analysis are possible, require specialist stats packages • Autoregressive functions: Yt = Yt-1 + Xt + e – Major strategy in business / economics, but limited use in other social sciences April 2006: LDA 57
Some UK Time Series sources Time series databases (aggregate statistics) v. ONS Time series data v. ESDS International macrodata Repeated cross-sectional surveys v. Census v. Labour Force Survey v. Many others. . April 2006: LDA 58
Introducing quantitative longitudinal research 1. Repeated cross-sections 2. Panel datasets 3. Cohort studies 4. Event history datasets 5. Time series analyses …. Phew! April 2006: LDA 59
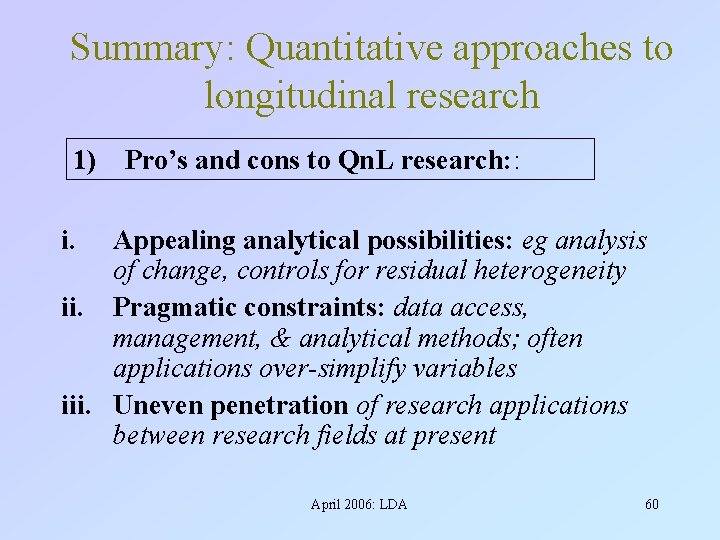
Summary: Quantitative approaches to longitudinal research 1) Pro’s and cons to Qn. L research: : i. Appealing analytical possibilities: eg analysis of change, controls for residual heterogeneity ii. Pragmatic constraints: data access, management, & analytical methods; often applications over-simplify variables iii. Uneven penetration of research applications between research fields at present April 2006: LDA 60
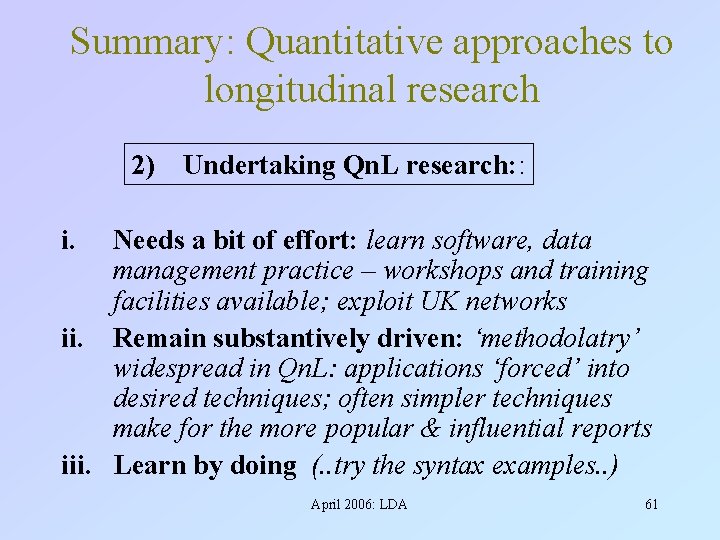
Summary: Quantitative approaches to longitudinal research 2) Undertaking Qn. L research: : i. Needs a bit of effort: learn software, data management practice – workshops and training facilities available; exploit UK networks ii. Remain substantively driven: ‘methodolatry’ widespread in Qn. L: applications ‘forced’ into desired techniques; often simpler techniques make for the more popular & influential reports iii. Learn by doing (. . try the syntax examples. . ) April 2006: LDA 61
Some research resources See website for text and links to further internet resources: • Many training courses in UK – e. g. see ESRC Research Methods Programme Ø Practical exemplar data analysis and data management in SPSS and STATA: http: //www. longitudinal. stir. ac. uk/ April 2006: LDA 62
- Slides: 62