Introduction to Technical Analysis The term technical in

- Slides: 50
Introduction to Technical Analysis
The term “technical, ” in its application to the stock market, has come to have a very special meaning, quite different from its ordinary dictionary definition.
It refers to the study of the action of the market itself as opposed to the study of the goods in which the market deals.
Technical Analysis is the science of recording, usually in graphic form, the actual history of trading (price changes, volume of transactions, etc. ) in a certain stock or in “the Averages” and then deducing from that pictured history the probable future trend.
Charts
• Charts are the working tools of the technical analyst. They have been developed in a multitude of forms and styles to represent graphically almost anything and everything that takes place in the market, or to plot an “index” derived therefrom.
• They may be monthly charts on which an entire month’s trading record is condensed into a single entry, or weekly, daily, hourly, transaction, “point-and-figure, ” candlestick, etc.
The Dow Theory
The Dow Theory is the granddaddy of all technical market studies. Although it is frequently criticized for being “too late, ” and occasionally derided (particularly in the early stages of a Bear Market) by those who rebel at accepting its verdicts.
• Many who heed it in greater or lesser degree in determining their investment policies never realize that it is purely and simply “technical. ” It is built upon and concerned with nothing but the action of the stock market itself (as expressed in certain “averages”), deriving nothing from the business statistics on which the fundamentalists depend.
There is much in the writings of its original promulgator, Charles H. Dow, to suggest that he did not think of his “theory” as a device forecasting the stock market, or even as a guide for investors, but rather as a barometer of general business trends.
• Upon his death in 1902 his successor, as editor of the Wall Street Journal, William P. Hamilton, took up Dow’s principles and, in the course of 27 years of writing on the stock market, organized them and formulated them into the Dow Theory as we know it today.
The Dow Theory
1. The Averages Discount Everything (except “Acts of God”) Because they reflect the combined market activities of thousands of investors, including those possessed of the greatest foresight and the best information on trends and events, the Averages in their day-to-day fluctuations discount everything known, everything foreseeable, and every condition which can affect the supply of or the demand for corporate securities. Even unpredictable natural calamities, when they happen, are quickly appraised and their possible effects discounted.
2. The Three Trends The “market, ” meaning the price of stocks in general, swings in trends, of which the most important are its Major or Primary Trends. These are the extensive up or down movements which usually last for a year or more and result in general appreciation or depreciation in value of more than 20%.
Movements in the direction of the Primary Trend are interrupted at intervals by Secondary Swings in the opposite direction — reactions or “corrections” that occur when the Primary Move has temporarily “gotten ahead of itself. ” (Both Secondaries and the intervening segments of the Primary Trend are frequently lumped together as Intermediate Movements a term which we shall find useful in subsequent discussions. ) Finally, the Secondary Trends are composed of Minor Trends or day-to-day fluctuations which are unimportant to Dow Theory.
3. The Primary Trends • These, as aforesaid, are the broad, overall, up and down movements which usually (but not invariably) last for more than a year and may run for several years. So long as each successive rally (price advance) reaches a higher level than the one before it, and each Secondary Reaction stops (i. e. , the price trend reverses from down to up) at a higher level than the previous reaction, the Primary Trend is Up. This is called a Bull Market. Conversely, when each Intermediate Decline carries prices to successively lower levels and each intervening rally fails to bring them back up to the top level of the preceding rally, the Primary Trend is Down and that is called a Bear Market. (The terms Bull and Bear are frequently used loosely with reference, respectively, to any sort of up or down movements, but we shall use them in this book only in connection with the Major or Primary Movements of the market in the Dow sense. )
• Ordinarily — theoretically, at least — the Primary is the only one of the three trends with which the true longterm investor is concerned. His aim is to buy stocks as early as possible in a Bull Market — just as soon as he can be sure that one has started — and then hold them until (and only until) it becomes evident that it has ended and a Bear Market has started. He knows that he can safely disregard all the intervening Secondary Reactions and Minor Fluctuations. The trader, however, may well concern himself also with the Secondary Swings, • and it will appear later on in this book that he can do so with profit.
4. The Secondary Trends • These are the important reactions that interrupt the progress of prices in the Primary Direction. They are the Intermediate Declines or “corrections” which occur during Bull Markets, the Intermediate Rallies or “recoveries” which occur in Bear Markets. Normally, they last for 3 weeks to many months, and rarely longer. Normally, they retrace from one third to two thirds of the gain (or loss, as the case may be) in prices registered in the preceding swing in the Primary Direction. Thus, in a Bull Market, prices in terms of the Industrial
• Average might rise steadily, or with only brief and minor interruptions, for a total gain of 30 (or 300) points before a Secondary Correction occurred. That correction might then be expected to produce a decline of not less than 10 points and not more than 20 points before a new Intermediate Advance in the Primary Bull Trend developed.
• Note, however, that the one third/two thirds rule is not an unbreakable law; it is simply a statement of probabilities. Most Secondaries are confined within these limits; many of them stop very close to the halfway mark, retracing 50% of the preceding Primary Swing. They seldom run less than one third, but some of them cancel nearly all of it. Thus we have two criteria by which to recognize a Secondary Trend.
• Any price movement contrary in direction to the Primary Trend that lasts for at least 3 weeks and retraces at least one third of the preceding net move in the Primary Direction (from the end of the preceding Secondary to the beginning of this one, disregarding Minor Fluctuations) is labeled as of Intermediate Rank, i. e. , a true Secondary. Despite these criteria, however, the Secondary Trend is often confusing; its recognition, its correct appraisal at the time it develops and while it is in process, poses the Dow theorist’s most difficult problem.
5. The Minor Trends • — These are the brief (rarely as long as 3 weeks — usually less than 6 days) fluctuations which are, so far as the Dow Theory is concerned, meaningless in themselves, but which, in toto, make up the Intermediate Trends. Usually, but not always, an Intermediate Swing, whether a Secondary or the segment of a Primary between successive Secondaries, is made up of a series of three or more distinguishable Minor Waves. Inferences drawn from these day- to-day fluctuations are quite apt to be misleading.
• The Minor Trend is the only one of the three trends which can be “manipulated” (although it is, in fact, doubtful if under present conditions even that can be purposely manipulated to any important extent). Primary and Secondary Trends cannot be manipulated; it would strain the resources of the U. S. Treasury to do so. Right here, before we go on to state a sixth Dow tenet, we may well take time out for a few minutes to clarify the concept of the three trends by drawing an analogy between the movements of the stock market and the movements of the sea.
• The Major (Primary) Trends in stock prices are like the tides. We can compare a Bull Market to an incoming or flood tide which carries the water farther and farther up the beach until finally it reaches high-water mark and begins to turn. Then follows the receding or ebb tide, comparable to a Bear Market. But all the time, during both ebb and flow of the tide, the waves are rolling in, breaking on the beach, and then receding. While the tide is rising, each succeeding wave pushes a little farther up onto the shore and, as it recedes, does not carry the water quite so far back as did its predecessor.
• During the tidal ebb, each advancing wave falls a little short of the mark set by the one before it, and each receding wave uncovers a little more of the beach. These waves are the Intermediate Trends, Primary or Secondary, depending on whether their movement is with or against the direction of the tide. Meanwhile, the surface of the water is constantly agitated by wavelets, ripples, and “cat’s-paws” moving with or against or across the trend of the waves — these are analogous to the market’s Minor Trends, its unimportant day-to-day fluctuations. The tide, the wave, and the ripple represent, respectively, the Primary or Major, the Secondary or Intermediate, and the Minor Trends of the market.
6. The Bull Market • The second phase is one of fairly steady advance and increasing Primary Uptrends are usually (but not invariably) divisible into three phases. The first is the phase of accumulation during which farsighted investors, sensing that business, although now depressed, is due to turn up, are willing to pick up all the shares offered by discouraged and distressed sellers, and to raise their bids gradually as such selling diminishes in volume. Financial reports are still bad — in fact, often at their worst — during this phase. The “public” is completely disgusted with the stock market — out of it entirely. Activity is only moderate but beginning to increase on the rallies (Minor Advances).
• The second phase is one of fairly steady advance and increasing activity as the improved tone of business and a rising trend in corporate earnings begin to attract attention. It is during this phase that the “technical” trader normally is able to reap his best harvest of profits. Finally, comes the third phase when the market boils with activity as the “public” flocks to the boardrooms. All the financial news is • good, price advances are spectacular and frequently “make the front page” of the daily papers, and new issues are brought out in increasing numbers.
It is during this phase that one of your friends will call up and blithely remark, “Say, I see the market is going up. What’s a good buy? ” — all oblivious to the fact that it has been going up for perhaps two years, has already gone up a long ways, and is now reaching the stage where it might be more appropriate to ask, “What’s a good thing to sell? ” In the last stage of this phase, with speculation rampant, volume continues to rise, but “air pockets” appear with increasing frequency; the “cats and dogs” (low-priced stocks of no investment value) are whirled up, but more and more of the top-grade issues refuse to follow.
7. The Bear Market • Primary Downtrends are also usually (but again, not invariably) characterized by three phases. The first is the distribution period (which really starts in the later stages of the preceding Bull Market). During this phase, farsighted investors sense the fact that business earnings have reached an abnormal height and unload their holdings at an increasing pace. Trading volume is still high, though tending to diminish on rallies, and the “public” is still active but beginning to show signs of frustration as hoped-for profits fade away. The second phase is the Panic Phase. Buyers begin to thin out and sellers become more urgent; the downward trend of prices suddenly accelerates into an almost vertical drop, while volume mounts to climactic proportions.
• After the Panic Phase (which usually runs too far relative to then-existing business conditions), there may be a fairly long Secondary Recovery or a sideways movement, and then the third phase begins. This is characterized by discouraged selling on the part of those investors who held on through the Panic or, perhaps, bought during it because stocks looked cheap in comparison with prices which had ruled a few months earlier. The business news now begins to deteriorate. As the third phase proceeds, the downward movement is less rapid, but is maintained by more and more distress selling from those who have to raise cash for other needs.
• The “cats and dogs” may lose practically all their previous Bull Advance in the first two phases. Better-grade stocks decline more gradually, because their owners cling to them to the last. And, the final stage of a Bear Market, in consequence, is frequently concentrated in such issues. The Bear Market ends when everything in the way of possible bad news, the worst to be expected, has been discounted, and it is usually over before all the bad news is “out. ”
• The three Bear Market phases described in the preceding paragraph are not the same as those named by others who have discussed this subject, but the writers of this study feel that they represent a more accurate and realistic division of the Primary down moves of the past 30 years. The reader should be warned, however, that no two Bear Markets are exactly alike, and neither are any two Bull Markets. Some may lack one or another of the three typical phases. A few Major Advances have passed from the first to the third stage with only a very brief and rapid intervening markup. A few short
• Bear Markets have developed no marked Panic Phase and others have ended with it, as in April 1939. No time limits can be set for any phase; the third stage of a Bull Market, for example, the phase of excited speculation and great public activity, may last for more than a year or run out in a month or two. The Panic Phase of a Bear Market is usually exhausted in a very few weeks if not in days, but the 1929 through 1932 decline was interspersed with at least five Panic Waves of major proportions. Nevertheless, the typical characteristics of Primary Trends are well worth keeping in mind. If you know the symptoms which normally accompany the last stage of a Bull Market, for example, you are less likely to be deluded by its exciting atmosphere.
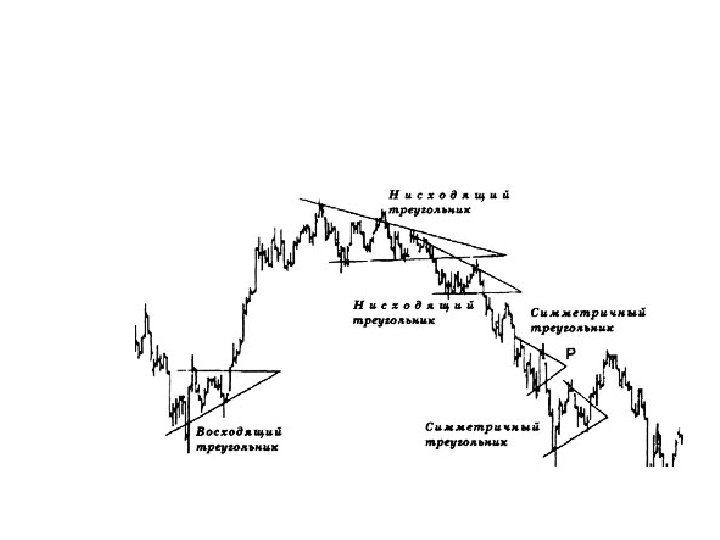
Chart patterns • • symmetrical triangles, ascending triangles, descending triangles, wedges, flags and pennants, Rectangles, head and shoulders
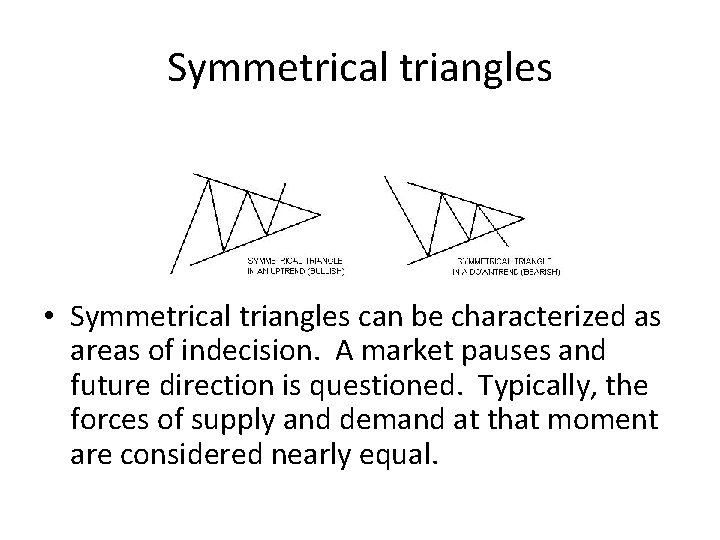
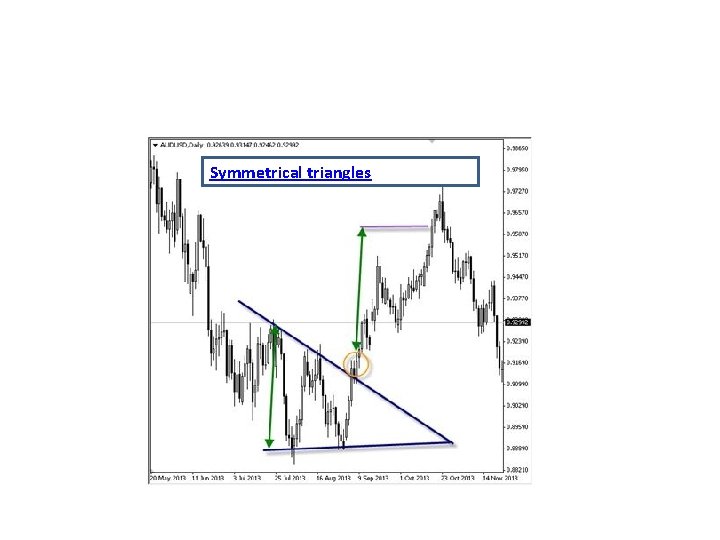
Symmetrical triangles • Symmetrical triangles can be characterized as areas of indecision. A market pauses and future direction is questioned. Typically, the forces of supply and demand at that moment are considered nearly equal.
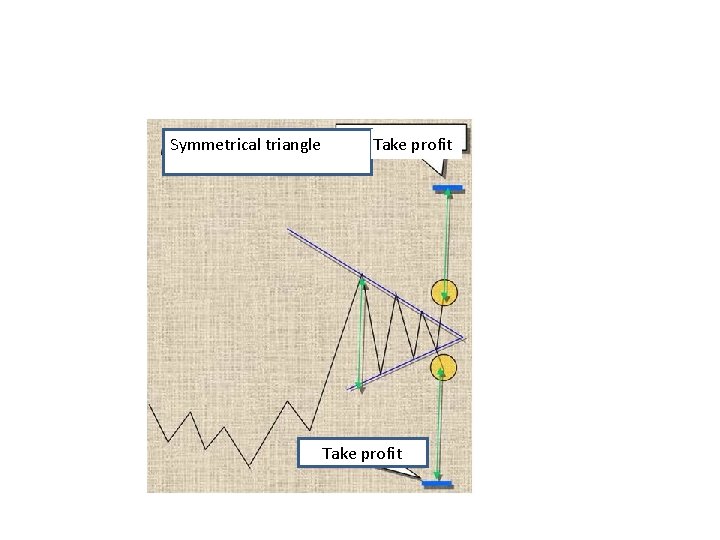
• Eventually, this indecision is met with resolve and usually explodes out of this formation (often on heavy volume. ) Research has shown that symmetrical triangles overwhelmingly resolve themselves in the direction of the trend.
Symmetrical triangle Take profit
Symmetrical triangles
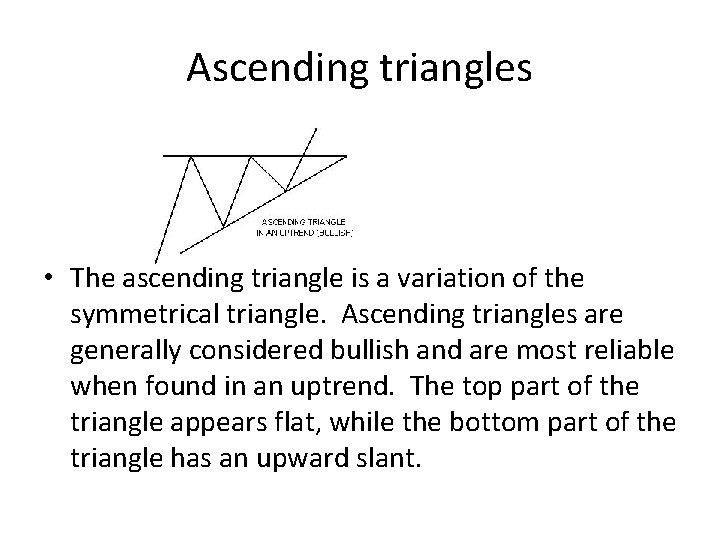
Ascending triangles • The ascending triangle is a variation of the symmetrical triangle. Ascending triangles are generally considered bullish and are most reliable when found in an uptrend. The top part of the triangle appears flat, while the bottom part of the triangle has an upward slant.
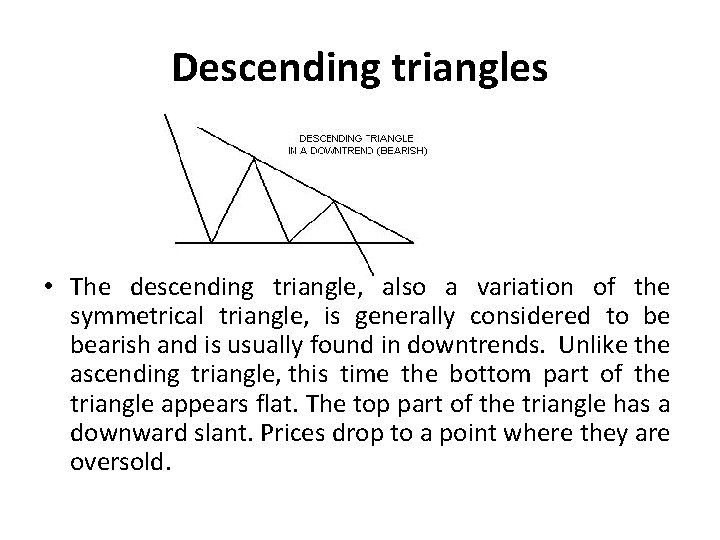
Descending triangles • The descending triangle, also a variation of the symmetrical triangle, is generally considered to be bearish and is usually found in downtrends. Unlike the ascending triangle, this time the bottom part of the triangle appears flat. The top part of the triangle has a downward slant. Prices drop to a point where they are oversold.
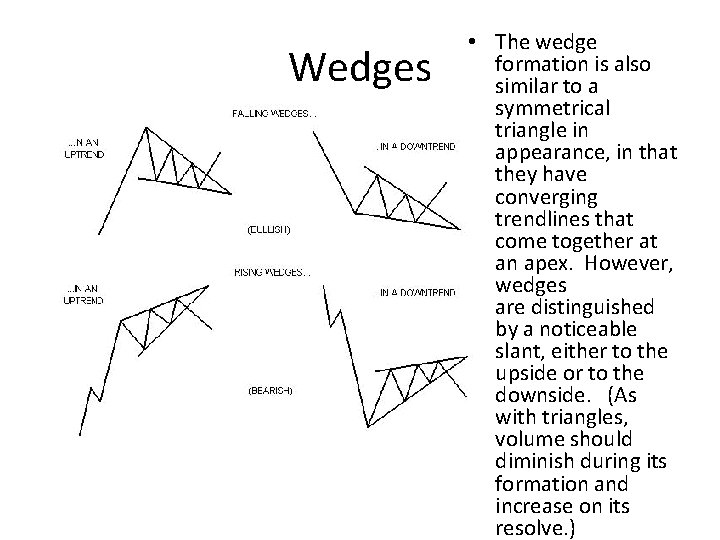
Wedges • The wedge formation is also similar to a symmetrical triangle in appearance, in that they have converging trendlines that come together at an apex. However, wedges are distinguished by a noticeable slant, either to the upside or to the downside. (As with triangles, volume should diminish during its formation and increase on its resolve. )
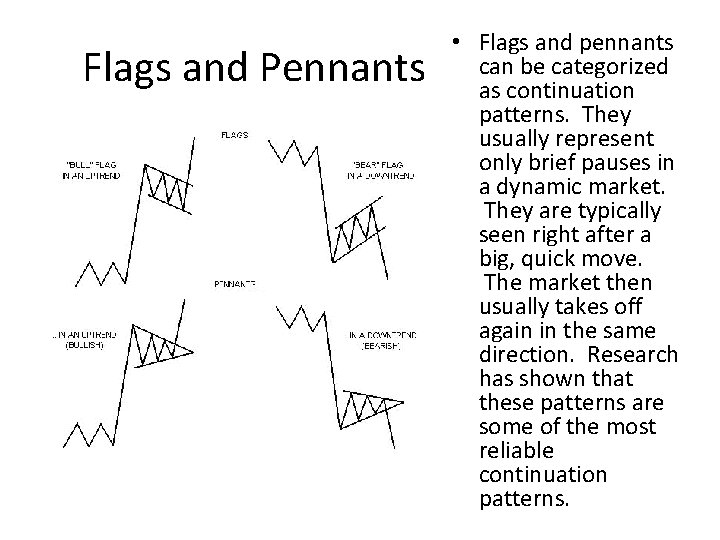
Flags and Pennants • Flags and pennants can be categorized as continuation patterns. They usually represent only brief pauses in a dynamic market. They are typically seen right after a big, quick move. The market then usually takes off again in the same direction. Research has shown that these patterns are some of the most reliable continuation patterns.
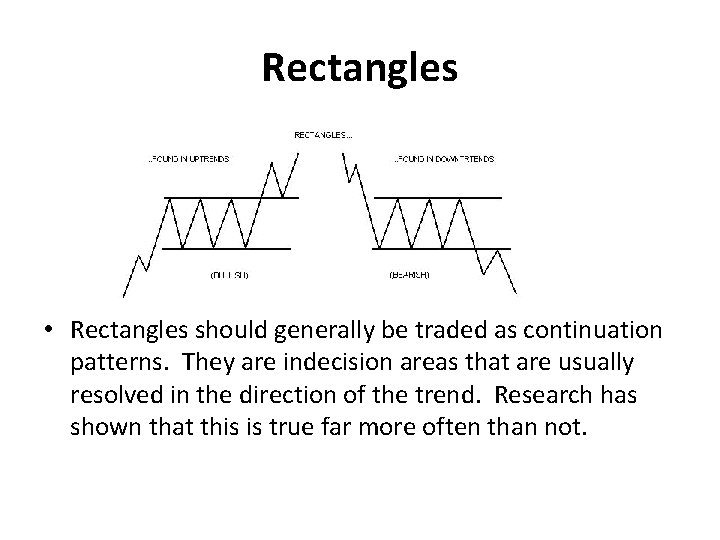
Rectangles • Rectangles should generally be traded as continuation patterns. They are indecision areas that are usually resolved in the direction of the trend. Research has shown that this is true far more often than not.
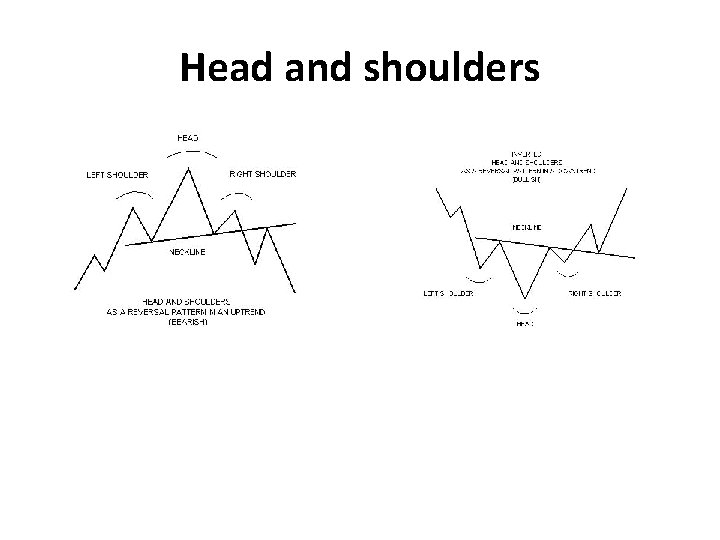
Head and shoulders
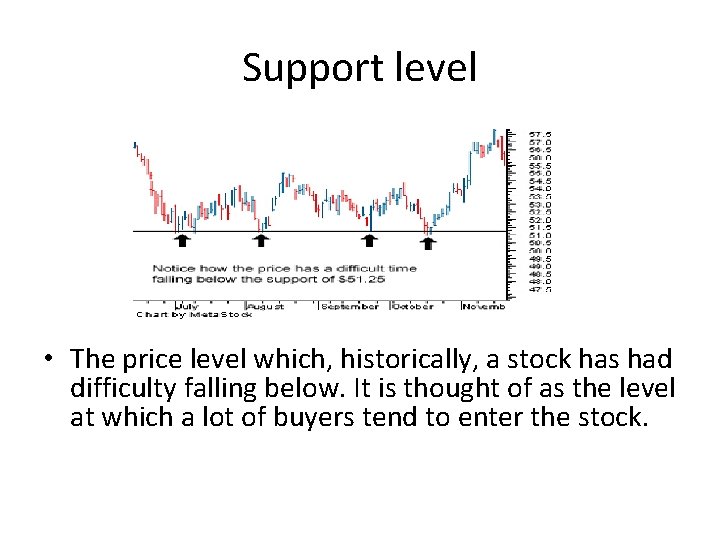
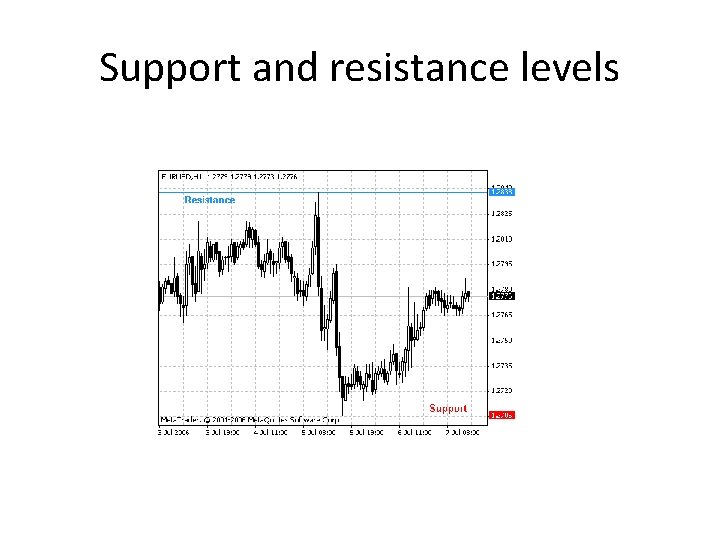
Support level • The price level which, historically, a stock has had difficulty falling below. It is thought of as the level at which a lot of buyers tend to enter the stock.
• If the price of a stock falls towards a support level it is a test for the stock: the support will either be reconfirmed or wiped out. It will be reconfirmed if a lot of buyers move into the stock, causing it to rise and move away from the support level. It will be wiped out if buyers will not enter the stock and the stock falls below the support.
• A chart point or range that caps an increase in the level of a stock or index over a period of time. An area of resistance or resistance level indicates that the stock or index is finding it difficult to break through it, and may head lower in the near term. The more times that the stock or index has tried unsuccessfully to break through the resistance level, the more formidable that area of resistance becomes.
Support and resistance levels