Flourishing Sustained Continuous Steady Strong Living into Well


 are Interrelated – 87% of people with")


 Thoughts daily or several")


- Slides: 66
Flourishing Sustained, Continuous, Steady, Strong, Living into Well Foundation for Healthy Generations 2015
NEAR Flourishing Neuroscience Epigenetics Adverse Childhood Experience Resilience Foundation for Healthy Generations 2015
Sequential Brain Development It’s the nature of humans to adapt to the nurture we receive in childhood 1. “The brain develops in sequence… 2. The brain organizes in a use –dependent fashion… 3. Windows of opportunity and vulnerability exist for all children” (Dr. Bruce Perry) Type of Abuse Age – Sensitive Periods Gender (Dr. Martin Teicher)
Experience & Adaptation Dangerous World with Challenges & Support NEUTRAL START BRAIN Prepares for anticipated world POSITIVE STRESS Stress is buffered by adult protection & nurturance BIOLOGY & SOCIETAL EXPECTATIONS ALIGN Safe World Adapted from the research of Martin Teicher, MD, Ph. D By Washington Family Policy Council Foundation for Healthy Generations 2014
Hardwired for Anticipated World CHARACTERISTICS Dangerous Pre. Conception TOXIC STRESS “Brawn over Brains” Focused: Fight, Flight or Freeze BRAIN Prepares for anticipated world CHARACTERISTICS Safe ”Process over Power” Multi-focused: Relational Survive the worst conditions Dissonance between biological adaptation & social expectations fuels problems Survive in good times; vulnerable in poor conditions Adapted from the research of Martin Teicher, MD, Ph. D Foundation for Healthy Generations 2014
“… experiences of a parent, before even conceiving ”From a offspring, translation markedly al influence both perspectiv e, our structure and results function in the allow us to nervous system of appreciate subsequent how the generations. ” experience s of a Dr Brian Dias, Emory University, 2014 parent, before
Adverse Childhood Experience Study er ge n er at io na l T ra ns m iss io n Ne uro bio log y & Ep ige ne tic s In t Foundation for Healthy Generations 2014
ACE Study Indicators of Family Dysfunction Abuse 1. Mentally ill, depressed or 6. Child physical abuse suicidal person in home 7. Child sexual abuse 2. Drug addicted or alcoholic 8. Child emotional abuse family member 3. Parental discord – indicated by divorce, separation, Neglect abandonment 9. Physical Neglect 4. Witnessing domestic violence 10. Emotional Neglect against the mother 5. Incarceration of any family member Accumulation Matters ACE Score = Number of Categories (0 -10) Foundation for Healthy Generations 2014
ACE Study Major Findings ACE Categories (ACEs) are Interrelated – 87% of people with 1 have >1 ACEs are Common – Nearly 2/3 of adults have ≥ 1; 27% have ≥ 3; 5% have ≥ 6 Accumulation of ACEs Matters – Higher # (ACE Score) = higher population risk Graded Relationship: Disease, Disability, Social, Productivity Scores= Good Proxy Measure Childhood Toxic Stress Dose ACEs are the Most Powerful Known Determinant of Health – Mental, Physical, Behavioral, Productivity, Disability, & Social Problems
ACE Attributable Problems Risks Poor Mental Health Disease Smoking Heavy drinking Obesity Risk of AIDS High on painkillers Obesity Cardiovascular Cancer Asthma Diabetes Auto immune COPD Ischemic heart disease Liver disease Health/Social Problems Fair or poor health Life dissatisfaction Health-related limits to quality of life Disability that impedes daily functioning Don’t complete secondary education Unemployment History of adult homelessness Frequent mental distress Sleep disturbances Nervousness MH problem requiring medication Emotional problems restrict activities Serious & persistent mental illness Intergenerational Transmission Mental Illness Drugs or Alcohol Problem Multiple divorces, separations Victim of family violence Adult incarceration Foundation for Healthy Generations 2014
Law & Justice Safety Workforce Civic Engagement Controls: gender, age, income, education, race-ethnicity Foundation for Healthy Generations 2014
“For an epidemic of influenza, a hurricane, earthquake, or tornado the worst is quickly over; treatment and recovery efforts can begin. In contrast, the chronic disaster that results from ACEs is insidious, constantly rolling out from generation to generation. ” Dr. Robert Anda, 2009 Overwhelming Stress or Trauma Chronic Childhood Adversity
Prevention Across Generations Historic Trauma Adverse Childhood Experience Adverse Peer &/or School Experience Adverse Adult Experience Multiple Mental, Physical, Relational, &/or Productivity Problems ACE Transmission Risk
Thoughts of Historical Loss Among Indigenous Youth (Ages 11 -13) Thoughts daily or several times a day 24. 1 Losses from effects of alcoholism 23. 4 Loss of our people through early death 23 Loss of language Loss of culture 20. 6 Loss of land 20. 5 19 Loss of traditional spiritual ways 14. 8 Loss of trust in Whites / broken treaties 12. 4 Loss of family ties / boarding schools Loss of families / relocation 11. 8 Loss of self respect / poor treatment. . . 11. 7 % 0 5 10 15 20 25 30 Whitbeck, L. B. , Walls, M. L. , Johnson, K. D. , Morrisseau, A. D. , Mc. Dougall, C. M. (2009). Depressed affect and historical loss among North American indigenous adolescents. American Indian and Alaska Mental Health Research, 16(3), 16 -49.
Adverse Childhood Exposures and Alcohol Dependence Among Seven Tribes From the Ten Tribes Study American Journal of Preventative Medicine, 2003, pp. 238 -244; Koss, M. , Polacca, M. , Yuan N. , et al
Adverse Childhood Exposures Analysis from “The Ten Tribes Study” ABUSE AND NEGLECT 1. Physical abuse (men: 40%; women: 42%) 2. Sexual Abuse (men: 26%; women: 31%) 3. Emotional abuse (men: 26. 5%; women: 36. 4%) 4. Physical neglect (men: 45%; women: 43%) 5. Emotional neglect (men: 20%; women 23%) FAMILY/CONTEXT 6. Boarding school placement (25%) 7. Foster care placement, (men: 10%; women: 14. 5%) 8. Adoption (5%) 9. Having an alcoholic parent(s) (men: 66%; women: 66. 5%) 86% participants experienced one or more categories 33% reported four or more categories.
Developmental Adversity & Alcohol Dependence Times More Likely Than People with 0 ACEs 8 Odds of Alcohol Dependence; 7 Tribes 7 7 - Combined sexual and physical abuse increased alcohol dependence for men. 6 5 5 4 - Combined sexual abuse and boarding school attendance were significant for women. 3 2 2 1 0 1 2 3 Number of Adverse Childhood Exposures ≥ 4 Koss, M. , Polacca, M. , Yuan N. , et al “Adverse Childhood Exposures and Alcohol Dependence Among Seven Tribes” American Journal of Preventative Medicine, 2003, pp. 238 -244
“At ≥ 6 ACEs, adults are 9 times more likely to experience life dissatisfaction and 4. 6 times more likely to suffer from chronic diseases and engage in risky behaviors such as smoking. ” Anda and Brown, 2009
Community Variation: ≥ 6 ACEs %≥ 6 ACEs 12 -22% 10 -11% 8 -9% 6 -7% 4 -5% 0 -3% Foundation for Healthy Generations 2014
ACEs and Co-Occurring Problems Mean # of Co-Occurring Outcomes 5 4 3 2 1 0 0 1 2 3 4 ACE Score 5 6 7, 8 Health & Social Problems Panic Reactions Affect Regulation Depression Anxiety Hallucinations Sleep Disturbances Somatic Issues Severe Obesity Pain Smoking Alcoholism Substance Use Illicit Drug Use IV Drug Use Early Intercourse Promiscuity Sexual Dissatisfaction Memory Amnesia (Childhood) Problems with Anger Perpetration of Family Arousal Violence Foundation for Healthy Generations 2015
Major Adult Stressors 1. Homelessness 2. Incarceration 3. Chronic illness 4. Separation/Divorce 5. Severe Depression 6. Work-related Injury/ Illness Foundation for Healthy Generations 2014
ACEs & History of Homelessness 25 -54 yr Old Adult Population 30. 00% 29. 80% % Homelessness 25. 00% 18. 90% 20. 00% 15. 00% 11. 10% 10. 00% 5. 50% 5. 00% 2. 20% 0 1 0. 00% 2010 BRFSS – Preliminary; Based on < Full Year of Data 2 # of ACE's 3 4 -5 6 -8
ACEs Increase Risk for Adult Adversities: 1. Homelessness 2. Incarceration 3. Chronic illness 4. Separation/Divorce 5. Severe Depression 6. Work-related Injury/ Illness % with 15 -30 Disability. Interrupted Days a Month NEAR Informed Service Structure 60 50 40 30 20 10 0 0 1 2 3 Number of Adult Major Stress Categories Added to ACE Score of ≥ 3 Foundation for Healthy Generations 2015
Each Person: A Unique Experience of the World
High Leverage Strategy Moderate ACE Effects, Improve Wellbeing Among Parenting Adults 8 Prevent High ACE Scores among Children 7 2 Mutually Reinforcing
What Helps People Self-Regulate? Mindfulness, Reflection, Biofeedback Massage Movement and Music Practicing Connection Exercise & Play • Activities that integrate visual information with fine- and gross-motor movements (striking, kicking, and catching) • Physical activities: exploration of environment Foundation for Healthy Generations 2014
“When basic needs are met… money and happiness decouple. ” The Culture Inside Us; Bryan Walsh, 2013 “Social integration and human interconnectedness lead to happiness. ” Lao Lu, 1997 Foundation for Healthy Generations 2014
Help that Helps 1. Support: Feeling socially and emotionally supported and hopeful 2. Help: Having two or more people who give concrete help when needed 3. Community Reciprocity: watching out for children, intervening when they are in trouble, and doing favors for one another 4. Social Bridging: reaching outside one’s immediate circle of friends to recruit help for someone inside that circle.
Support Feeling socially and emotionally supported and hopeful … Always or Usually (vs Rarely or Never) Foundation for Healthy Generations 2014
ACEs & Activity Limitations 60 Activity Limited Due to Health Problems With Support & Hope % of Population 50 40 30 20 10 0 0 ACE 1 -3 ACEs Low Support & Hope 4 -8 ACEs High Support & Hope Limited Activity Due to Poor Health Foundation for Healthy Generations 2014
Activity Limitations & Support 60 Activity Limited Due to Health Problems With Support & Hope % of Population 50 40 30 20 10 0 0 ACE Low Support & Hope 1 -3 ACEs 4 -8 ACEs High Support & Hope Foundation for Healthy Generations 2014
ACEs & Smoking Smoker With Low Support & Hope 45 40 % of Population 35 30 25 20 15 10 5 0 0 ACE Low Support & Hope 1 -3 ACEs 4 -8 ACEs High Support & Hope Foundation for Healthy Generations 2014
Smoking & Support Smoker With Support & Hope 45 40 % of Population 35 30 25 20 15 10 5 0 0 ACE Low Support & Hope 1 -3 ACEs 4 -8 ACEs High Support & Hope Foundation for Healthy Generations 2014
ACEs & Poor Mental Health 50 Poor Mental Health More Than Half Last Month With Support & Hope 45 % of Population 40 35 30 25 20 15 10 5 0 0 ACE Low Support & Hope 1 -3 ACEs 4 -8 ACEs High Support & Hope Foundation for Healthy Generations 2014
Mental Health & Support 50 Poor Mental Health More Than Half Last Month With Support & Hope 45 % of Population 40 35 30 25 20 15 10 5 0 0 ACE Low Support & Hope 1 -3 ACEs 4 -8 ACEs High Support & Hope Foundation for Healthy Generations 2014
ACEs & Poor Health 30 Poor Physical Health More Than Half Last Month With Support & Hope % of Population 25 20 15 10 5 0 0 ACE Low Support & Hope 1 -3 ACEs 4 -8 ACEs High Support & Hope Foundation for Healthy Generations 2014
Poor Health & Support 30 Poor Physical Health More Than Half Last Month With Support & Hope % of Population 25 20 15 10 5 0 0 ACE Low Support & Hope 1 -3 ACEs 4 -8 ACEs High Support & Hope Foundation for Healthy Generations 2014
ACEs & Ability to Work 25 Unable to Work With Support & Hope % of Population 20 15 10 5 0 0 ACE Low Support & Hope 1 -3 ACEs 4 -8 ACEs High Support & Hope Foundation for Healthy Generations 2014
Ability to Work & Support 25 Unable to Work With Support & Hope % of Population 20 15 10 5 0 0 ACE Low Support & Hope 1 -3 ACEs 4 -8 ACEs High Support & Hope Foundation for Healthy Generations 2014
What Generates Belonging & Support? Developing ceremonies or rituals Including others in health-promoting activities Engaging in multiple family or whole community/workplace dialogues Creating art, movement, rhythm, music Effective accommodations Learning together Setting up mutual support/helping systems Foundation for Healthy Generations 2014
Help Having two or more people who give concrete help when needed Foundation for Healthy Generations 2014
ACEs & Hunger Hungry: Not Enough Money With Help 45 40 % of Population 35 30 25 20 15 10 5 0 0 ACE 1 -3 ACEs Low Help 4 -8 ACEs High Help Foundation for Healthy Generations 2014
Hunger & Help Hungry: Not Enough Money With Help 45 40 % of Population 35 30 25 20 15 10 5 0 0 ACE 1 -3 ACEs Low Help 4 -8 ACEs High Help Foundation for Healthy Generations 2014
ACEs & Diabetes With Help 25 % of Population 20 15 10 5 0 0 ACE 1 -3 ACEs Low Help 4 -8 ACEs High Help Foundation for Healthy Generations 2014
Diabetes & Help Diabetes With Help 25 % of Population 20 15 10 5 0 0 ACE 1 -3 ACEs Low Help 4 -8 ACEs High Help Foundation for Healthy Generations 2014
ACEs & Depression 20 Depressed All or Most of Last Month With Help 18 % of Population 16 14 12 10 8 6 4 2 0 0 ACE 1 -3 ACEs Low Help 4 -8 ACEs High Help Foundation for Healthy Generations 2014
Depression & Help 20 Depressed All or Most of Last Month With Help 18 % of Population 16 14 12 10 8 6 4 2 0 0 ACE 1 -3 ACEs Low Help 4 -8 ACEs High Help Foundation for Healthy Generations 2014
ACEs & Mental Illness Symptoms 50 Moderate-Serious Mental Illness With Help 45 % of Population 40 35 30 25 20 15 10 5 0 0 ACE 1 -3 ACEs Low Help 4 -8 ACEs High Help Foundation for Healthy Generations 2014
Mental Illness Symptoms & Help 50 Moderate-Serious Mental Illness With Help 45 % of Population 40 35 30 25 20 15 10 5 0 0 ACE 1 -3 ACEs Low Help 4 -8 ACEs High Help Foundation for Healthy Generations 2014
ACEs & Poor Health Fair or Poor Health With Help 60 % of Population 50 40 30 20 10 0 0 ACE 1 -3 ACEs Low Help 4 -8 ACEs High Help Foundation for Healthy Generations 2014
Poor Health & Help Fair or Poor Health With Help 60 % of Population 50 40 30 20 10 0 0 ACE 1 -3 ACEs Low Help 4 -8 ACEs High Help Foundation for Healthy Generations 2014
Intentionally Working Together “Community is a living, spiritual entity, supported by every responsible adult. ” Gregory Cajete How are community leaders moderating ACE effects and fostering flourishing? Foundation for Healthy Generations 2015
Community Resilience Community Reciprocity: watching out for children, intervening when they are in trouble, and doing favors for one another Social Bridging: reaching outside one’s immediate circle of friends to recruit help for someone inside that circle. Foundation for Healthy Generations 2014
Reciprocity & Bridging Better Rates: Obesity Mental Illness Symptoms Alcohol Consumption among Women Physical Activity Happiness Worry about Money for Rent Having A Primary Care Physician Experiencing Housing Instability Being Hungry Because of No Money Foundation for Healthy Generations 2014
Perspective Understanding a parent’s adverse childhood experience takes nothing away from understanding her resilience. It puts into perspective how spectacularly resilient she may be, the strengths she is building on for the next phase of her life, and opens the space to talk about the life she wants for her family and her new baby.
NOTICE ! Experience Is The Most Powerful Determinant of Public Health
Prepare Leadership is knowledgeable and committed to bringing ACEs/NEAR into the home visiting program. High quality education and support for program supervisors so they can help home visitors to effectively use the science. Education and coaching on ACES/NEAR support Home Visitors. Supportive agency policies on safety, and reflective supervision. Community stakeholders and partners are knowledgeable and committed to supporting ACEs/NEAR integration into EBHV
Ask, Listen, Affirm, Remember Home visitors use ACEs/NEAR framework with all parents to: • Educate about ACEs and associated health risks • Gather ACE histories (always voluntary) • Build resilience. Home Visitors are prepared to ask about ACE history Home Visitors respond with respect and curiosity: “How have these childhood experiences affected you? ” ”How have you done so well when you have had such a difficult childhood? ” “How would you like your child’s life to be different? ”
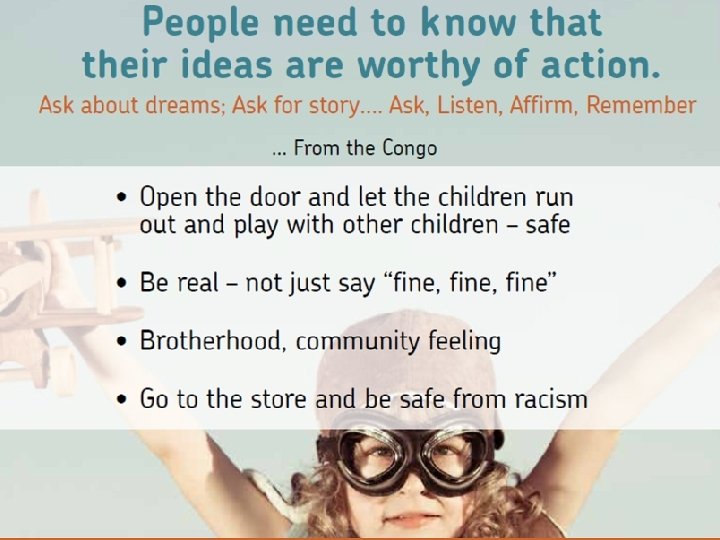
Parents have Opportunity Parents have opportunity for a change moment: the experience of feeling seen, understood, and accepted. Parents know about the most powerful determinate of public health. Parents have a chance to talk about how ACEs have affected their lives and to develop compassion for themselves in the context of a safe and competent relationship. Parents have the opportunity to identify and build on their core gifts in terms of resilience – the ways they have managed to navigate a life with ACE-related challenges.
Aspire Parents make decisions and are able to take actions in their lives that protect their children. Parents engage in available community and professional supports to continue to develop parenting skills, manage stress, and build health and resilience. Parents take steps to develop their capacity to be more sensitive and response to their child’s needs.
Flourish Children reach their full potential by growing and developing in relationships that are healthy and build resilience. The next generation of children has lower ACE scores than this parenting generation. All ACE attributable problems are concurrently reduced in the next generation.
Thank You! Laura Porter laurap@healthygen. org Foundation for Healthy Generations 2014
The Role of Time A life course approach recognizes the role of time in shaping health outcomes Successful Adaptation in Midlife Parental Resilience Number of stressful life events reported in early adulthood Number of stressful life events reported in childhood, adolescence Exercise Spirituality Number of persons can turn to in times of crisis Parental help seeking, ability to form social networks Find ecological niche for child Imagine self as mother Resourceful and realistic in educational & vocational plans Continuing Education Opportunities Establish relationship with helper (doula, visitor, etc. ) Availability of multiple childcare options Spouse or Partner Serves as Emotion Coach Rewarded with repeated promotions contributes to sense of pride 14 15 16 17 18 19 20 21 22 23 24 25 26 27 28 29 30 31 32 33 34 35 36 37 38 39 40 AGE Pregnancy
Thank You! Laura Porter laurap@healthygen. org Foundation for Healthy Generations 2014