AcidBase Reactions strong acid strong base strong acid

Acid-Base Reactions strong acid + strong base strong acid + weak base weak acid + strong base weak acid + weak base

p. Ka and Acid Strength Ka Trends: p. Ka = -log Ka

Buffers

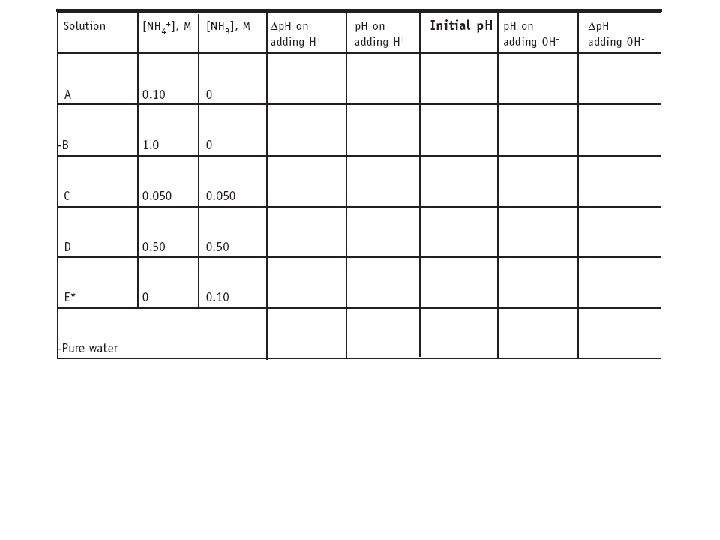
How Buffers Minimize p. H Changes NH 4+/NH 3 buffer If an acid is added: If a base is added:

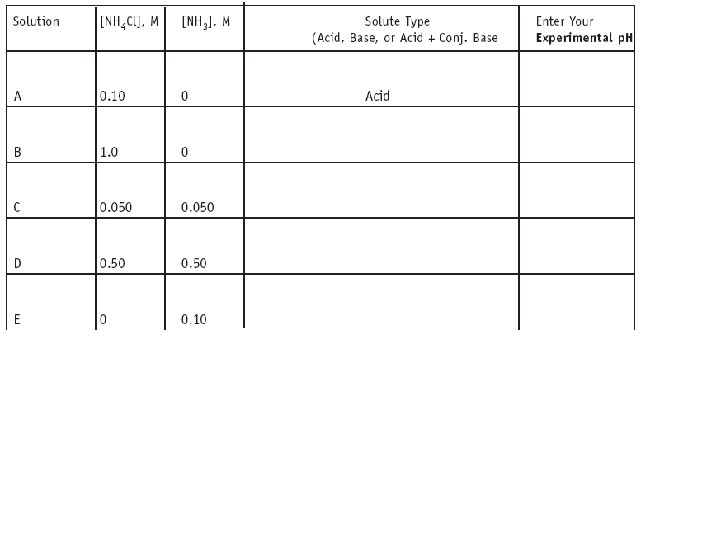
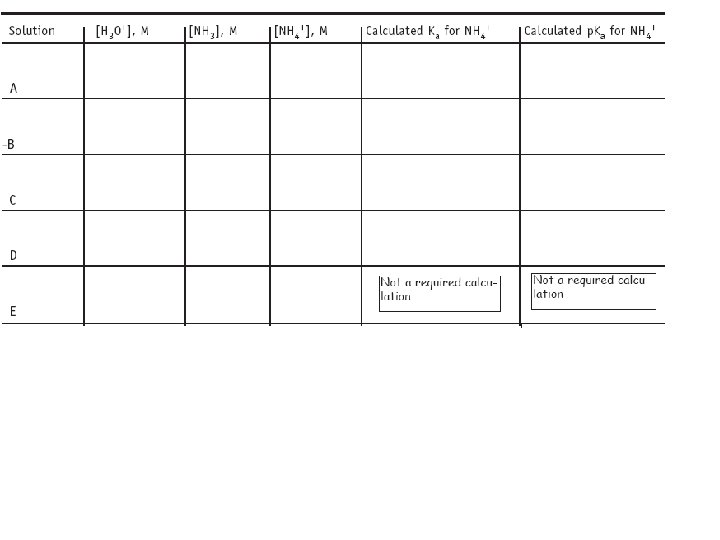
What controls p. H of a buffer?
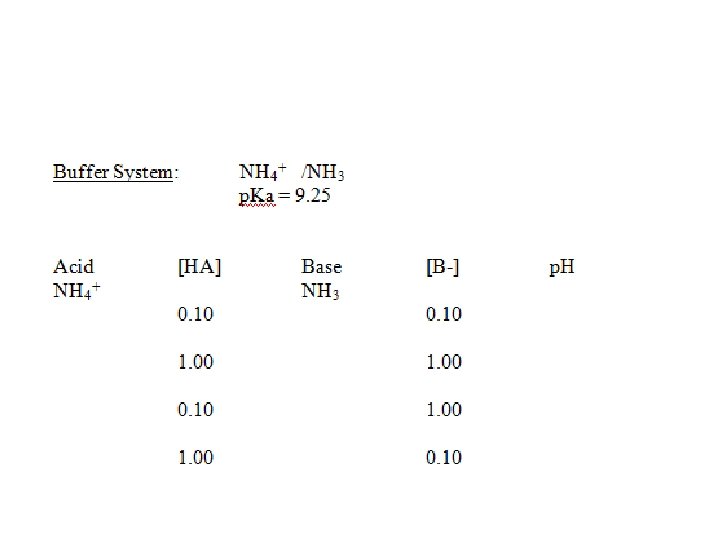

What controls p. H of a buffer?

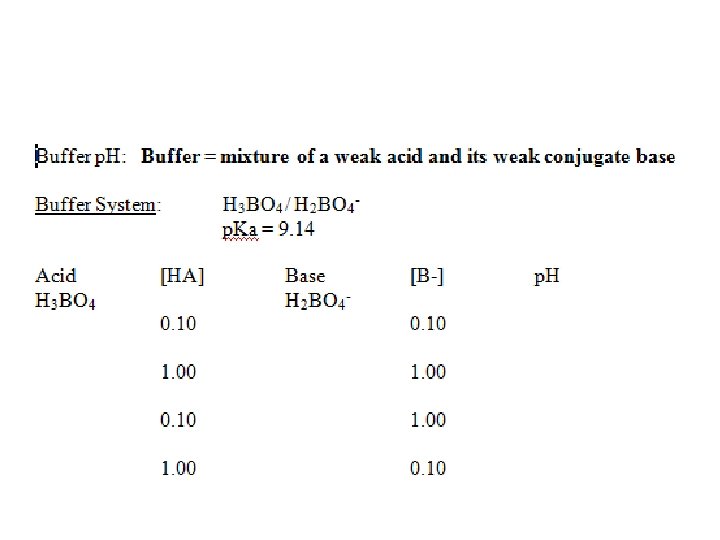
Buffer p. H Two cases: 1. When the acid and base of interest are in bulk and control the p. H 2. When other acids and bases are in bulk and the acid/base state of the species of interest is controlled by the p. H (ex: indicators)

1 a. Buffer p. H What is the p. H of a solution with [H 2 CO 3] = 0. 25 M and [HCO 3 -] = 0. 25 M?

1 b. Buffer p. H What is the p. H of a solution with [H 2 CO 3] = 0. 25 M and [HCO 3 -] = 0. 11 M?

p. H Titration Curves Strong Acid – Strong Base – Strong Acid

p. H Titration Curves Weak Acid – Strong Base: Finding Ka

p. H Titration Curves Strong Acid – Weak Base: Finding Ka

Polyprotic p. H Titration Curves 14 12 10 p. H 8 6 4 2 0 0 5 10 15 20 m. L of base 25 30 35 40 45


When p. H Controls Acid-Base State: Amino Acids Situations where an acid-base species is a minor component in a solution where other things control the p. H. Henderson-Hasselbalch and Alpha plots.

When p. H Controls Acid-Base State: Amino Acids Situations where an acid-base species is a minor component in a solution where other things control the p. H = 0. 00 p. H = 2. 34

p. H = 0. 00 p. H = 9. 60 p. H = 2. 34 p. H = 13. 00 p. H = 7. 00

Alpha Plots
- Slides: 23