Dyscalculi UM A FirstLine Screener for Dyscalculia in

- Slides: 57
Dyscalculi. UM: A First-Line Screener for Dyscalculia in Higher Education Clare Trott and Nigel Beacham Mathematics Education Centre, Loughborough University September 2006 Neurodiversity Conference De. Montfort University
Definition There is currently no accepted definition of dyscalculia A number of different definitions exist • Numerically based • Cognitive based • Neuroscience based
• The DSM-IV document, used by educational psychologists, defines Mathematics disorder in term of test scores: "as measured by a standardised test that is given individually, the person's mathematical ability is substantially less than would be expected from the person’s age, intelligence and education. This deficiency materially impedes academic achievement or daily living"
Two Important Features 1. Mathematical level compared to expectation 2. Impedance of academic achievement and daily living
More precise specification (Mahesh Sharma) “Dyscalculia is an inability to conceptualise numbers, number relationships (arithmetical facts) and the outcomes of numerical operations (estimating the answer to numerical problems before actually calculating). ” The emphasis here being on conceptualisation rather than on the numerical operations
The National Numeracy Strategy The Df. ES (2001) " Dyscalculia is a condition that affects the ability to acquire arithmetical skills. Dyscalculic learners may have difficulty understanding simple number concepts, lack an intuitive grasp of numbers, and have problems learning number facts and procedures. Even if they produce a correct answer or use a correct method, they may do so mechanically and without confidence. "
• Currently used by the BDA • Perhaps more applicable to education in the early years • In H. E. emphasis is less on basic computation and more on the application and understanding of skills and techniques
Our Working Definition “Dyscalculic students have a low level of numerical or mathematical competence compared to expectation. This expectation being based on unimpaired cognitive and language abilities and occurring within the normal range. The deficit will severely impede their academic progress or daily living.
Dyscalculia is therefore an inability to effectively connect with number and mathematics. It may include difficulties recognising, reading, writing or conceptualising numbers, understanding numerical or mathematical concepts and their inter-relationships.
It follows that dyscalculics may have difficulty with numerical operations, both in terms of understanding the process of the operation and in carrying out the procedure. Further difficulties may arise in understanding the systems that rely on this fundamental understanding, such as time, money, direction and more abstract mathematical, symbolic and graphical representations. ”
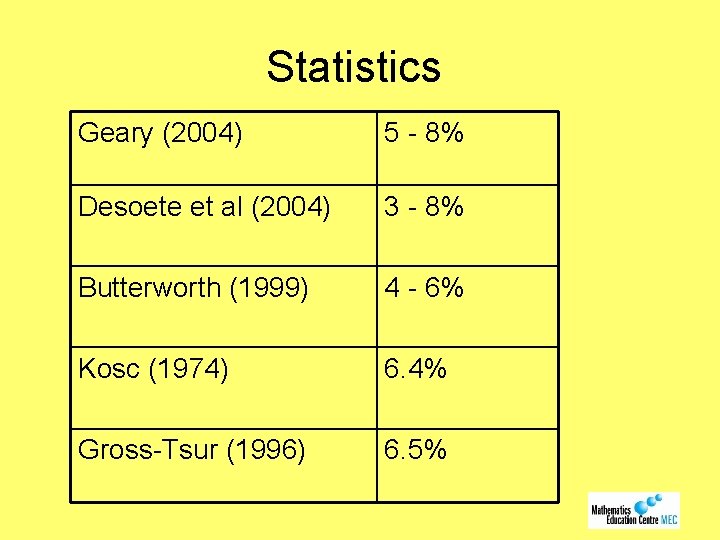
Statistics Geary (2004) 5 - 8% Desoete et al (2004) 3 - 8% Butterworth (1999) 4 - 6% Kosc (1974) 6. 4% Gross-Tsur (1996) 6. 5%
Kerry • Sent to MLSC by her tutor, suggesting dyscalculia • Detailed interview and look at work folder • Very basic difficulties with understanding simple % • LHS of the formula did not co-exist with the RHS
• Dyslexia screening - negative result • However, fundamental problems still remained • Much discussion • Kerry sent to Educational Psychologist who confirmed dyscalculia (no dyslexia) • Highlighted urgent need for screener
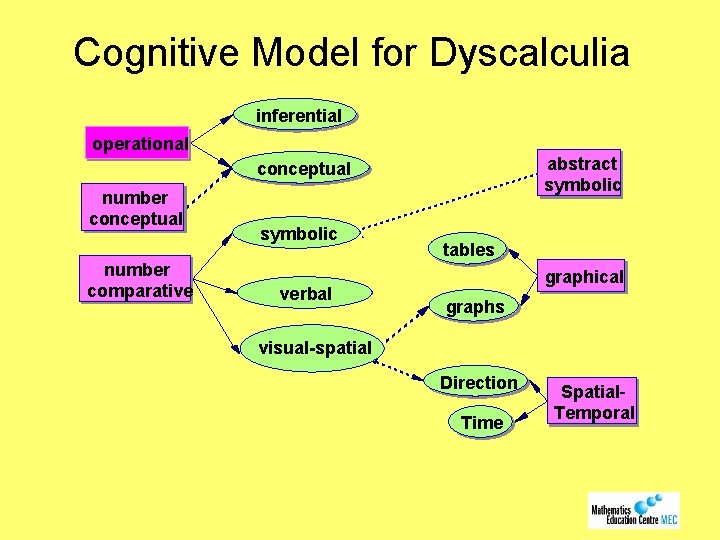
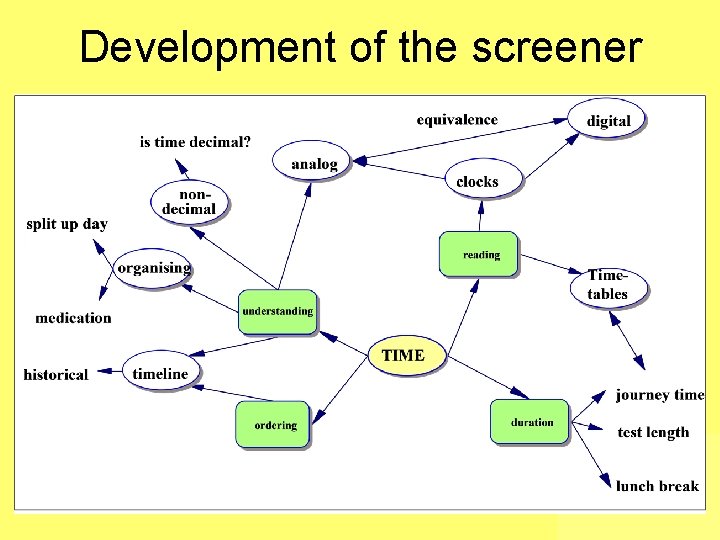
Cognitive Model for Dyscalculia inferential operational abstract symbolic conceptual number comparative symbolic verbal tables graphical graphs visual-spatial Direction Time Spatial. Temporal
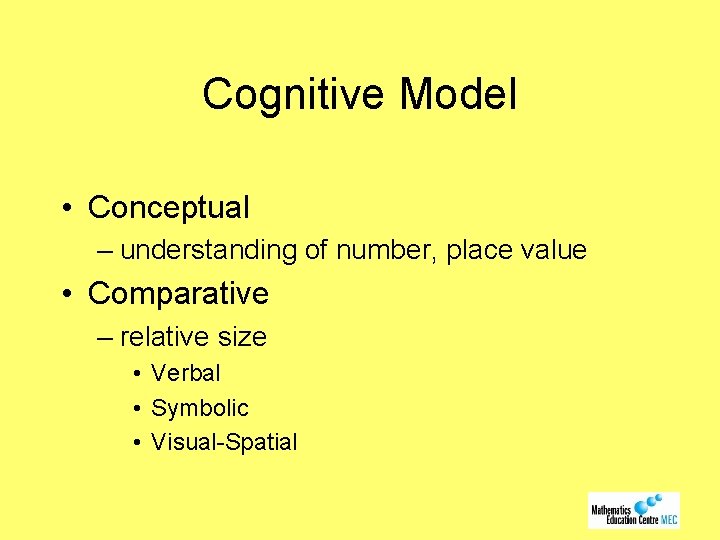
Cognitive Model • Conceptual – understanding of number, place value • Comparative – relative size • Verbal • Symbolic • Visual-Spatial
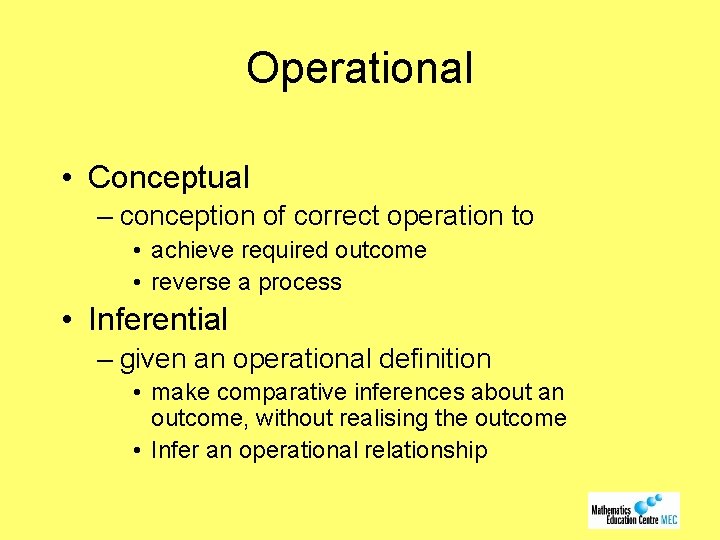
Operational • Conceptual – conception of correct operation to • achieve required outcome • reverse a process • Inferential – given an operational definition • make comparative inferences about an outcome, without realising the outcome • Infer an operational relationship
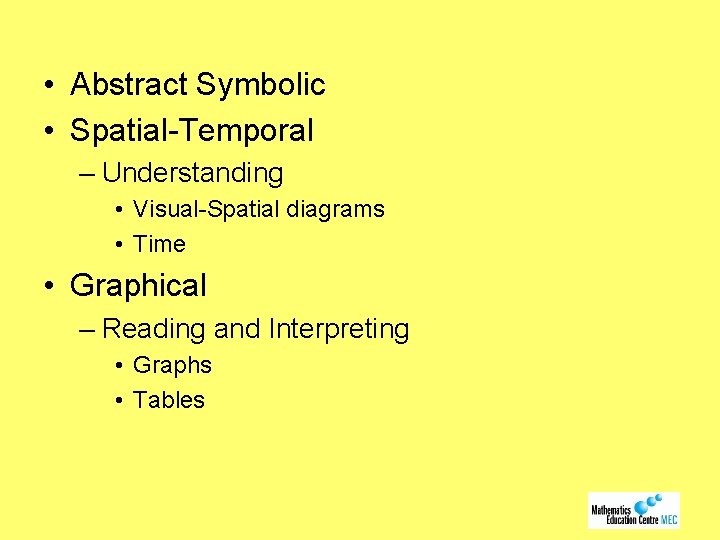
• Abstract Symbolic • Spatial-Temporal – Understanding • Visual-Spatial diagrams • Time • Graphical – Reading and Interpreting • Graphs • Tables
Phase One Developing the Dyscalculia Screening Test
Development of the screener
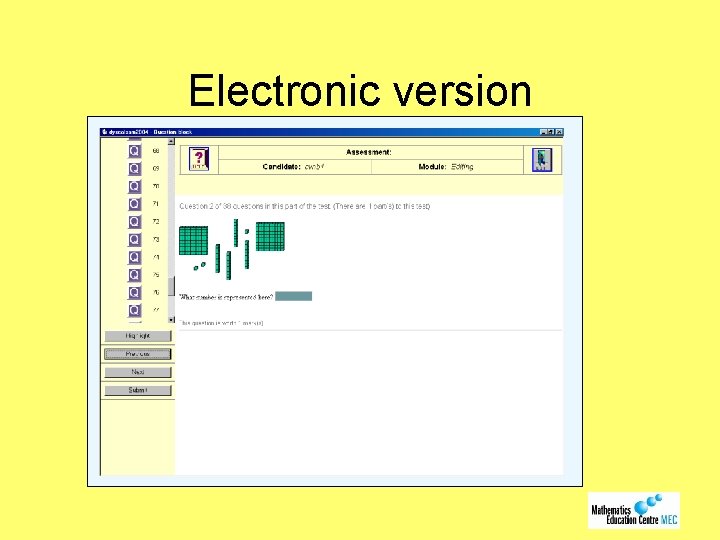
• Available in both paper and electronic versions • Electronic version produced on CD-ROM • Electronic version developed in Perception
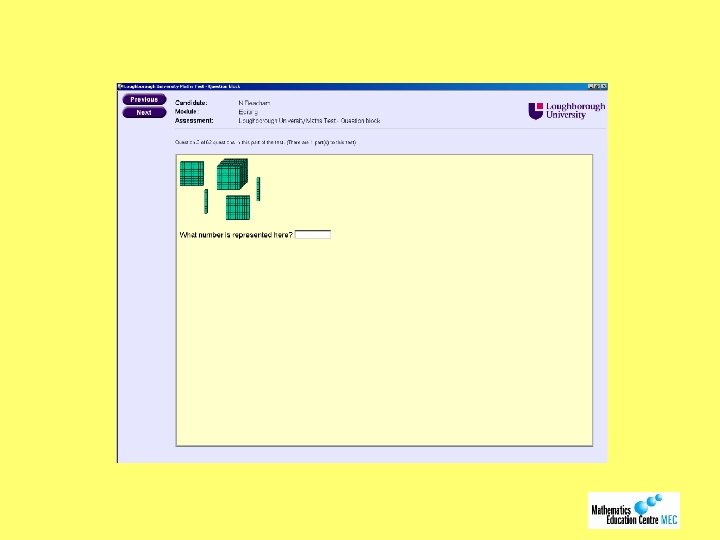
Electronic version
Phase Two Initial Trials
• 19 students • Dyscalculic only, dyslexic only, no Sp. LD • Showed no difference between paper and electronic versions
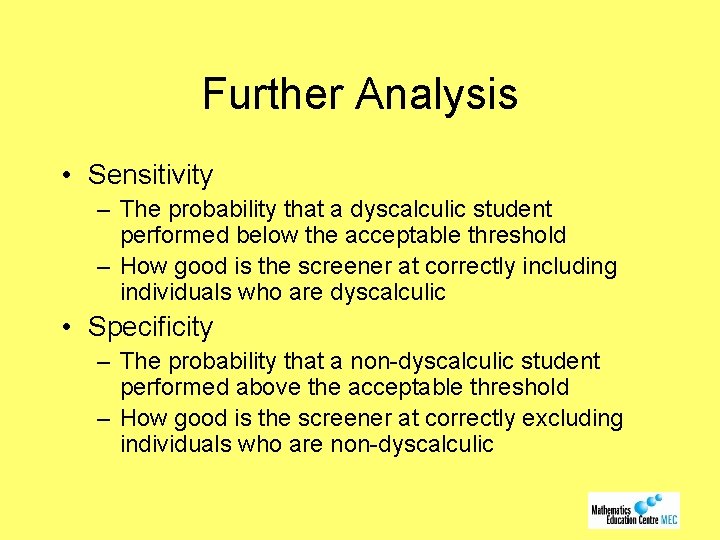
Further Analysis • Sensitivity – The probability that a dyscalculic student performed below the acceptable threshold – How good is the screener at correctly including individuals who are dyscalculic • Specificity – The probability that a non-dyscalculic student performed above the acceptable threshold – How good is the screener at correctly excluding individuals who are non-dyscalculic
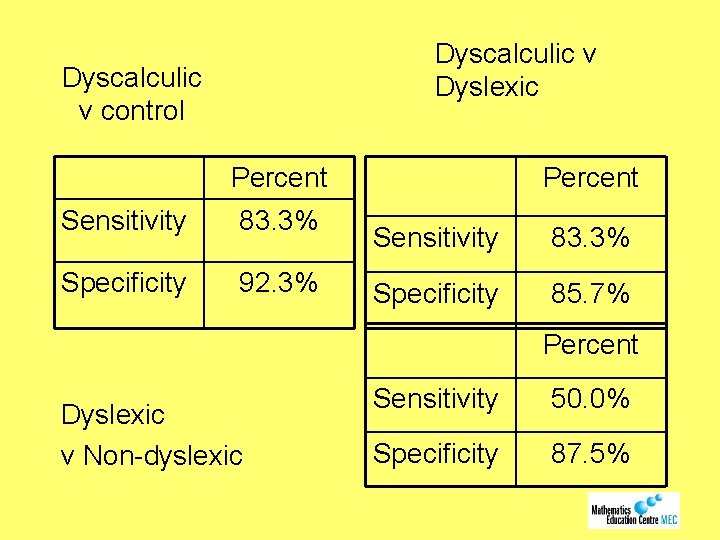
Dyscalculic v Dyslexic Dyscalculic v control Percent Sensitivity 83. 3% Specificity 92. 3% Percent Sensitivity 83. 3% Specificity 85. 7% Percent Dyslexic v Non-dyslexic Sensitivity 50. 0% Specificity 87. 5%
Modifications • Background colour • Removed timer • Scrolling and layout • Submit button
Phase Three Further Trials
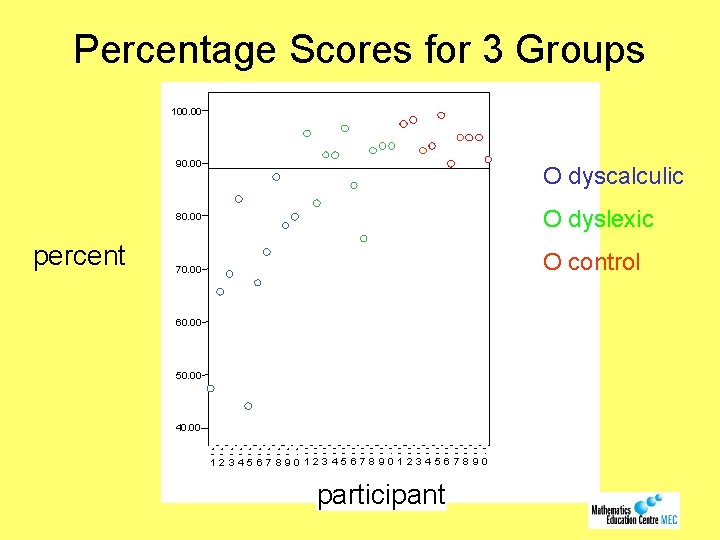
Phase Three Trials • Involved 30 participants • Organised into three equal groups – Dyscalculic – Dyslexic – Control • Covered a range of academic subjects • Observation carried out • Covering 4 HEIs
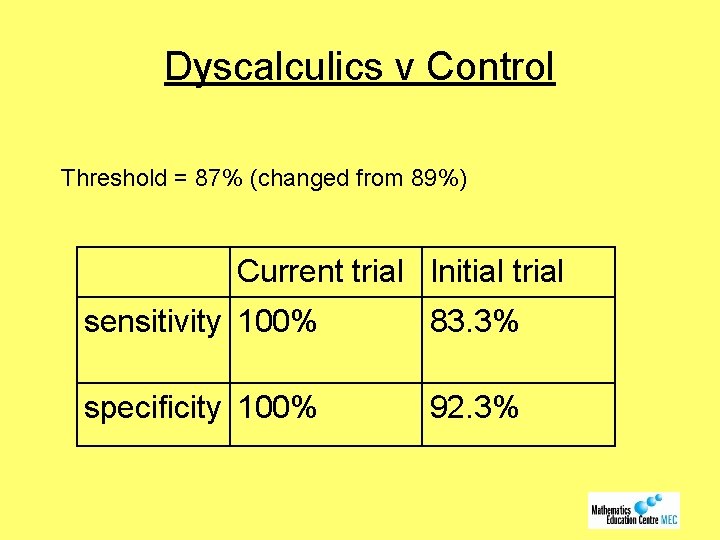
Dyscalculics v Control Threshold = 87% (changed from 89%) Current trial Initial trial sensitivity 100% 83. 3% specificity 100% 92. 3%
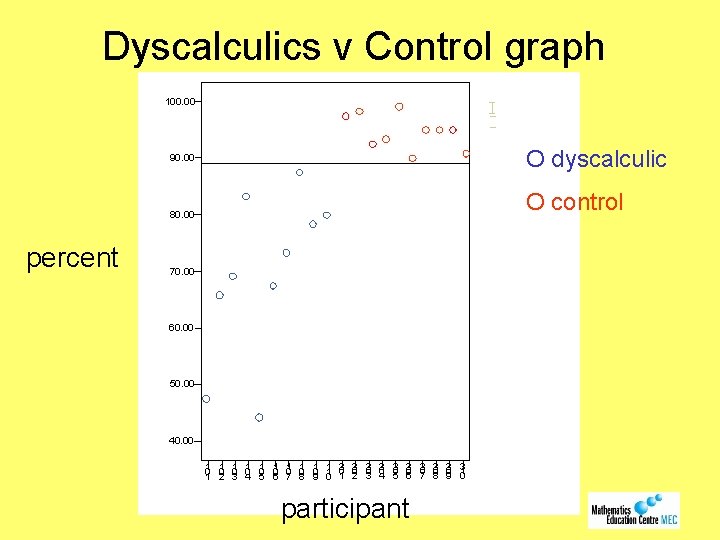
Dyscalculics v Control graph 100. 00 O dyscalculic 90. 00 O control 80. 00 percent 70. 00 60. 00 50. 00 40. 00 1 1 1 1 1 3 3 0 3 0 3 1 0 0 0 0 0 1 2 3 4 5 6 7 8 9 0 participant
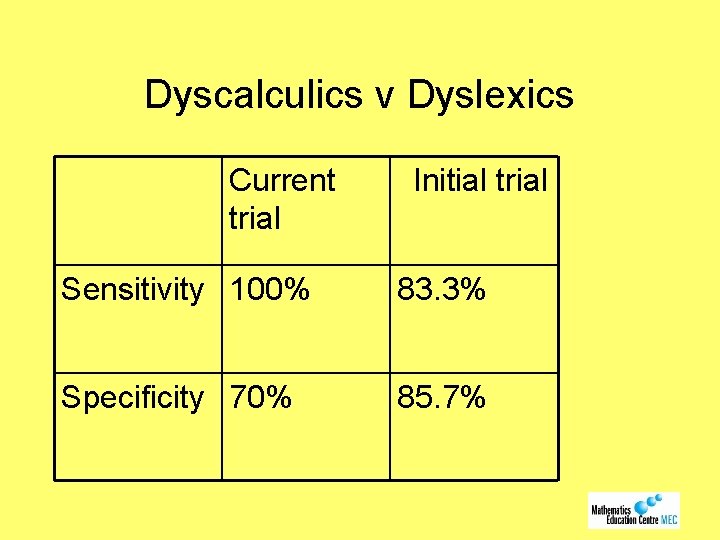
Dyscalculics v Dyslexics Current trial Initial trial Sensitivity 100% 83. 3% Specificity 70% 85. 7%
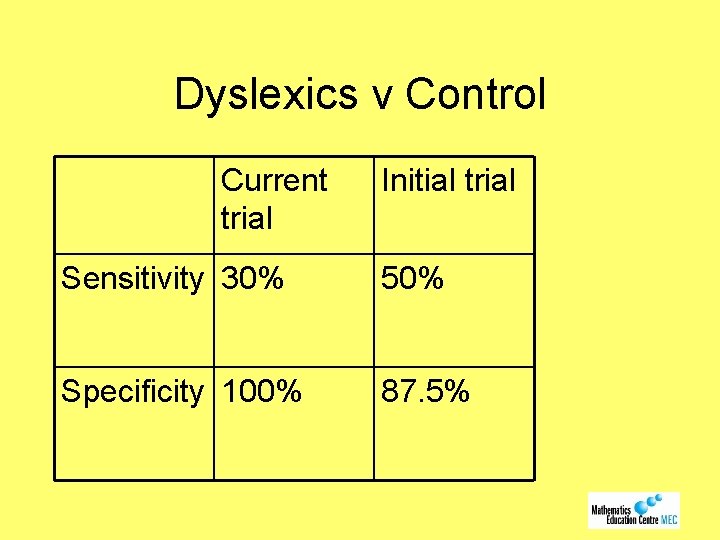
Dyslexics v Control Current trial Initial trial Sensitivity 30% 50% Specificity 100% 87. 5%
Percentage Scores for 3 Groups 100. 00 90. 00 O dyscalculic O dyslexic 80. 00 percent O control 70. 00 60. 00 50. 00 40. 00 22 2 223 33 3 3 33 1 1 11 2 00 0 010 00 0 0 01 0 0 00 0 01 0 1 2 34 5 67 8 90 1 23 4 5 67 8 901 23 4 56 7 8 90 participant
Examples from Dyscalculi. UM • Decimals • Direction • Bar graph • Interval bisection • Towards abstraction
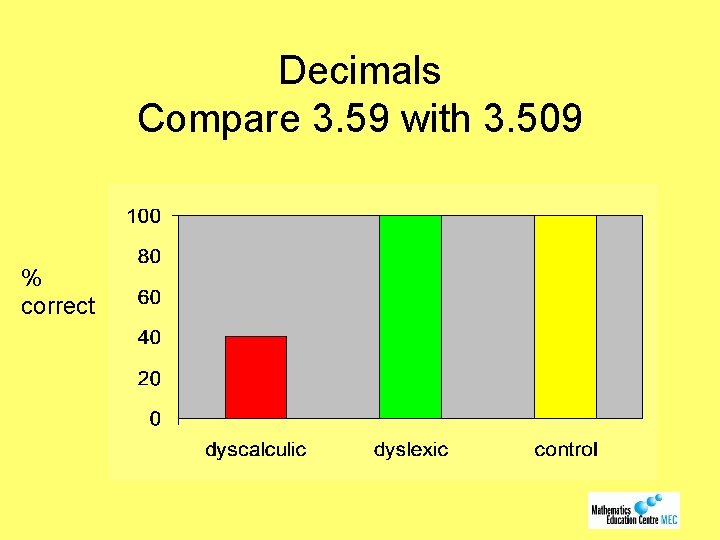
Decimals Compare 3. 59 with 3. 509 % correct
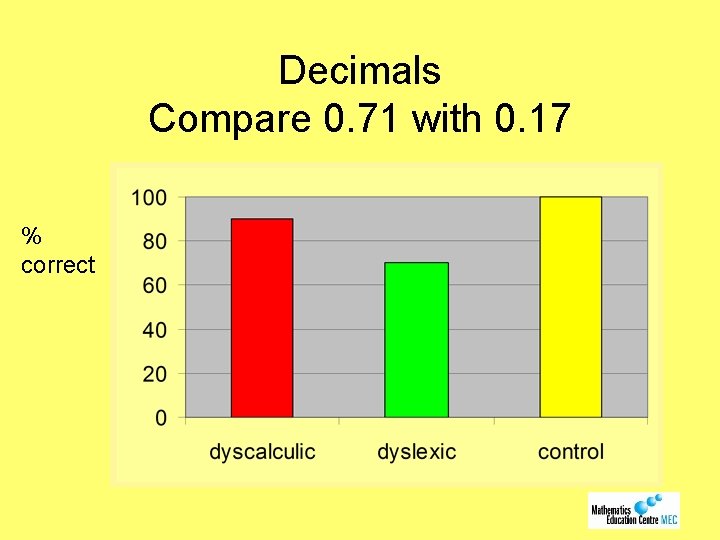
Decimals Compare 0. 71 with 0. 17 % correct
Direction “It makes for interesting travel as I've missed countless trains and buses or got on the wrong train on the wrong platform at the wrong time. Travel directions have to be written in minute detail as I have no understanding of the motorway network and anything more than 'take the next left' goes in one ear and out the other. I can get lost in a box. " J. Blackburn “Damn the Three Times Table” http: //ddig. lboro. ac. uk/pages/ideas_exchange. html
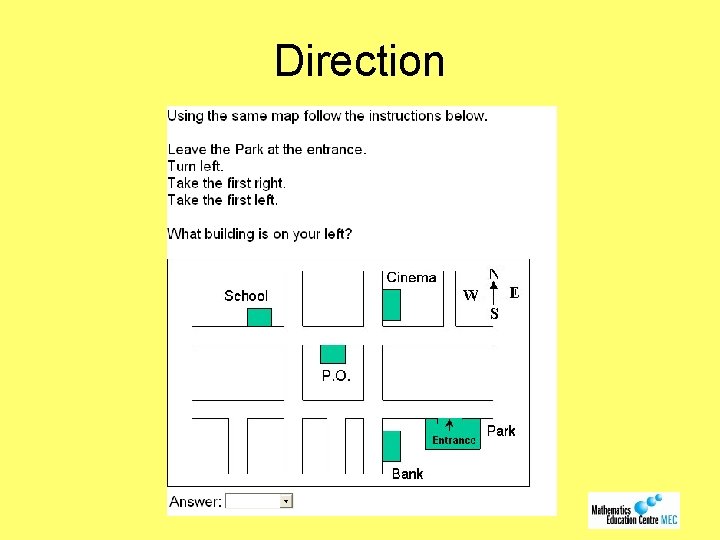
Direction
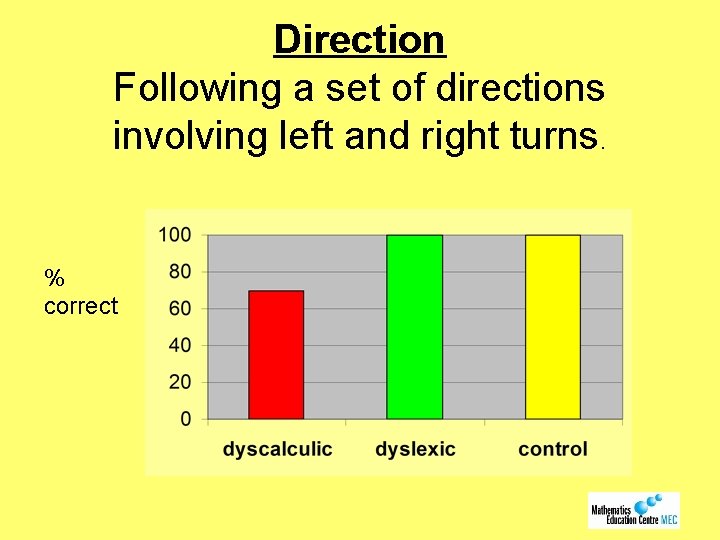
Direction Following a set of directions involving left and right turns. % correct
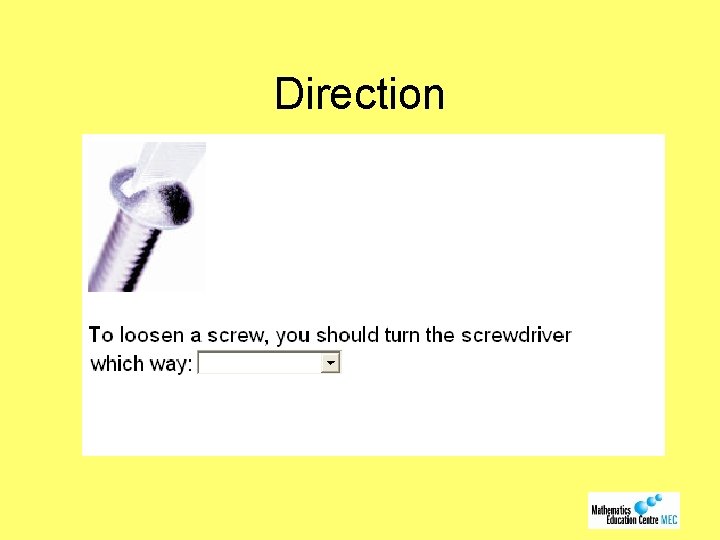
Direction
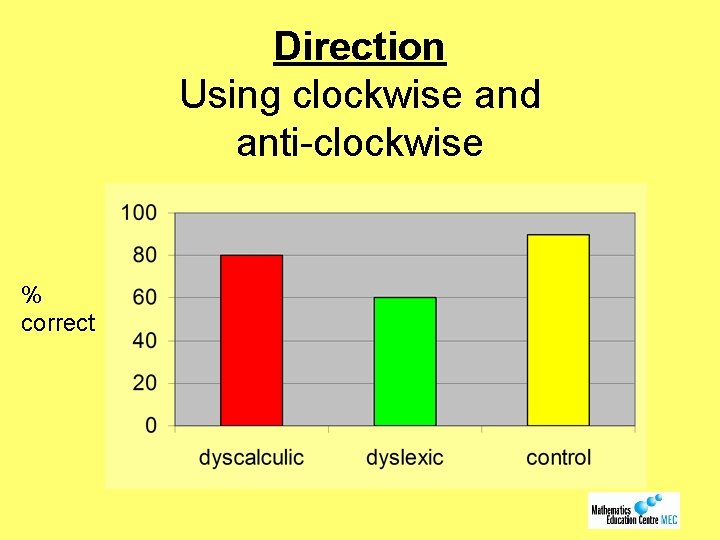
Direction Using clockwise and anti-clockwise % correct
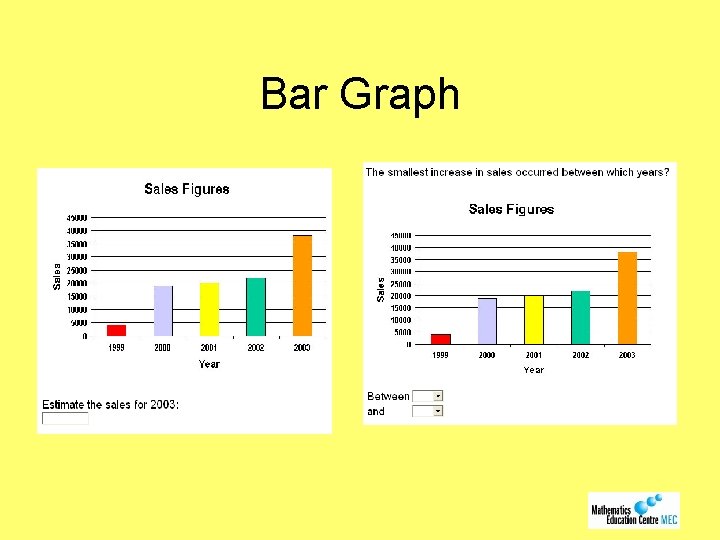
Bar Graph
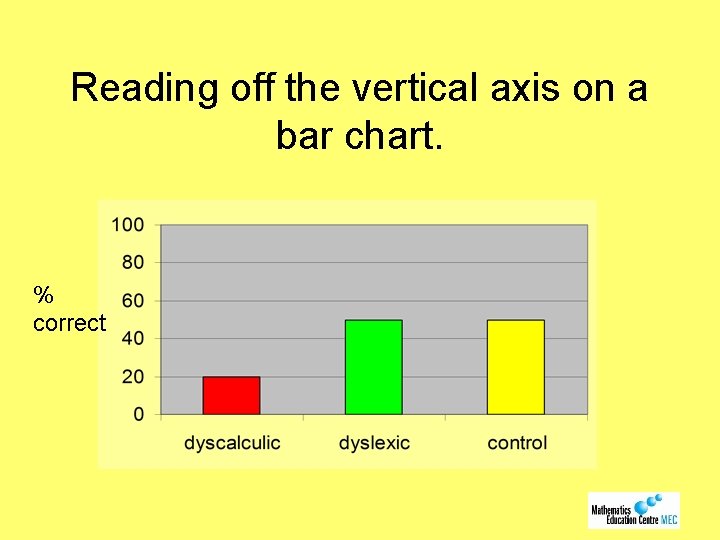
Reading off the vertical axis on a bar chart. % correct
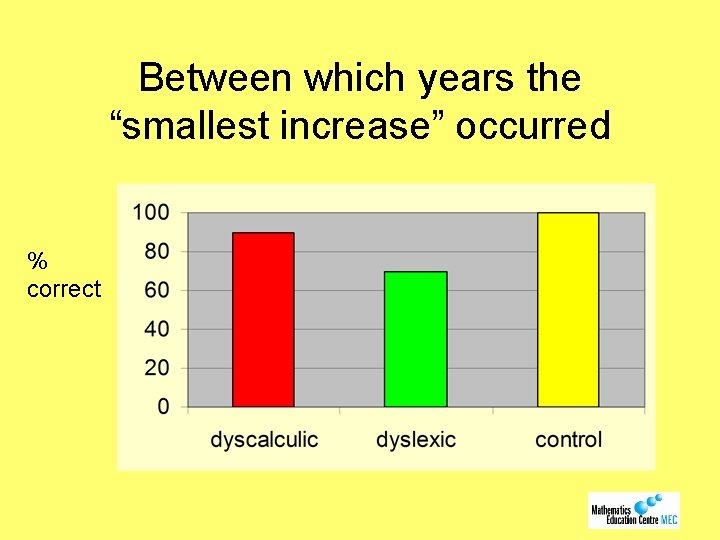
Between which years the “smallest increase” occurred % correct
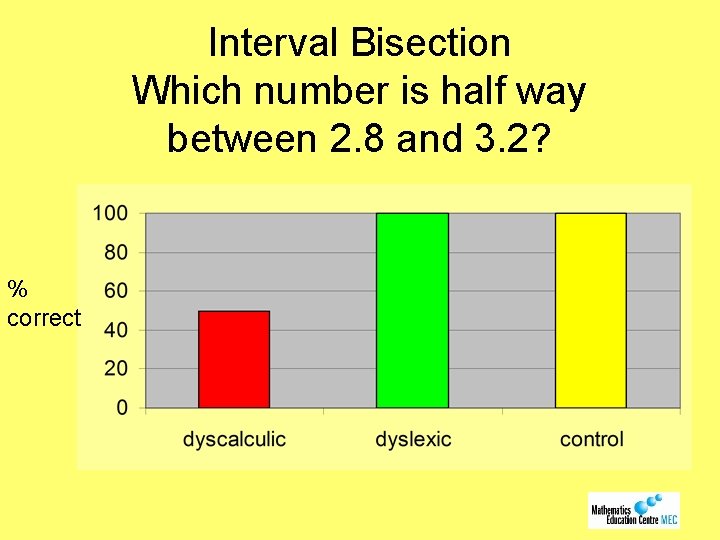
Interval Bisection Which number is half way between 2. 8 and 3. 2? % correct
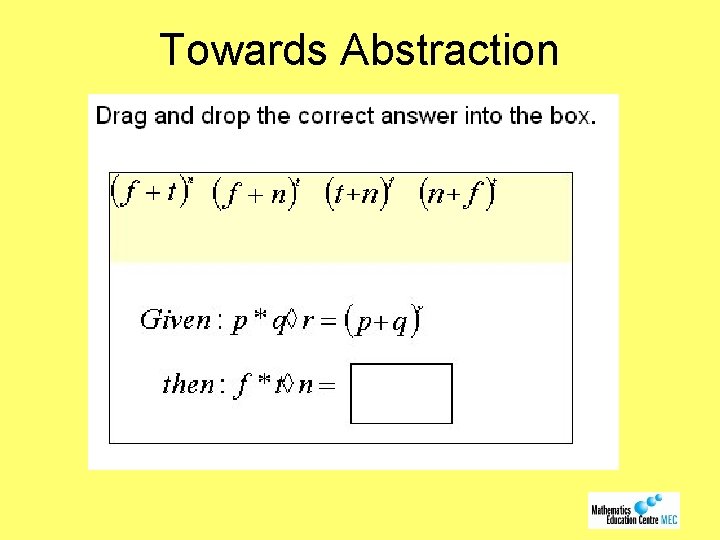
Towards Abstraction
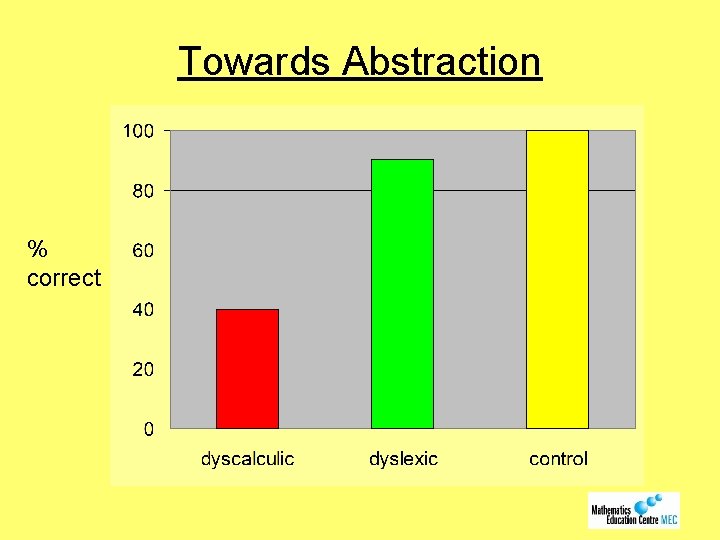
Towards Abstraction % correct
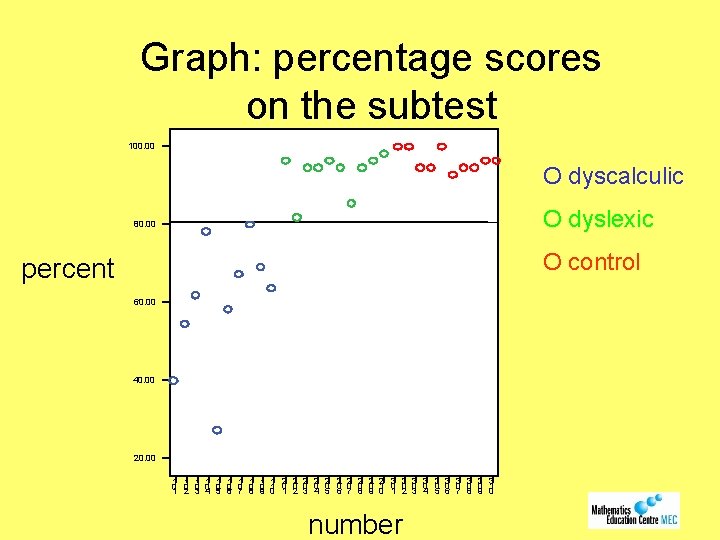
Subtest • Takes ≤ 48 minutes • Use for screening process with other tools • Eliminate items with poor discrimination • Eliminate items that impede students with dyslexia • Subtest consists of 61 items and takes approx. 20 -25 mins
Graph: percentage scores on the subtest 100. 00 O dyscalculic O dyslexic 80. 00 O control percent 60. 00 40. 00 2 2 2 2 2 3 3 3 3 3 1 1 1 1 1 2 0 0 0 0 1 0 0 0 0 0 1 0 1 2 3 4 5 6 7 8 9 0 number
Phase Four More Trials
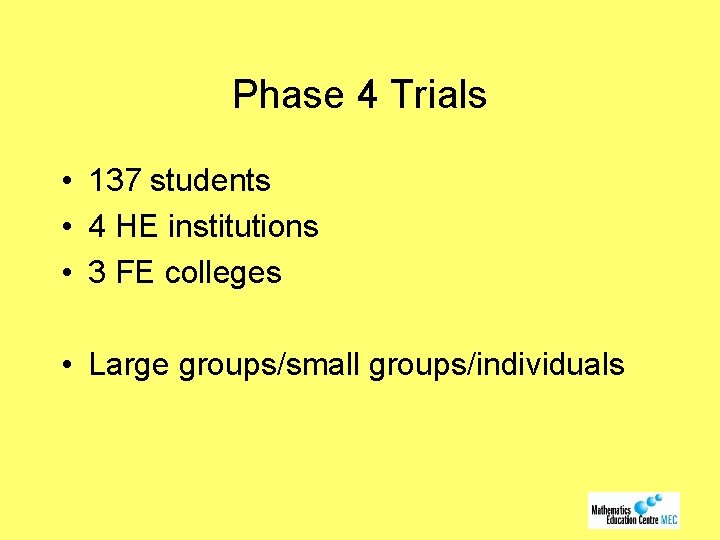
Phase 4 Trials • 137 students • 4 HE institutions • 3 FE colleges • Large groups/small groups/individuals
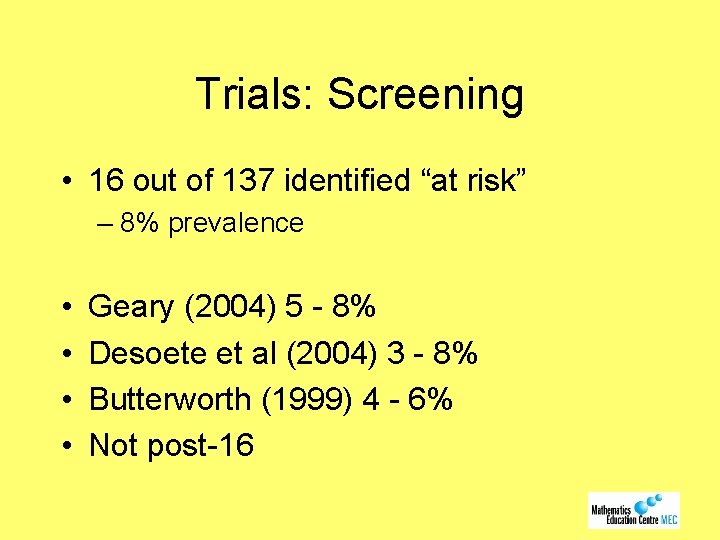
Trials: Screening • 16 out of 137 identified “at risk” – 8% prevalence • • Geary (2004) 5 - 8% Desoete et al (2004) 3 - 8% Butterworth (1999) 4 - 6% Not post-16
Further Issues • English not first language – 2 out of 5 “at risk” – Mathematical or language difficulties? • Neurodiversity – Dyslexia, Asperger’s Syndrome, ADHD, Dyspraxia • More research needed
Summary • • Provides an effective screening tool for HE Discriminates dyscalculia from dyslexia Easily accommodated into screening process Large or small groups or individuals Future • Extensive trials in Autumn 2006 • Profile reporting, based on cognitive model
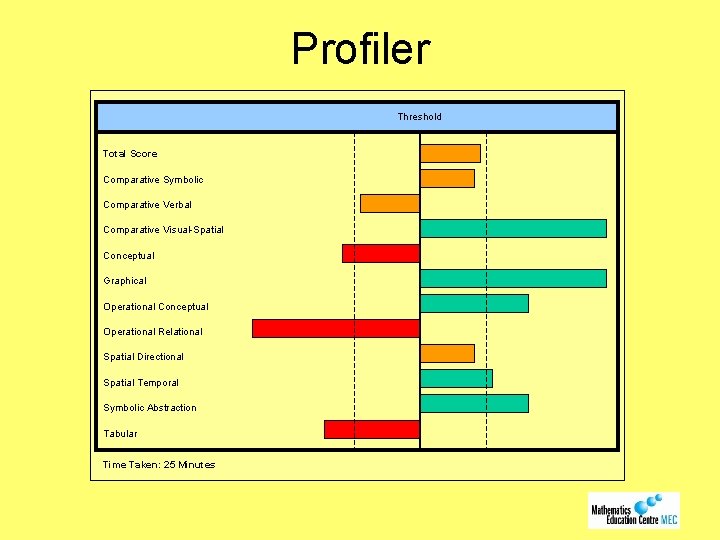
Profiler Threshold Total Score Comparative Symbolic Comparative Verbal Comparative Visual-Spatial Conceptual Graphical Operational Conceptual Operational Relational Spatial Directional Spatial Temporal Symbolic Abstraction Tabular Time Taken: 25 Minutes
References Beacham, N. and Trott, C. (2006) Project Update, Widening the use of Dyscalculi. UM: A first-line screening test for dyscalculia in Higher Education, MSOR Connections, Vol 6 No 1. Beacham, N. and Trott, C. (2005) Screening for Dyscalculia within Higher Education, MSOR Connections Vol 5 No 1. Butterworth, B. (1999) The Mathematical Brain. London: Macmillan. Desoete, A. , Roeyers, H. & De Clercq, A. (2004) Children with Mathematics Learning Disabilities in Belgium, Journal of Learning Disabilities, 37, 50 -61. Df. ES (2001) The National Numeracy Strategy, Guidance to support pupils with dyslexia and dyscalculia Df. ES 0512/2001 Geary, D. C. (2004) Mathematics and Learning Disabilities. Journal of Learning Disabilities, 37, 4 -15 Gross-Tsur, V. , Manor, O. and Shalev R. S. (1996) Developmental Dyscalculia: prevalence and demographic features. Developmental Medicine and Child Neurology. 38, 25 -33 Kosc, L. (1974) Developmental Dyscalculia. Journal of Learning Disabilities, 7, 46 -59 Sharma, M. (1997) Dyscalculia. http: //www. dyscalculia. org/Berkshire. Math. html