ALVEOLAR VENTILATION PERFUSION KEY POINTS ALVEOLAR VENTILATIONV A

 ALVEOLAR PERFUSIONPULMONARY CIRCULATION (Q) VENTILATION – PERFUSION RATIO (VA/Q)")


![Ventilation pattern - VA • Pleural pressure [Ppl] increased towards lower zone • Constricted](https://slidetodoc.com/presentation_image/3e4afa4e5f0128661d72cb662caa3b94/image-9.jpg "Ventilation pattern - VA • Pleural pressure [Ppl] increased towards lower zone • Constricted")


")


- Slides: 35
ALVEOLAR VENTILATION PERFUSION
KEY POINTS ALVEOLAR VENTILATION–(V A) ALVEOLAR PERFUSIONPULMONARY CIRCULATION (Q) VENTILATION – PERFUSION RATIO (VA/Q) VENTILATION PERFUSION MISMATCH SHUNT DEAD SPACE
Pulmonary Perfusion Pulmonary blood flow 5 l/min Total pulmonary blood volume 500 ml to 1000 ml These volume going to be spreaded all along the alveolar capillary membrane which has 50 to 100 m² surface area
Pulmonary Perfusion Pulmonary blood flow 5 l/min Total pulmonary blood volume 500 ml to 1000 ml These volume going to be spreaded all along the alveolar capillary membrane which has 50 to 100 m² surface area
Distribution of Pulmonary Perfusion Due to gravitational influence the lower – dependent areas receive more blood Upper zone – nondependent areas are less per fused
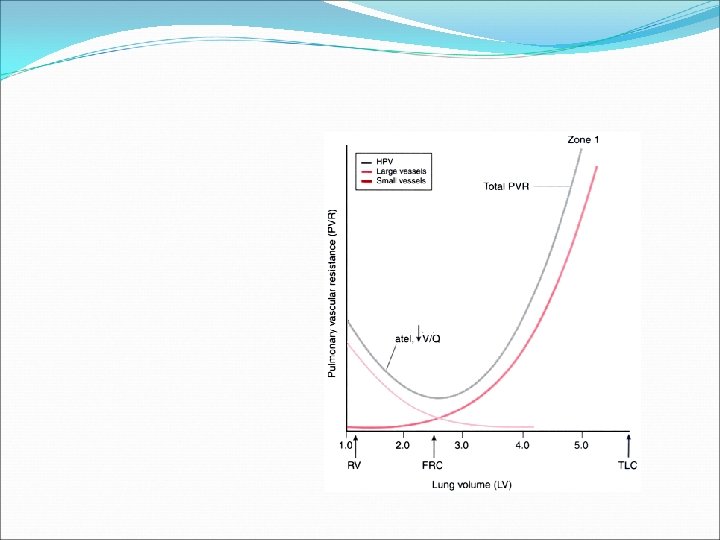
Pulmonary circulation – Alveolar Perfusion Q ZONE-I: Only exist if Ppa very low in hypovolemia / PA in PEEP ZONE-II: Perfusion α Ppa-PA arterial-alveolar gradient ZONE-III: Perfusion α Ppa-Ppv arterial-venous gradient ZONE-IV: Perfusion α Ppa-Pist arterial-interstitial gradient
Ventilation is unevenly distributed in the lungs. Rt lung more ventilated than Lt lung [53% & 47%] Due to gravitational influence on intra plural pr [decreased 1 cm/H 2 O per 3 cm decrease in lung height] lower zones better ventilated
Ventilation -6 Due to gravitational influence on intra plural pr [decreased 1 cm/H 2 O per 3 cm decrease in lung height] lower zones better ventilated -3 -1 Intra pleural pr
Ventilation pattern - VA • Pleural pressure [Ppl] increased towards lower zone • Constricted alveoli in lower zones & distended alveoli in upper zones • More compliant alveoli towards lower zone • Ventilation: distributed more towards lower zone
Ventilation pattern - VA • Upper zone: less pleural pressure, distended more & hence less compliant • Lower zone: more pleural pressure, less distended, & hence more compliant
Ventilation Minute Ventilation V = RR x VT Volume of the inspired gas participating in alveolar gas exchange /minute is called ALVEOLAR VENTILATION-VA VA = RR x VT-VD Not all inspired gas participating in alveolar gas exchange DEAD SPACE – VD Some gas remains in the non respiratory airways ANATOMIC DEAD SPACE Some gas in the non per fused /low per fused alveoli PHYSIOLOGIC DEAD SPACE
Distribution of Ventilation Lower zone i. e. dependent part of alveoli are better ventilated than the middle & upper zones i. e. nondependent
Ventilation Dead space ventilation - wasted ventilation of unperfused alveoli Dead space VD = 2 ml/kg ; 1 ml /pound Dead space ratio VD/ VT = 33% VD VT = PACO 2 – PECO 2 PACO 2
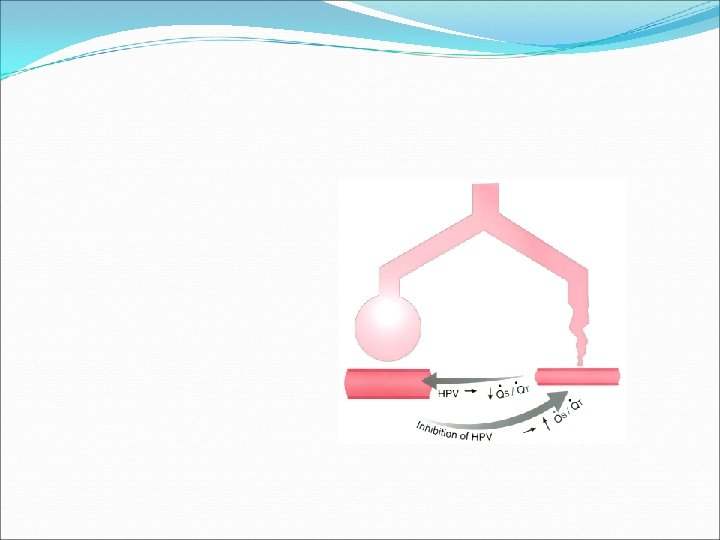
Ventilation Perfusion ratio VA/Q • Ventilation & Perfusion both are distributed more towards lower zone. • Ventilation[VA] less increased t 0 wards l 0 wer zone than Perfusion[Q] • Perfusion more increased towards Lower zone than Ventilation • Ventilation Perfusion ratio VA/Q: Less towards lower zone VA/Q Q VA
Ventilation Perfusion ratio VA/Q • Ventilation & Perfusion both are distributed more towards lower zone. • Ventilation[VA] less increased t 0 wards l 0 wer zone than Perfusion[Q] • Perfusion more increased towards Lower zone than Ventilation • Ventilation Perfusion ratio VA/Q: Less towards lower zone VA/Q Q VA
VENTILATION PERFUSION RATIO V Q Q Wasted ventilation V=normal Q=0 V/Q=∞ DEAD SPACE V Normal V&Q V/Q=1 IDEAL ALVEOLI Wasted Perfusion V=o Q= normal V/Q=0 SHUNT
Ventilation Perfusion ratio VA/Q The overall V/Q = 0. 8 [ ven=4 lpm, per=5 lpm] Ranges between 0. 3 and 3. 0 Upper zone –nondependent area has higher ≥ 1 Lowe zone – dependent area has lower ≤ 1 VP ratio indicates overall respiratory functional status of lung V/Q = 0 means , no ventilation-called SHUNT V/Q = ∞ means , no perfusion – called DEAD SPACE
SHUNT V V/Q<1 Q Means – Wasted perfusion Shunt – 1. Absolute Shunt : Anatomical shunts – V/Q = 0 2. Relative shunt : under ventilated lungs –V/Q ≤ 1 Shunt estimated as Venous Admixture expressed as a fraction of total cardiac output Qs/Qt Qs = Cc. O 2 -Ca. O 2 Qt Cc. O 2 -Cv. O 2 Normal shunt- Physiologic shunt < 5%
SHUNT • SHUNTS have different effects on arterial PCO 2 (Pa. CO 2 ) than on arterial PO 2 (Pa. O 2 ). • Blood passing through under ventilated alveoli tends to retain its CO 2 and does not take up enough O 2. • Blood traversing over ventilated alveoli gives off an excessive amount of CO 2, but cannot take up increased amount of O 2 because of the shape of the oxygen-hemoglobin (oxy-Hb) dissociation curve. • Hence, a lung with uneven V P relationships can eliminate CO 2 from the over ventilated alveoli to compensate for the under ventilated alveoli. • Thus, with Shunt, PACO 2 -to-Pa. CO 2 gradients are small, and PAO 2 -to- Pa. O 2 gradients are usually large.
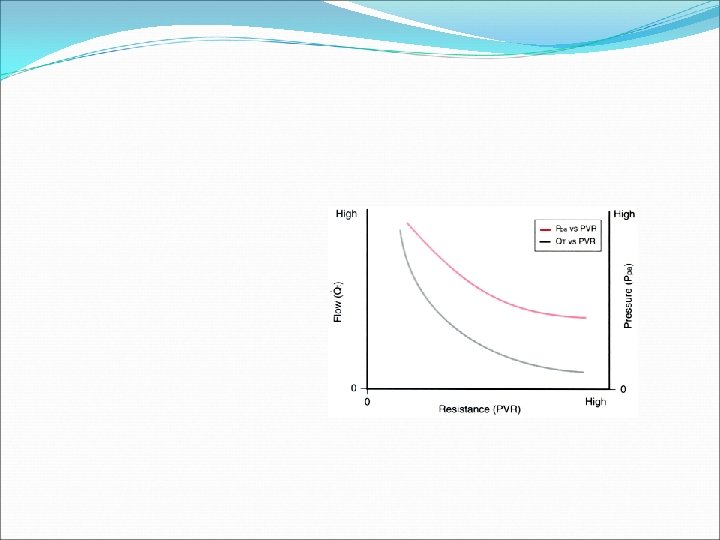
SHUNT • PAO 2 is directly related to FIO 2 in normal patients. • PAO 2 and FIO 2 also correspond to Pa. O 2 when there is little to no shunt. • With no S/T, a linear increase in FIO 2 results in a linear increase in Pa. O 2. • As the shunt is increased, the S/T lines relating FIO 2 to Pa. O 2 become progressively flatter. With a shunt of 50% of QT, an increase in FIO 2 results in almost no increase in Pa. O 2. • The solution to the problem of hypoxemia secondary to a large shunt is not increasing the FIO 2 , but rather causing a reduction in the shunt (fiberoptic bronchoscopy, PEEP, patient positioning, antibiotics, suctioning, diuretics).
SHUNT • PAO 2 is directly related to FIO 2 in normal patients. • PAO 2 and FIO 2 also correspond to Pa. O 2 when there is little to no shunt. • With no S/T, a linear increase in FIO 2 results in a linear increase in Pa. O 2. • As the shunt is increased, the S/T lines relating FIO 2 to Pa. O 2 become progressively flatter. With a shunt of 50% of QT, an increase in FIO 2 results in almost no increase in Pa. O 2. • The solution to the problem of hypoxemia secondary to a large shunt is not increasing the FIO 2 , but rather causing a reduction in the shunt (fiberoptic bronchoscopy, PEEP, patient positioning, antibiotics, suctioning, diuretics).
SHUNT
Pa. O 2 VIRTUAL SHUNT CURVES Fi. O 2
DEAD SPACE Not all inspired gas participating in alveolar gas exchange DEAD SPACE – VD Some gas remains in the non respiratory airways ANATOMIC DEAD SPACE Some gas in the non per fused /low per fused alveoli PHYSIOLOGIC DEAD SPACE
DEAD SPACE Means – Wasted Ventilation V V/Q= ∞ Q Dead Space estimated as ratio Vd/Vt Dead space expressed as a fraction of total tidal volume Vd/Vt Vd = PACO 2 -PECO 2 Vt PACO 2 Normal dead space ratio < 33%
QUANTIFICATION - SHUNT 1. SHUNT RATIO Qs = Cc. O 2 -Ca. O 2 Qt Cc. O 2 -Cv. O 2 2. MODIFIED = Cc. O 2 -Ca. O 2 [Cc. O 2 -Ca. O 2]+4 • • • Cc. O 2 -Pulmonary end capillary O 2 content • Ca. O 2 -Arterial O 2 content • Cv. O 2 -Mixed venous O 2 content Pc. O 2=PAO 2=Pi. O 2 -Pa. CO 2/0. 8 =Fi. O 2 x 6 Pi. O 2 =PB-PH 2 Ox. Fi. O 2 Ca. O 2 = O 2 carried by Hb + Dissolved O 2 in plasma = 1. 34 x Hb% x Sa. O 2 + 0. 003 x Pa. O 2
QUANTIFICATION - SHUNT 3. ALVEOLAR – ARTERIAL O 2 GRADIENT : PAO 2 -Pa. O 2 Varies with Fi. O 2 & age 7 -14 to 31 -56 mm Hg 4. ARTERIAL – ALVEOLAR RATIO : Pa. O 2/PAO 2 Fi. O 2 independent >0. 75 -normal 0. 40 -0. 75 -acceptable 0. 20 -0. 40– poor < 0. 20 –very poor
QUANTIFICATION - SHUNT 5. ARTERIAL O 2 INSPIRED O 2 RATIO : Pa. O 2/Fi. O 2 Normally >500 mm. Hg Acceptable 250 -500 P 00 r 100 -250 Terminal <100 LI Score: <300 ALI, <200 ARDS SAPS 2
QUANTIFICATION - SHUNT 6. ISO SHUNT TABLE Pa. O 2 7. VIRTUAL SHUNT DIAGRAGME Fi. O 2
QUANTIFICATION – DEAD SPACE 1. Vd = PACO 2 -PECO 2 Vt PACO 2 2. MV x Pa. CO 2 Body Wt <5 >8 -normal increased dead space 3. Pa. Co 2 - Et. CO 2 GRADIENT 2 -5 mm. Hg
DEAD SPACE
Ventilation Perfusion ratio VA/Q • V P inequalities have different effects on arterial PCO 2 (Pa. CO 2 ) than on arterial PO 2 (Pa. O 2 ). • Blood passing through under ventilated alveoli tends to retain its CO 2 and does not take up enough O 2. • Blood traversing over ventilated alveoli gives off an excessive amount of CO 2 but cannot take up a proportionately increased amount of O 2 because of the flatness of the oxygen-hemoglobin (oxy-Hb) dissociation curve in this region. • Hence, a lung with uneven V P relationships can eliminate CO 2 from the over ventilated alveoli to compensate for the under ventilated alveoli. • Thus, with uneven V P relationships, PACO 2 -to-Pa. CO 2 gradients are small, and PAO 2 -to-Pa. O 2 gradients are usually large.