What is statistics Statistics is the science of
- Slides: 37
What is statistics? • Statistics is the science of dealing with data. • Data is any type of info packaged in numerical form. • Common examples: Political polls, Health/medical studies
Some Basic Definitions • Population: collection of individuals or objects we want to study statistically • “What is the population to which the statistical statement applies? ” • N-value: how many individuals/objects there are in the population
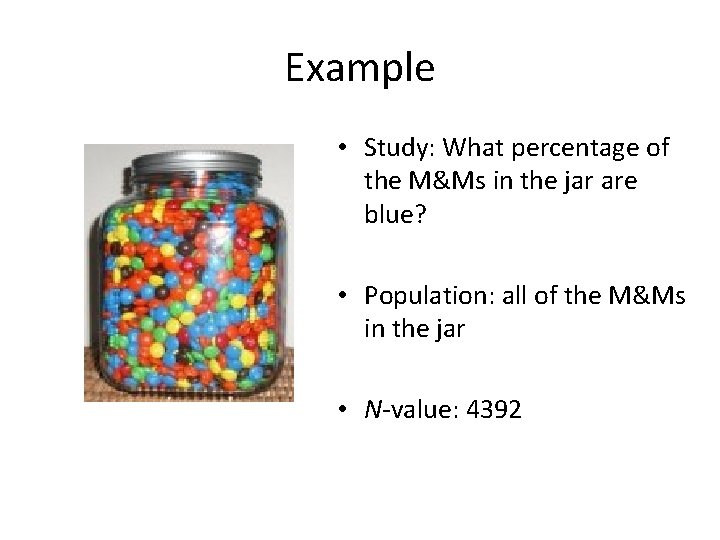
Example • Study: What percentage of the M&Ms in the jar are blue? • Population: all of the M&Ms in the jar • N-value: 4392
Census • Census: the process of collecting data by going through every member of the population • Our example: Count all M&Ms in the jar, count all of the blue ones, find percentage. • Drawbacks: – Expensive – Too much work – Almost impossible for large populations
Census vs Survey • Census: the process of collecting data by going through every member of the population • Survey: process of collecting data only from some members of the population (and use that data to draw conclusions & make inferences about the entire population) • Poll: data collection done by asking questions
Use samples! • Sample: a subgroup of the population chosen to provide the data • Sampling: the act of selecting a sample – Finding a good sample is EXTREMELY DIFFICULT!!!! • Sampling frame: the actual subset of the population from which the sample will be drawn
Example • Study: What percentage of our class likes cheeseburgers? • • Population: all members of our class N-value: 20 Sampling frame: all of the women in our class A Sample: all of the women in our class who are present today
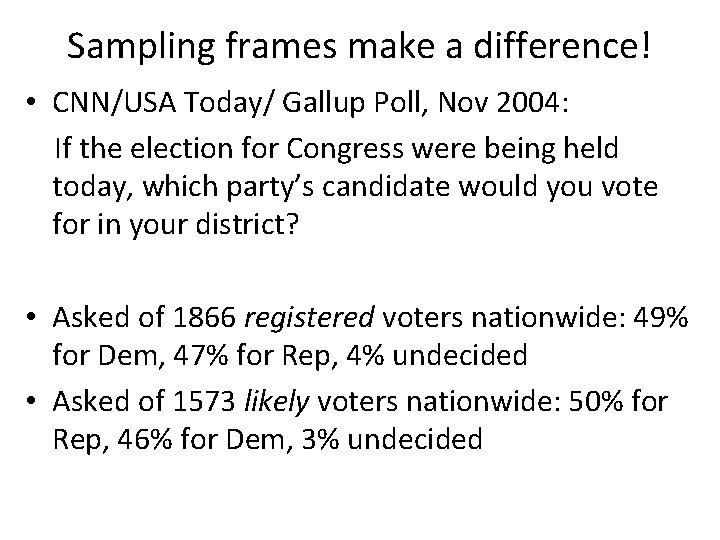
Sampling frames make a difference! • CNN/USA Today/ Gallup Poll, Nov 2004: If the election for Congress were being held today, which party’s candidate would you vote for in your district? • Asked of 1866 registered voters nationwide: 49% for Dem, 47% for Rep, 4% undecided • Asked of 1573 likely voters nationwide: 50% for Rep, 46% for Dem, 3% undecided
Representative Samples • When a population is highly homogeneous, a very small sample may be representative – Ex: blood samples, thoroughly mixed cake batter, etc • More heterogeneous populations -> more difficult to find representative samples
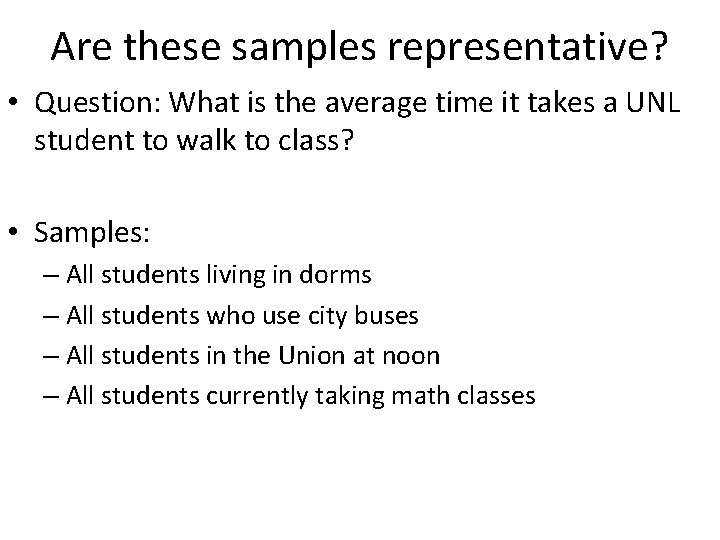
Are these samples representative? • Question: What is the average time it takes a UNL student to walk to class? • Samples: – All students living in dorms – All students who use city buses – All students in the Union at noon – All students currently taking math classes
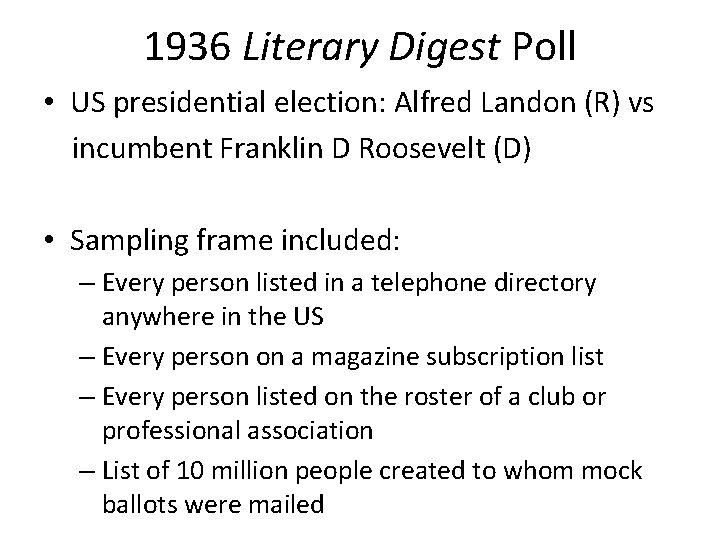
1936 Literary Digest Poll • US presidential election: Alfred Landon (R) vs incumbent Franklin D Roosevelt (D) • Sampling frame included: – Every person listed in a telephone directory anywhere in the US – Every person on a magazine subscription list – Every person listed on the roster of a club or professional association – List of 10 million people created to whom mock ballots were mailed
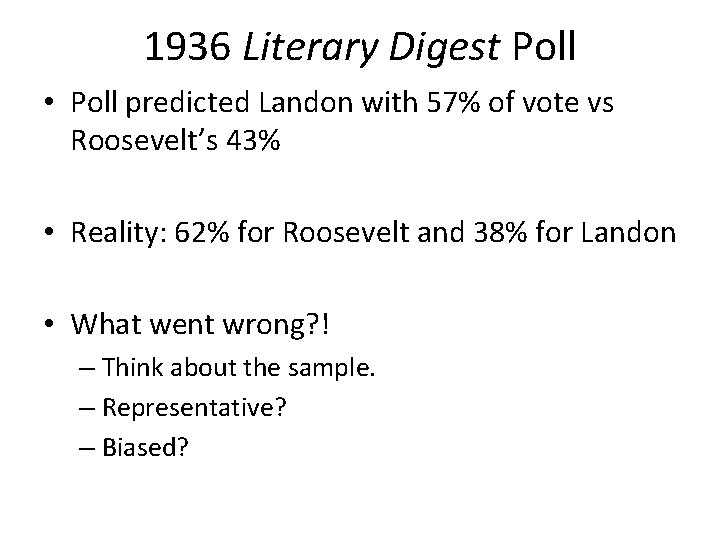
1936 Literary Digest Poll • Poll predicted Landon with 57% of vote vs Roosevelt’s 43% • Reality: 62% for Roosevelt and 38% for Landon • What went wrong? ! – Think about the sample. – Representative? – Biased?
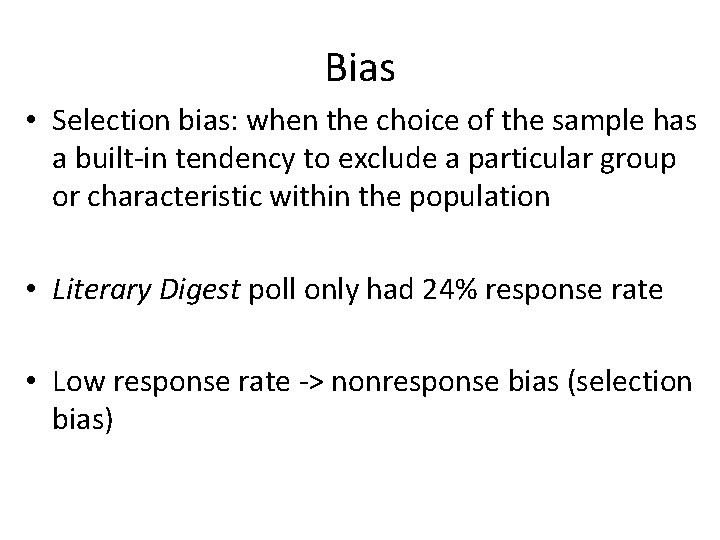
Bias • Selection bias: when the choice of the sample has a built-in tendency to exclude a particular group or characteristic within the population • Literary Digest poll only had 24% response rate • Low response rate -> nonresponse bias (selection bias)
Lots of different kinds of bias • Leading-question bias: – Are you in favor of paying higher taxes to bail the federal government out of its disastrous economic policies and its mismanagement of the federal budget? • Question order bias • Afraid to answer bias: – Have you ever cheated on your income taxes?
Morals • Bigger samples aren’t necessarily better samples! • Watch out for different types of bias! • A representative sample is key!
Lots of Sampling Methods • Convenience sampling: selection of individuals included in the sample is dictated by what is easiest or cheapest – Notoriously bad! – Ex: Want to know the average score on the last quiz? Sample: Look at the scores of the people sitting next to you. – Ex: Want to know how people feel about making the switch to the Big Ten? Sample: Set up a table outside of your house for people to come by and fill out questionnaire
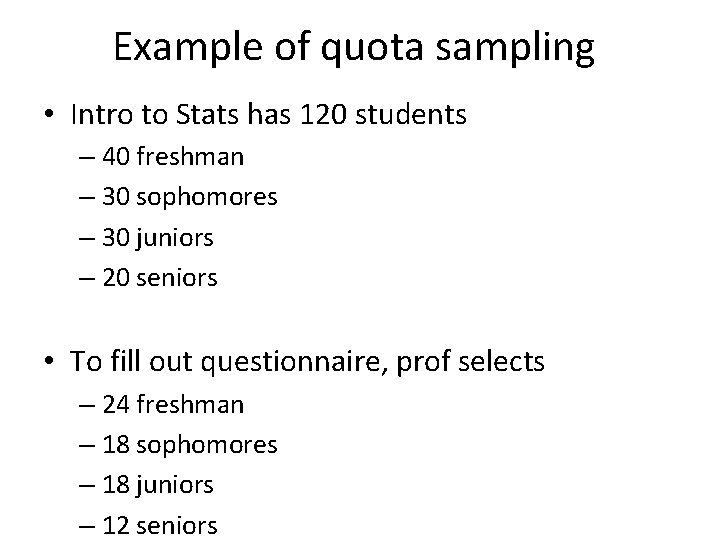
Quota sampling • Quota sampling: the sample should have so many women, so many Christians, so many Muslims, so many urbandwellers, so many rural farmers, etc • The proportions in each category in the sample should be the same as those in the population
Example of quota sampling • Intro to Stats has 120 students – 40 freshman – 30 sophomores – 30 juniors – 20 seniors • To fill out questionnaire, prof selects – 24 freshman – 18 sophomores – 18 juniors – 12 seniors
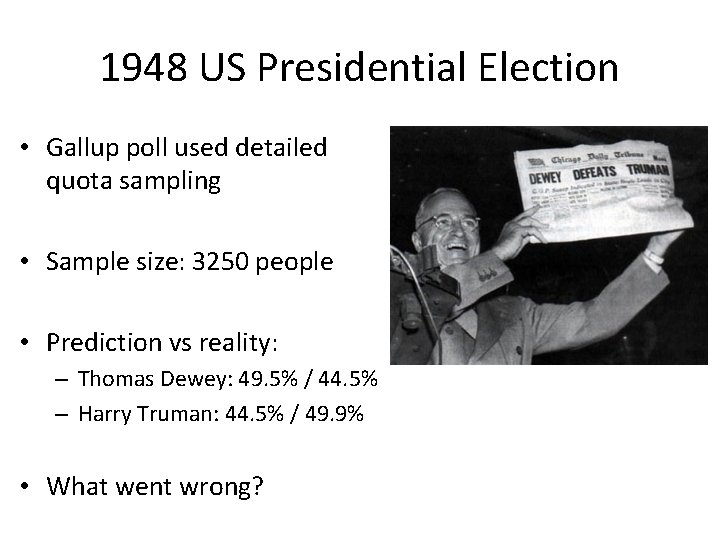
1948 US Presidential Election • Gallup poll used detailed quota sampling • Sample size: 3250 people • Prediction vs reality: – Thomas Dewey: 49. 5% / 44. 5% – Harry Truman: 44. 5% / 49. 9% • What went wrong?
Simple Random Sampling • SRS: all members of the population have an equal chance at being included in the sample • How were previous examples not SRS? • Examples of methods: – Pull names from a hat – Flip a coin – Random number generator
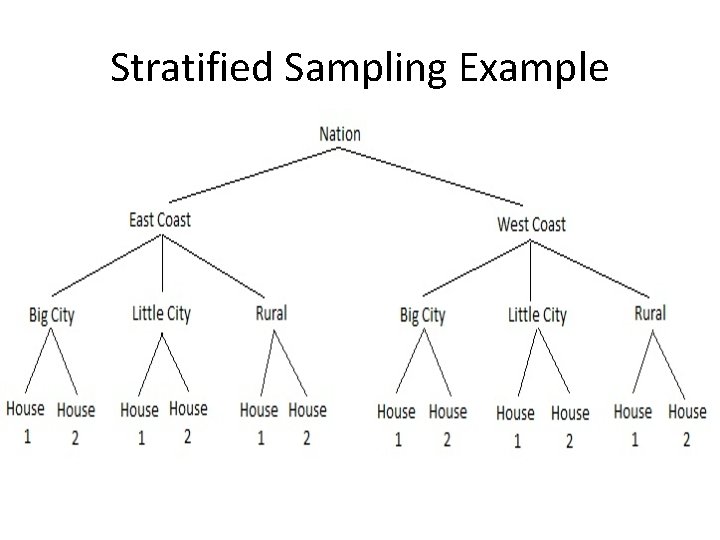
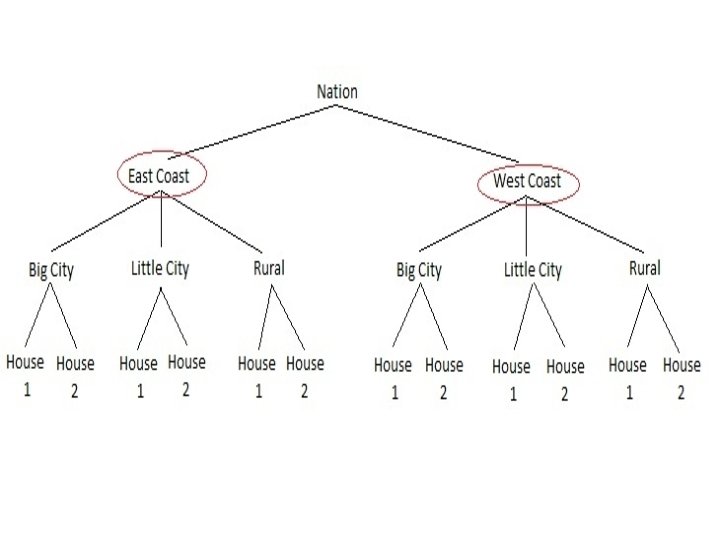
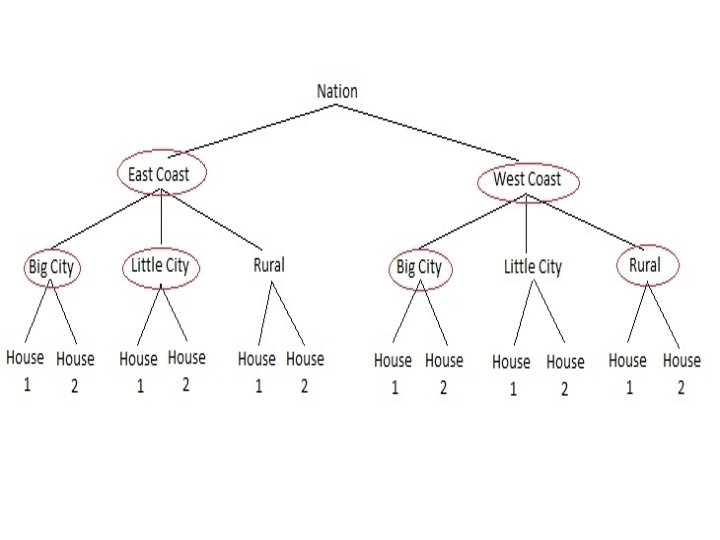
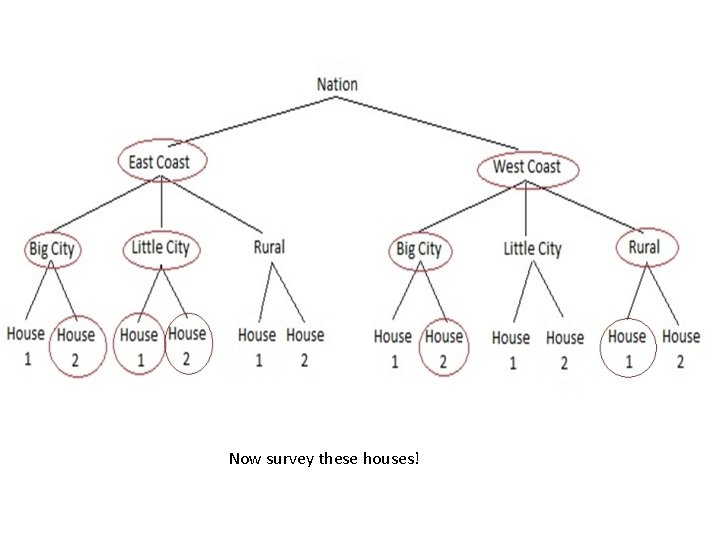
Stratified Sampling • Break the sampling frame into categories (strata), then randomly choose a sample from these strata • Those chosen strata are subdivided into substrata, and a random sample taken. • Subdivide again and take a random sample, etc • End up with clusters, but usually reliable
Stratified Sampling Example
Now survey these houses!
More Definitions • Statistic: Numerical information drawn from a sample • Parameter: unknown measure (numerical info) from the population • Hopefully, the statistic will be close to the parameter so conclusions made about the sample will be true for the whole population.
Error and Bias • Sampling error: the difference between the parameter (estimated) and the statistic • Sampling error attributed to: – Chance error – Sampling variability: different samples give different results – Sampling bias: bad sample chosen
Sample Size • Population size = N • Sample size = n • Sampling proportion = n/N • Modern public opinion polls: 1000 ≤ n ≤ 1500
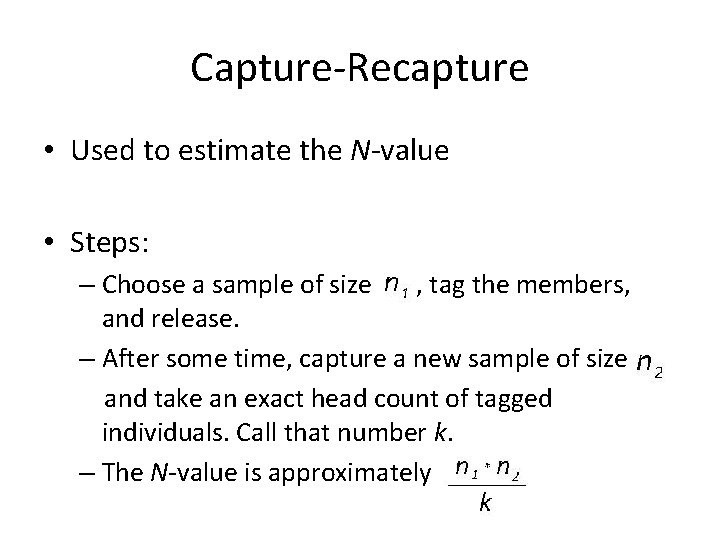
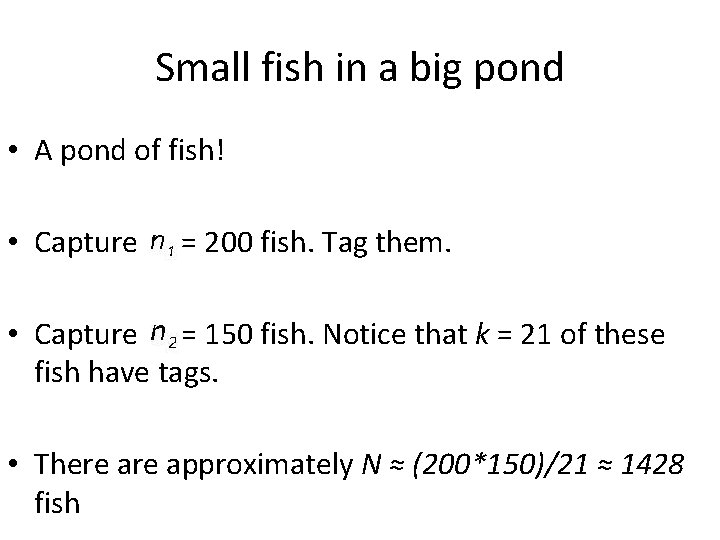
Capture-Recapture • Used to estimate the N-value • Steps: – Choose a sample of size , tag the members, and release. – After some time, capture a new sample of size and take an exact head count of tagged individuals. Call that number k. – The N-value is approximately
Small fish in a big pond • A pond of fish! • Capture = 200 fish. Tag them. • Capture = 150 fish. Notice that k = 21 of these fish have tags. • There approximately N ≈ (200*150)/21 ≈ 1428 fish
Clinical Studies • Try to study cause and effect, whereas surveys just observe and report CORRELATION DOES NOT IMPLY CAUSATION!!!!!
Alar Scare • Alar: chemical used by apple growers • 1973: mice exposed to active chemicals in Alar at 8 times greater than the max tolerated dosage – A child would have to eat 200, 000 apples per day to get that dosage • Alar doesn’t really cause cancer, but no longer used. Washington State apple industry lost $375 million.
Clinical studies • Concerned with determining whether a single variable or treatment (vaccine, drug, therapy, etc) can cause a certain effect (disease, symptom, cure, etc) • Confounding variables: all other possible contributing causes that could produce the same effect • First step: isolate the treatment under investigation from confounding variables
Controlled Study • Subjects are divided into two different groups: – Treatment group: consists of subjects receiving the actual treatment – Control group: consists of subjects that are not receiving any treatment (for comparison only) • Randomized controlled study: subjects are assigned to the treatment group or control group randomly. . hopefully groups are representative samples
Placebos • Placebo: fake treatment intended to look like the real treatment • Controlled placebo study: controlled study in which control group is given a placebo • Placebo effect: just the idea of getting treatment can produce positive results
Don’t tell them about the placebo! • Blind study: neither the members of the treatment group nor the members of the control group know to which of the two groups they belong • Double-blind study: the scientists conducting the study don’t know either
Homework • Read Chapter 13 • Answer the questions on the Vocabulary worksheet • Exercises beginning on page 515: 1 -4, 13, 17 -25, 30 -32, 45 -48, 57 -60, 70