Time Series and Dynamic Time Warping CSE 4309


. •")


, (2, 3), (6, 7), (7, 1))")


- Slides: 96
Time Series and Dynamic Time Warping CSE 4309 – Machine Learning Vassilis Athitsos Computer Science and Engineering Department University of Texas at Arlington 1
Sequential Data • 2
Time Series • A time series is a sequence of observations made over time. • Examples: – Stock market prices (for a single stock, or for multiple stocks). – Heart rate of a patient over time. – Position of one or multiple people/cars/airplanes over time. – Speech: represented as a sequence of audio measurements at discrete time steps. – A musical melody: represented as a sequence of pairs (note, duration). 3
Applications of Time Series Classification • Predicting future prices (stock market, oil, currencies…). • Heart rate of a patient over time: – Is it indicative of a healthy heart, or of some disease? • Position of one or multiple people/cars/airplanes over time. – Predict congestion along a route suggested by the GPS. • Speech recognition. • Music recognition. – Sing a tune to your phone, have it recognize the song. – Recognize the genre of a song based on how it sounds. 4
Time Series Example: Signs • 0. 5 to 2 million users of American Sign Language (ASL) in the US. • Different regions in the world use different sign languages. – For example, British Sign Language (BSL) is different than American Sign Language. • These languages have vocabularies of thousands of signs. • We will use sign recognition as our example application, as we introduce methods for time series classification. 5
Example: The ASL Sign for "again" 6
Example: The ASL Sign for "bicycle" 7
Representing Signs as Time Series • 8
Feature Vectors • Finding good feature vectors for signs is an active research problem in computer vision. 9
Feature Vectors • We choose a simple approach: the feature vector at each frame is the (x, y) pixel location of the right hand at that frame. 10
Feature Vectors • We choose a simple approach: the feature vector at each frame is the (x, y) pixel location of the right hand at that frame. 11
Feature Vectors • We choose a simple approach: the feature vector at each frame is the (x, y) pixel location of the right hand at that frame. 12
Time Series for a Sign • Using the previous representation, for sign "AGAIN" we end up with this time series: ((192, 205), (190, 201), (190, 194), (191, 188), (194, 182), (205, 183), (211, 178), (217, 171), (225, 168), (232, 167), (233, 167), (238, 168), (241, 169), (243, 176), (254, 177), (256, 179), (258, 186), (269, 194), (271, 202), (274, 206), (276, 207), (277, 208)). • It is a sequence of 22 2 D vectors. 13
Time Series for a Sign • Using the previous representation, for sign "AGAIN" we end up with this time series: ((192, 205), (190, 201), (190, 194), (191, 188), (194, 182), (205, 183), (211, 178), (217, 171), (225, 168), (232, 167), (233, 167), (238, 168), (241, 169), (243, 176), (254, 177), (256, 179), (258, 186), (269, 194), (271, 202), (274, 206), (276, 207), (277, 208)) • It is a sequence of 22 2 D vectors. 14
Time Series Classification Training sign for "AGAIN". 15
Time Series Classification Training sign for "BICYCLE". 16
Time Series Classification Suppose our training set only contains those two signs: "AGAIN" and "BICYCLE". We get this test sign. Does it mean "AGAIN", or "BICYCLE"? 17
Time Series Classification Does this test sign mean "AGAIN", or "BICYCLE"? We can use nearest-neighbor classification. Big question: what distance measure should we choose? 18
Visualizing a Time Series • 19
Comparing Time Series • 20
Comparing Time Series • We could possibly use the Euclidean distance. – The first time series is a 16 -dimensional vector. – The second time series is an 18 -dimensional vector. • However, there are issues… 21
Problems with the Euclidean Distance • The two vectors have different numbers of dimensions. • We could fix that by "stretching" the first time series to also have 9 elements. 22
Problems with the Euclidean Distance • Here, the time series on the left has been converted to have nine elements, using interpolation. – We will not explore that option any further, because… 23
Problems with the Euclidean Distance • Bigger problem: the two time series correspond to a similar pattern being performed with variable speed. – The first five elements of the first time series visually match the first seven elements of the second time series. 24
Problems with the Euclidean Distance • So, the first time series had a faster speed than the second time series initially. – It took 5 time ticks for the first time series, and seven time ticks for the second time series, to move through approximately the same trajectory. 25
Problems with the Euclidean Distance • Similarly, the last four elements of the first time series visually match the last three elements of the second time series. • So, the first time series had a faster speed than the second time series in the last part. – 4 time ticks for the first time series, 3 time ticks for the second one. 26
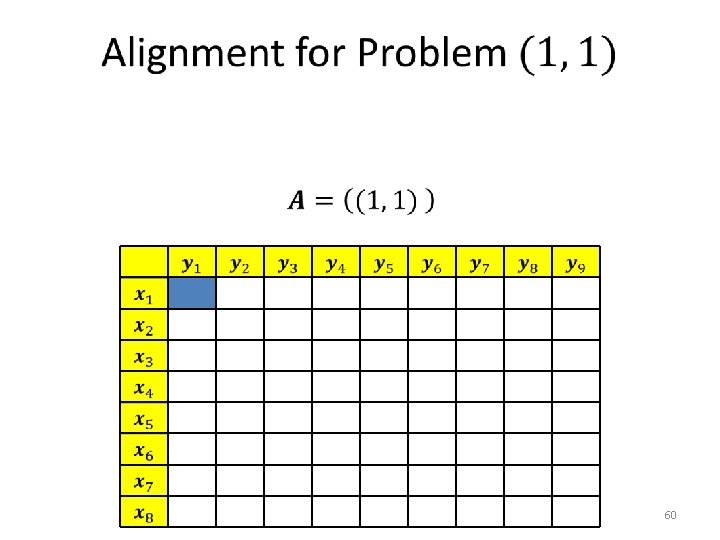
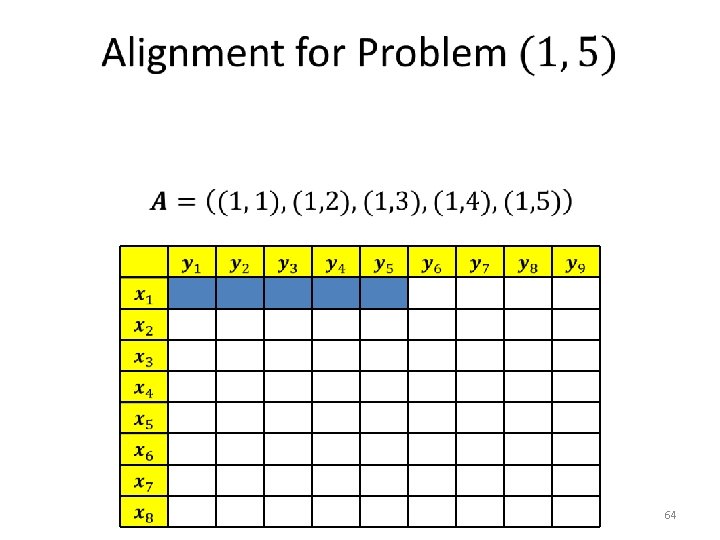
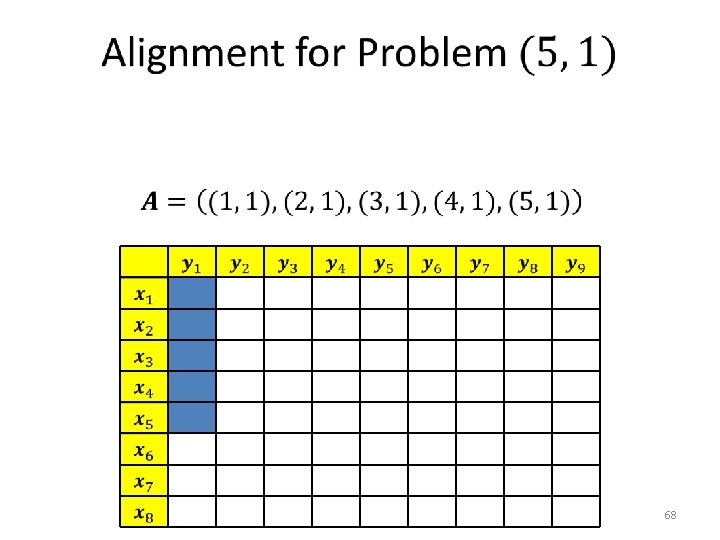
Time Series Alignment • An alignment is a correspondence between elements of two time series. • To reliably measure the similarity between two time series, we need to figure out, for each element of the first time series, which elements of the second time series it corresponds to. 27
Time Series Alignment 28
Time Series Alignment 29
Time Series Alignment 30
Time Series Alignment 31
Time Series Alignment 32
Time Series Alignment 33
Time Series Alignment 34
Time Series Alignment 35
Time Series Alignment 36
Time Series Alignment 37
Time Series Alignment 38
Time Series Alignment 39
Time Series Alignment 40
Time Series Alignment 41
Time Series Alignment 42
The Cost of an Alignment 43
The Cost of an Alignment • 44
The Cost of an Alignment • 45
Rules of Alignment • Should alignment ((1, 5), (2, 3), (6, 7), (7, 1)) be legal? • It always depends on what makes sense for your data. • Typically, for time series, alignments have to obey certain rules, that this alignment violates. 46
Rules of Alignment • We will require that legal alignments obey three rules: – Rule 1: Boundary Conditions. – Rule 2: Monotonicity. – Rule 3: Continuity • The next slides define these rules. 47
Rule 1: Boundary Conditions • first elements match last elements match 48
Rule 2: Monotonicity • The alignment cannot go backwards. 49
Rule 3: Continuity • The alignment cannot skip elements. 50
Visualizing a Warping Path • Warping path is an alternative term for an alignment 51
Visualizing a Warping Path • 52
Dynamic Time Warping • 53
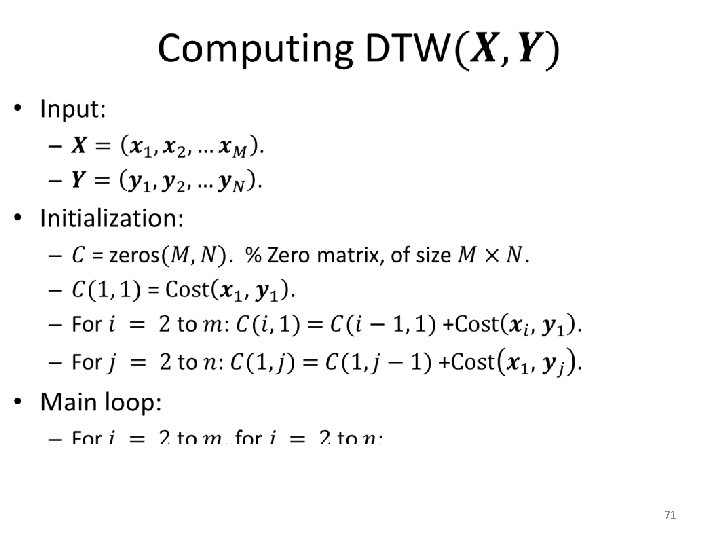
Finding the Optimal Alignment • 54
Finding the Optimal Alignment • 55
Finding the Optimal Alignment • 56
Finding the Optimal Alignment • 57
Finding the Optimal Alignment • 58
Finding the Optimal Alignment • 59
Finding the Optimal Alignment • 61
Finding the Optimal Alignment • 62
Finding the Optimal Alignment • 63
Finding the Optimal Alignment • 65
Finding the Optimal Alignment • 66
Finding the Optimal Alignment • 67
Finding the Optimal Alignment • 69
Finding the Optimal Alignment • 70
Cost vs. Alignment • 72
Cost vs. Alignment • 73
DTW Complexity ? 74
DTW Complexity ? 75
DTW Complexity ? 76
DTW Finds the Optimal Alignment • Proof: 77
DTW Finds the Optimal Alignment • Proof: by induction. • Base cases: 78
DTW Finds the Optimal Alignment • Proof: by induction. • Base cases: – i = 1 OR j = 1. 79
DTW Finds the Optimal Alignment • 80
DTW Finds the Optimal Alignment • 81
DTW Finds the Optimal Alignment • 82
DTW Finds the Optimal Alignment • 83
DTW Finds the Optimal Alignment • 84
DTW Optimality Proof • 85
DTW Optimality Proof • 86
DTW Optimality Proof • 87
DTW Optimality Proof • 88
DTW Optimality Proof • 89
DTW Optimality Proof • 90
DTW Optimality Proof • 91
DTW Optimality Proof • 92
? 93
DTW Optimality Proof - Recap • 94
Dynamic Time Warping, Recap • It is oftentimes useful to use nearest neighbor classification to classify time series. – Especially when we have very few training examples per class, or, in the extreme, only one training example per class. • However, to use nearest neighbor classification, we need to define a meaningful distance measure between time series. • The Euclidean distance works poorly because even slight misalignments can lead to large distance values. • Dynamic Time Warping is based on computing an optimal alignment between two time series, and thus it can tolerate even large misalignments. • The complexity of Dynamic Time Warping is quadratic to the length of the time series, but more efficient variants can also be 95 used.
Other Distance Measures • There are more distance measures that can be used on time series data. For example: – Edit Distance with Real Penalty (ERP). Lei Chen and Raymond Ng. "On the marriage of lp-norms and edit distance. " In International Conference on Very Large Data Bases (VLDB), pp. 792 -803, 2004. – Time Warp Edit Distance (TWED). Pierre-François Marteau. "Time warp edit distance with stiffness adjustment for time series matching. " IEEE Transactions on Pattern Analysis and Machine Intelligence (PAMI), 31, no. 2 (2009): 306 -318. – Move-Split-Merge (MSM). Alexandra Stefan, Vassilis Athitsos, and Gautam Das. "The move-split-merge metric for time series. " IEEE Transactions on Knowledge and Data Engineering (TKDE), 25, no. 6 (2013): 1425 -1438. 96