
Regression Analysis of Phosphorous Loading Data for the










- Slides: 49
Regression Analysis of Phosphorous Loading Data for the Maumee River, Water Years 2003 -2005 Charlie Piette David Dolan Department of Natural and Applied Sciences University of Wisconsin Green Bay Pete Richards National Center for Water Quality Research, Heidelberg College
Phosphorus and the Great Lakes Water Quality Agreement • Goal for reduction • Initial targets • Secondary targets
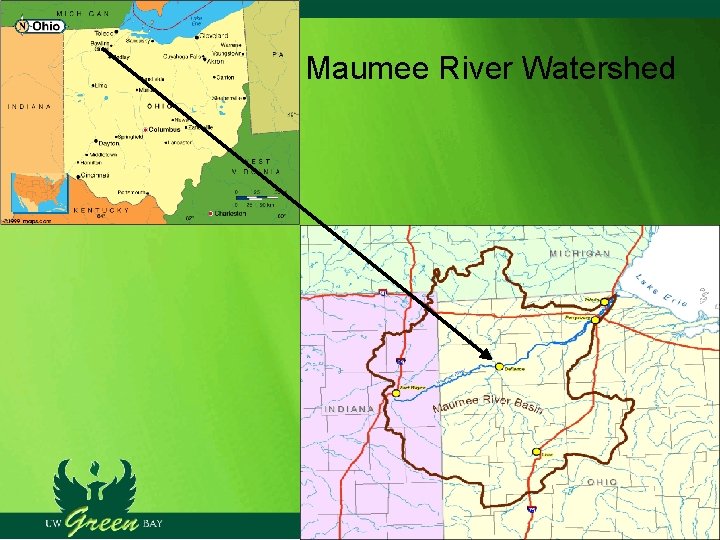
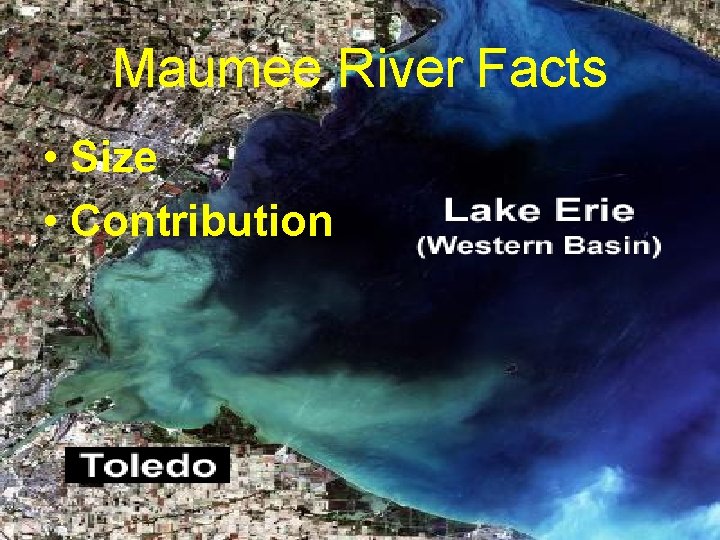
Maumee River Watershed 5
Maumee River Facts • Size • Contribution
Data Source • USGS • NCWQR • Used data from WY 2003 -2005
Purpose of Our Research • ECOFORE 2006: Hypoxia Assessment in Lake Erie • Estimate TP loads to Lake Erie using data from Heidelberg College and effluent data from permitted point sources • Constructing a daily time series of phosphorus loading (Maumee River)
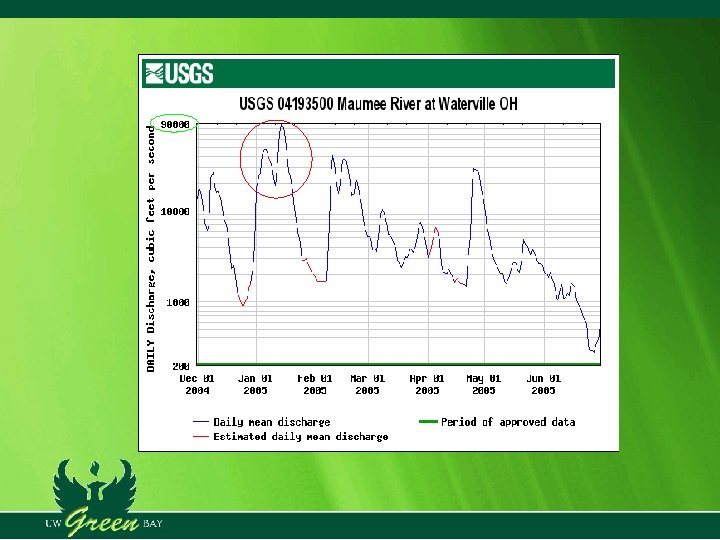
Problems in Constructing a Time Series for the Maumee • Missing data • All three years missing some data • No major precipitation events were missed in water years 2003 and 2004 • 2005……. .
Water Year 2005 Data Overview • Missing an important time period • December 2004 -January 2005, moving the lab • Very significant period of precipitation • 32. 8 inches of snow in January ’ 05 • Third wettest January on record • Warm temps- 52˚F on New Year’s Day
Importance of WY 2005 • Fifth largest peak flow in 73 year data record- 94, 100 cfs • Orders of magnitude larger than average flows for the same time period in WY ’ 03 and ’ 04 • 3, 437 cfs and 10, 039 cfs respectively • Need to model the missing data to complete the time series
Objectives • Use statistical analysis to develop a model for predicting missing T. P. for the Maumee in WY 2005 • Calculate an annual load for WY 2005 using measured and predicted data • Compare estimated regression load to estimated load from another method • Assess effectiveness of final regression model on other Lake Erie Tributaries
Reconstructing the Missing Concentration Data • Multiple regression w/ SAS • Producing an equation that can be used to model for the missing phosphorus concentrations
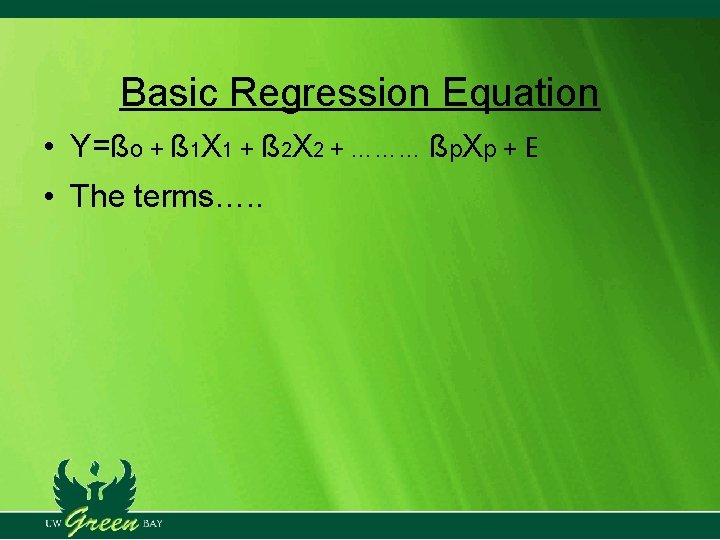
Basic Regression Equation • Y=ßо + ß 1 X 1 + ß 2 X 2 + ……… ßp. Xp + E • The terms…. .
Basic Assumption of Regression • Linear relationship between dependent and independent variables
Basic Assumptions: Continued • Normal distribution of residuals
So, the data is suitable for regression analysis. What makes for a strong model? • Hypothesis for model significance • Hypothesis for parameter estimate significance • P-values- <. 05 • R 2 value • M. S. E.
Beale’s Equation
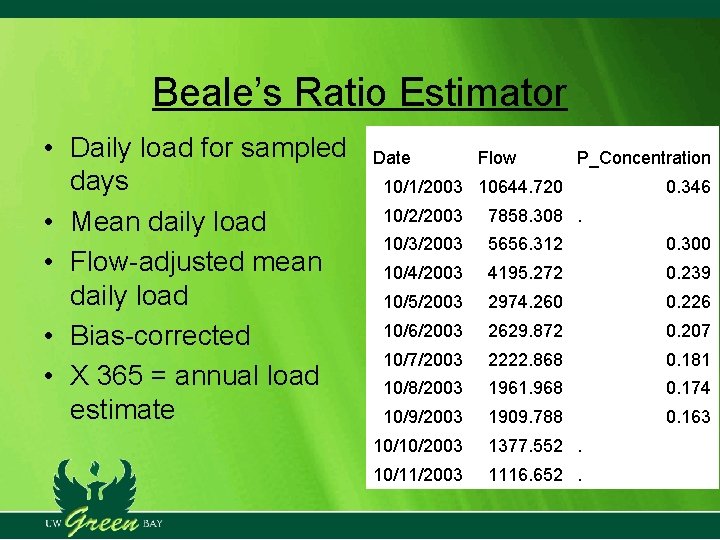
Beale’s Ratio Estimator • Daily load for sampled days • Mean daily load • Flow-adjusted mean daily load • Bias-corrected • X 365 = annual load estimate Date Flow P_Concentration 10/1/2003 10644. 720 0. 346 10/2/2003 7858. 308. 10/3/2003 5656. 312 0. 300 10/4/2003 4195. 272 0. 239 10/5/2003 2974. 260 0. 226 10/6/2003 2629. 872 0. 207 10/7/2003 2222. 868 0. 181 10/8/2003 1961. 968 0. 174 10/9/2003 1909. 788 0. 163 10/10/2003 1377. 552. 10/11/2003 1116. 652.
Beale Stratified Ratio Estimator • Stratification- flow or time • More accurate estimation • “It’s an art!”
Beale Vs. Regression • Both a means to the same end- annual load estimate • Both relying on one main assumption- a linear relationship • Big difference- Beale is not good for reconstructing a time series
Regression Analysis
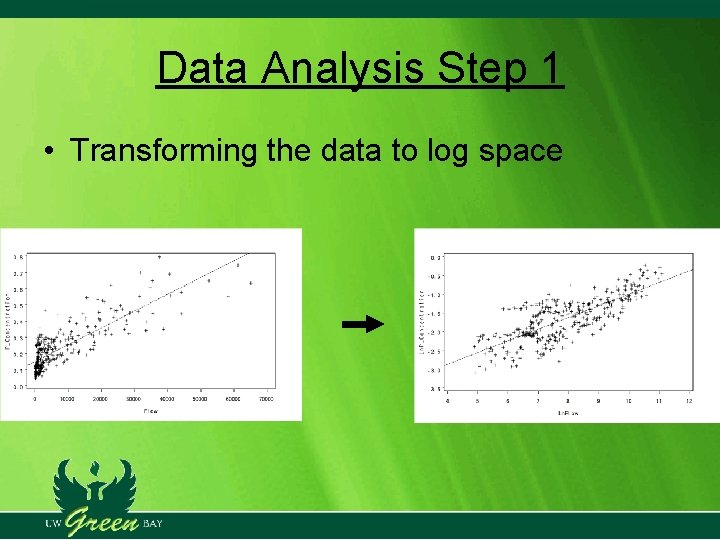
Data Analysis Step 1 • Transforming the data to log space
Regression Model 1 • Log P-Conc = b 0 + b 1(Log Flow) + error • Most simple model • Historical use
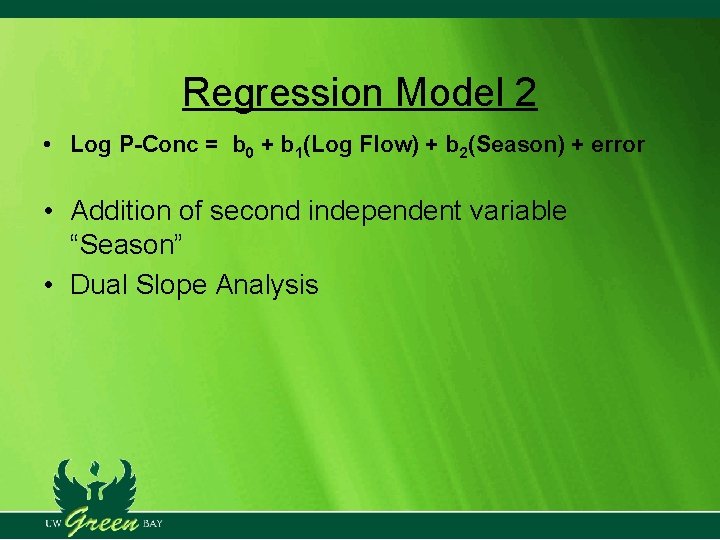
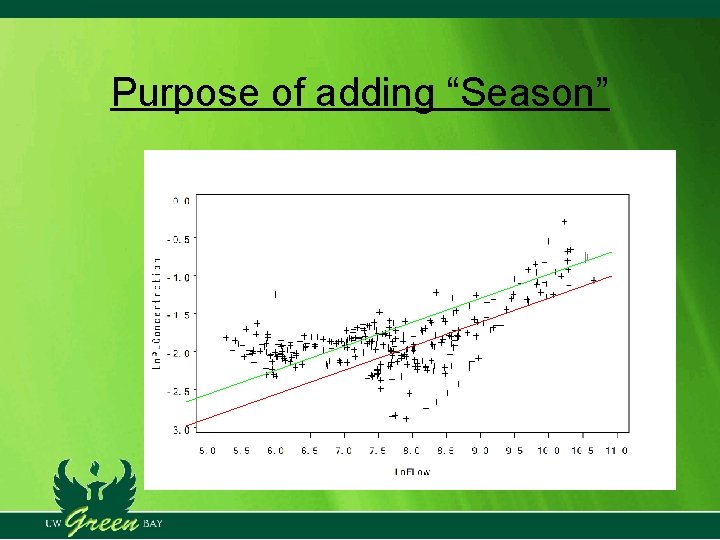
Regression Model 2 • Log P-Conc = b 0 + b 1(Log Flow) + b 2(Season) + error • Addition of second independent variable “Season” • Dual Slope Analysis
Purpose of adding “Season”
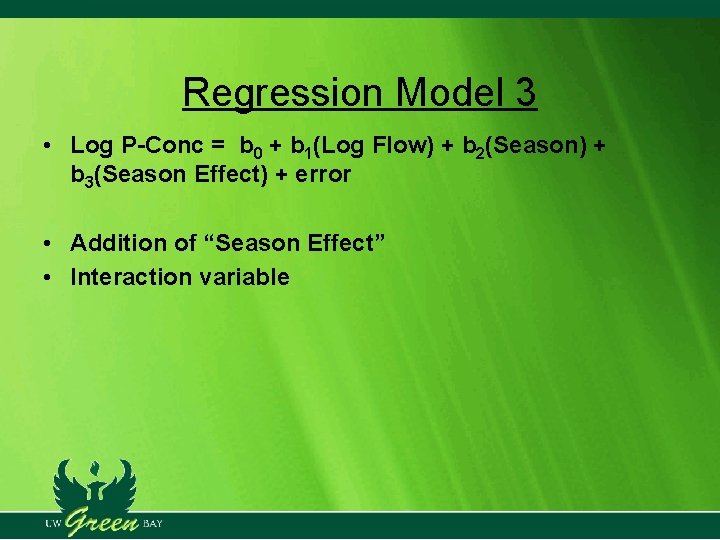
Regression Model 3 • Log P-Conc = b 0 + b 1(Log Flow) + b 2(Season) + b 3(Season Effect) + error • Addition of “Season Effect” • Interaction variable
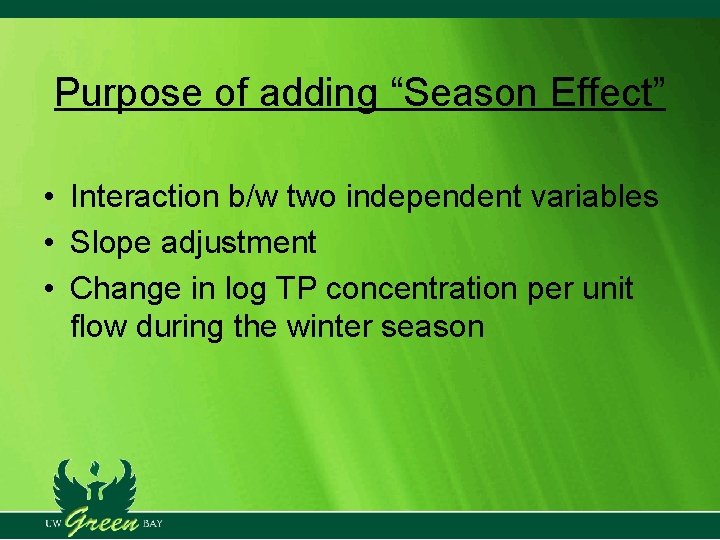
Purpose of adding “Season Effect” • Interaction b/w two independent variables • Slope adjustment • Change in log TP concentration per unit flow during the winter season
Results of Regression Models for the Maumee, WY 2005
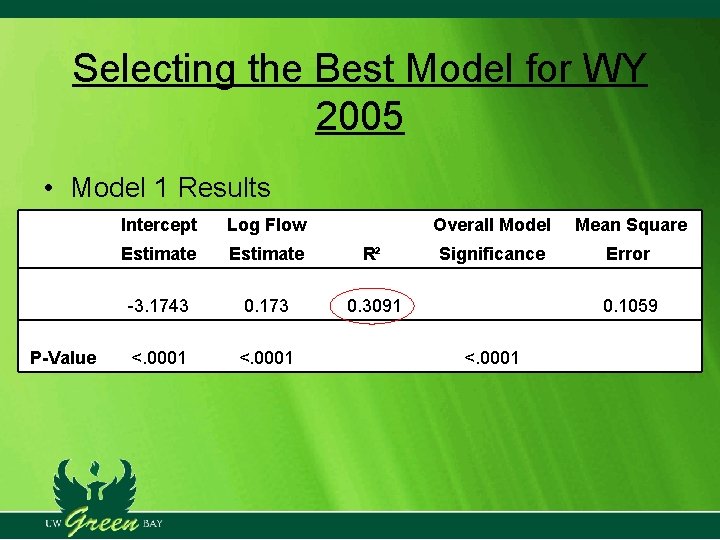
Selecting the Best Model for WY 2005 • Model 1 Results Intercept Log Flow Overall Model Mean Square Estimate R² Significance Error -3. 1743 0. 173 0. 3091 0. 1059 P-Value <. 0001
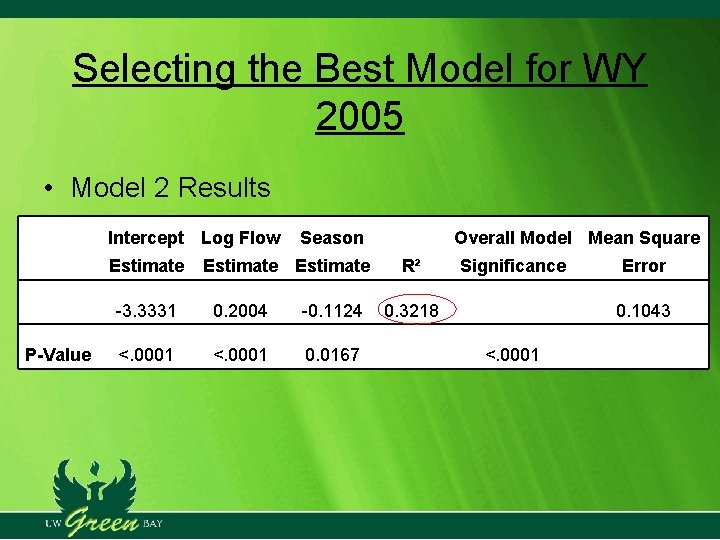
Selecting the Best Model for WY 2005 • Model 2 Results Intercept Log Flow Estimate -3. 3331 0. 2004 P-Value <. 0001 Season Estimate Overall Model Mean Square R² Significance Error -0. 1124 0. 3218 0. 1043 0. 0167 <. 0001
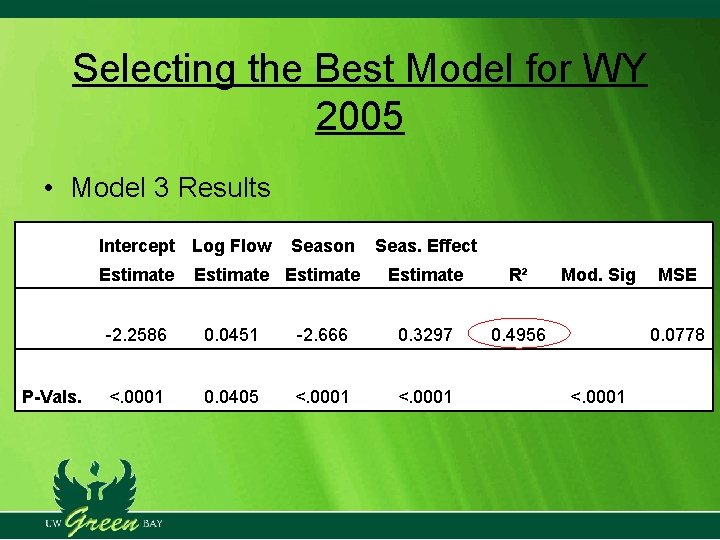
Selecting the Best Model for WY 2005 • Model 3 Results Intercept Log Flow Estimate Season Estimate Seas. Effect Estimate R² Mod. Sig MSE -2. 2586 0. 0451 -2. 666 0. 3297 0. 4956 0. 0778 P-Vals. <. 0001 0. 0405 <. 0001
Results of Regression Model 3 for the Maumee, WY 2003 -2004
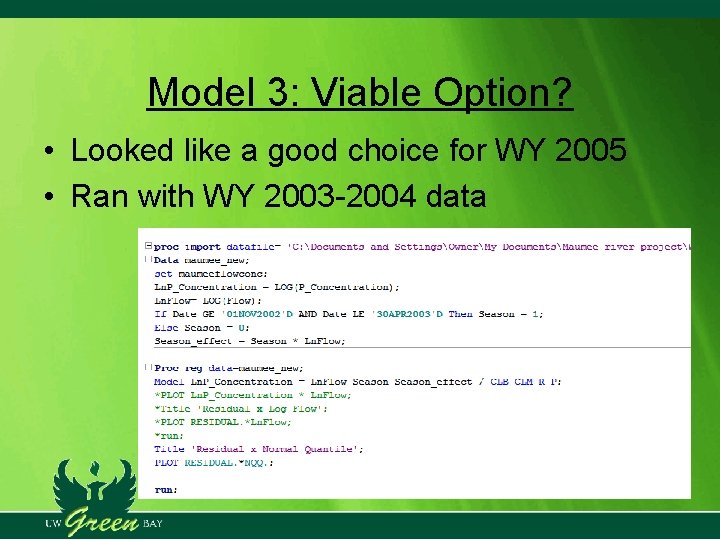
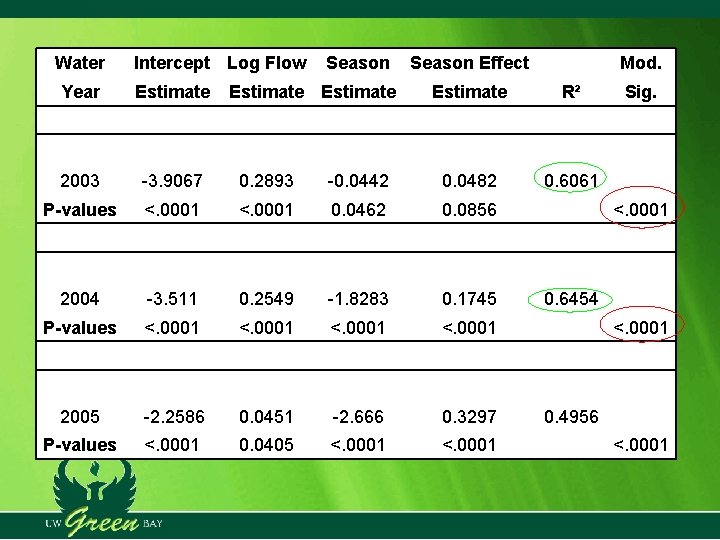
Model 3: Viable Option? • Looked like a good choice for WY 2005 • Ran with WY 2003 -2004 data
Water Intercept Log Flow Season Estimate Season Effect Mod. Estimate R² Sig. Year Estimate 2003 -3. 9067 0. 2893 -0. 0442 0. 0482 0. 6061 P-values <. 0001 0. 0462 0. 0856 <. 0001 2004 -3. 511 0. 2549 -1. 8283 0. 1745 P-values <. 0001 2005 -2. 2586 0. 0451 -2. 666 0. 3297 P-values <. 0001 0. 0405 <. 0001 0. 6454 0. 4956 <. 0001
Estimating an Annual TP Load Using Regression Results
Estimating an Annual Load With Regression • Used Model 3 • Need to bring the log TP concentrations out of log-space (back-transforming) • Back-transforming bias and estimated concentrations
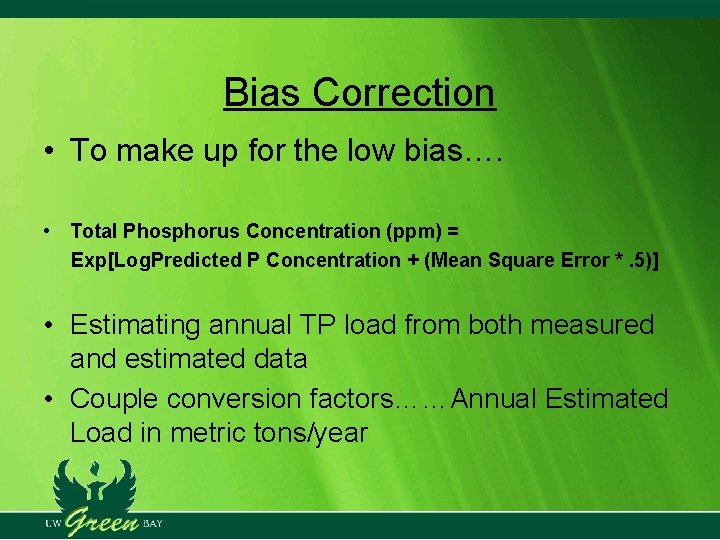
Bias Correction • To make up for the low bias…. • Total Phosphorus Concentration (ppm) = Exp[Log. Predicted P Concentration + (Mean Square Error *. 5)] • Estimating annual TP load from both measured and estimated data • Couple conversion factors……Annual Estimated Load in metric tons/year
What did We Find? ? ?
Major Purpose of Our Research • The main objective- developing a daily time series for accurately estimating an annual load for the Maumee in 2005
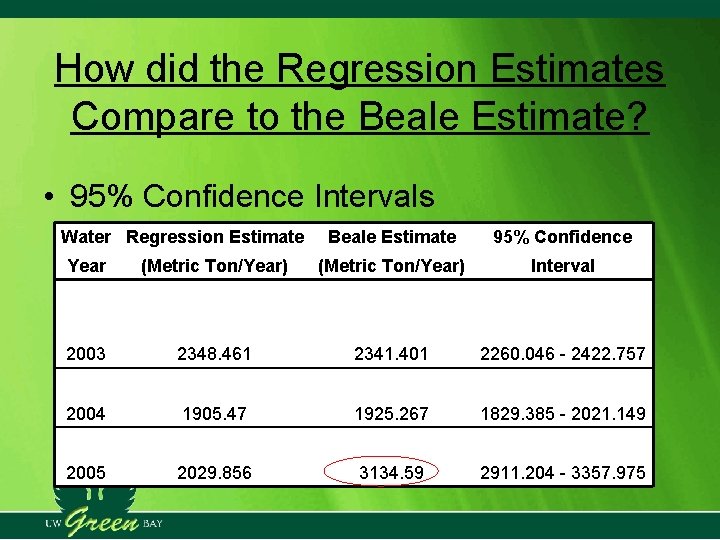
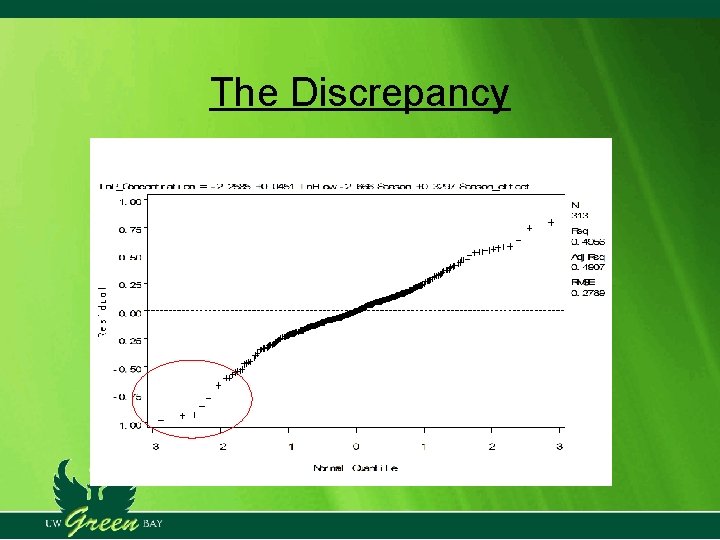
How did the Regression Estimates Compare to the Beale Estimate? • 95% Confidence Intervals Water Regression Estimate Beale Estimate 95% Confidence Year (Metric Ton/Year) Interval 2003 2348. 461 2341. 401 2260. 046 - 2422. 757 2004 1905. 47 1925. 267 1829. 385 - 2021. 149 2005 2029. 856 3134. 59 2911. 204 - 3357. 975
The Discrepancy
Problem with Regression • Under-prediction • Low-flow bias
Future Directions • Improving the regression model • Other independent variables • More years
Thank You Any Questions?