LOGISTIC REGRESSION Copyright 2013 SAS Institute Inc All


 CLASSIFICATION REGRESSION (Binary) Target Input Variables y Cases Copyright © 2013,")


 x 1 x 2 Linear Additive x 1")


=(effect(clband x=(ddabal depamt checks res)) oddsratio (type=horizontalstat)); class")


=(effect(clband x=(ddabal depamt checks res)) Copyright ©")


, (x, y), (x, y), . . . {(x, y),")


 DEPEND ON THE DATA? • No o MCAR (missing completely")


![MISSING VALUES CLUSTER IMPUTATION [AT LATER LECTURES] X 1 = X 2 = ?](https://slidetodoc.com/presentation_image/33a05f37923a4da71c75a57208bdfdfa/image-40.jpg "MISSING VALUES CLUSTER IMPUTATION [AT LATER LECTURES] X 1 = X 2 = ?")


![VARIABLE CLUSTERING PROC VARCLASS [LATER LECTURE] Mortgage Balance Number of Checks Credit Card Balance](https://slidetodoc.com/presentation_image/33a05f37923a4da71c75a57208bdfdfa/image-51.jpg "VARIABLE CLUSTERING PROC VARCLASS [LATER LECTURE] Mortgage Balance Number of Checks Credit Card Balance")


 2) 3) 4) 5) Copyright © 2013, SAS")


- Slides: 75
LOGISTIC REGRESSION Copyright © 2013, SAS Institute Inc. All rights reserved.
OVERVIEW Copyright © 2013, SAS Institute Inc. All rights reserved.
REMEMBER? APPLICATIONS: PREDICTION VS. EXPLANATORY ANALYSIS The terms in the model, the values of their coefficients, and their statistical significance are of secondary importance. • The focus is on producing a model that is the best at predicting future values of Y as a function of the Xs. The predicted value of Y is given by this formula: • Copyright © 2013, SAS Institute Inc. All rights reserved. The focus is on understanding the relationship between the dependent variable and the independent variables. • Consequently, the statistical significance of the coefficients is important as well as the magnitudes and signs of the coefficients. •
LOGISTIC ПРИМЕРЫ ЗАДАЧ REGRESSION Target Marketing Attrition Prediction Credit Scoring Fraud Detection Copyright © 2013, SAS Institute Inc. All rights reserved.
LOGISTIC REGRESSION AND OTHER MODELS REGRESSION Categorical Continuous and Categorical Continuous Analysis of Variance (ANOVA) Ordinary Least Squares (OLS) Regression Analysis of Covariance (ANCOVA) Categorical Contingency Table Analysis or Logistic Regression Type of Response Copyright © 2013, SAS Institute Inc. All rights reserved. Type of Predictors
LOGISTIC TYPES OF LOGISTIC REGRESSION Copyright © 2013, SAS Institute Inc. All rights reserved.
LOGISTIC SUPERVISED (BINARY) CLASSIFICATION REGRESSION (Binary) Target Input Variables y Cases Copyright © 2013, SAS Institute Inc. All rights reserved. x 1 x 2 x 3 x 4 x 5 x 6. . . xk 1 . . . 2 . . . 3 . . . 4 . . . 5. . . n . . . .
LOGISTIC ЗАДАЧА И ДАННЫЕ REGRESSION 1= yes 0= no ~32’ 000 obs 47 vars Copyright © 2013, SAS Institute Inc. All rights reserved. Did customer purchase variable annuity product? Other product usage in a three month period Demographics
LOGISTIC ЗАДАЧА И ДАННЫЕ REGRESSION Copyright © 2013, SAS Institute Inc. All rights reserved.
ANALYTICAL CHALLENGES Copyright © 2013, SAS Institute Inc. All rights reserved.
ANALYTICAL OPPORTUNISTIC DATA CHALLENGES Operational / Observational Massive Analytical data preparation step: Errors and Outliers Missing Values Copyright © 2013, SAS Institute Inc. All rights reserved. • BENCHMARK: 80/20 • [MY] LIFE: 99/1
ANALYTICAL MIXED MEASUREMENT SCALES CHALLENGES sales, executive, homemaker, . . . 88. 60, 3. 92, 34890. 50, 45. 01, . . . F, D, C, B, A 0, 1, 2, 3, 4, 5, 6, . . . M, F 27513, 21737, 92614, 10043, . . . 12 Copyright © 2013, SAS Institute Inc. All rights reserved.
ANALYTICAL HIGH DIMENSIONALITY CHALLENGES 13 Copyright © 2013, SAS Institute Inc. All rights reserved.
ANALYTICAL RARE TARGET EVENT CHALLENGES Event respond churn default fraud No Event not respond stay pay off legitimate 14 Copyright © 2013, SAS Institute Inc. All rights reserved.
ANALYTICAL NONLINEARITIES AND INTERACTIONS CHALLENGES E(y) x 1 x 2 Linear Additive x 1 x 2 Nonlinear Nonadditive 15 Copyright © 2013, SAS Institute Inc. All rights reserved.
ANALYTICAL MODEL SELECTION CHALLENGES I II II IIIIII II IIIIIIIIIII Underfitting Overfitting Just Right IIIII III I IIIIIIII I IIII I I 16 Copyright © 2013, SAS Institute Inc. All rights reserved.
THE MODEL & ITS INTERPRETATION Copyright © 2013, SAS Institute Inc. All rights reserved.
LOGISTIC WHY NOT LINEAR? REGRESSION OLS Reg: Yi= 0+ 1 X 1 i+ i If the response variable is categorical, then how do you code the response numerically? • If the response is coded (1=Yes and 0=No) and your regression equation predicts 0. 5 or 1. 1 or -0. 4, what does that mean practically? • If there are only two (or a few) possible response levels, is it reasonable to assume constant variance and normality? • Copyright © 2013, SAS Institute Inc. All rights reserved. Linear Prob. Model: pi= 0+ 1 X 1 i Probabilities are bounded, but linear functions can take on any value. (Once again, how do you interpret a predicted value of -0. 4 or 1. 1? ) • Given the bounded nature of probabilities, can you assume a linear relationship between X and p throughout the possible range of X? • Can you assume a random error with constant variance? • What is the observed probability for an observation? •
LOGISTIC FUNCTIONAL FORM REGRESSION posterior probability parameter input Copyright © 2013, SAS Institute Inc. All rights reserved.
LOGISTIC THE LOGIT LINK FUNCTION REGRESSION pi = 1 pi = 0 smaller larger Copyright © 2013, SAS Institute Inc. All rights reserved.
LOGISTIC THE FITTED SURFACE REGRESSION Copyright © 2013, SAS Institute Inc. All rights reserved.
LOGISTIC PROCEDURE REGRESSION proc logistic data=develop plots(only)=(effect(clband x=(ddabal depamt checks res)) oddsratio (type=horizontalstat)); class res (param=ref ref='S'); model ins(event='1') = ddabal depamt cashbk checks res / stb clodds=pl; units ddabal=1000 depamt=1000 / default=1; oddsratio 'Comparisons of Residential Classification' res / diff=all cl=pl; run; Copyright © 2013, SAS Institute Inc. All rights reserved.
LOGISTIC PROPERTIES OF THE ODDS RATIO REGRESSION No Association Группа в знаменателе имеет более высокие шансы наступления события Группа в числителе имеет более высокие шансы 0 1 Estimated logistic regression model: logit(p) = . 7567 +. 4373*(gender) where females are coded 1 and males are coded 0 Estimated odds ratio (Females to Males): odds ratio = (e-. 7567+. 4373)/(e-. 7567) = 1. 55 Copyright © 2013, SAS Institute Inc. All rights reserved.
LOGISTIC RESULTS FROM ODDSRATIO REGRESSION oddsratio 'Comparisons of Residential Classification' res / diff=all cl=pl; Copyright © 2013, SAS Institute Inc. All rights reserved.
LOGISTIC RESULTS FROM PLOTS = (EFFECT(… REGRESSION plots(only)=(effect(clband x=(ddabal depamt checks res)) Copyright © 2013, SAS Institute Inc. All rights reserved.
LOGISTIC DISCRIMINATION REGRESSION Copyright © 2013, SAS Institute Inc. All rights reserved.
OVERSAMPLING Copyright © 2013, SAS Institute Inc. All rights reserved.
OVERSAMPLING DESIGNS Joint (x, y), (x, y), (x, y), . . . {(x, y), (x, y)} Separate x, x, x, . . . y = 0 Copyright © 2013, SAS Institute Inc. All rights reserved. {(x, 0), (x, 1), (x, 1)} x, x, x, . . . y = 1
OVERSAMPLING THE EFFECT OF OVERSAMPLING Copyright © 2013, SAS Institute Inc. All rights reserved.
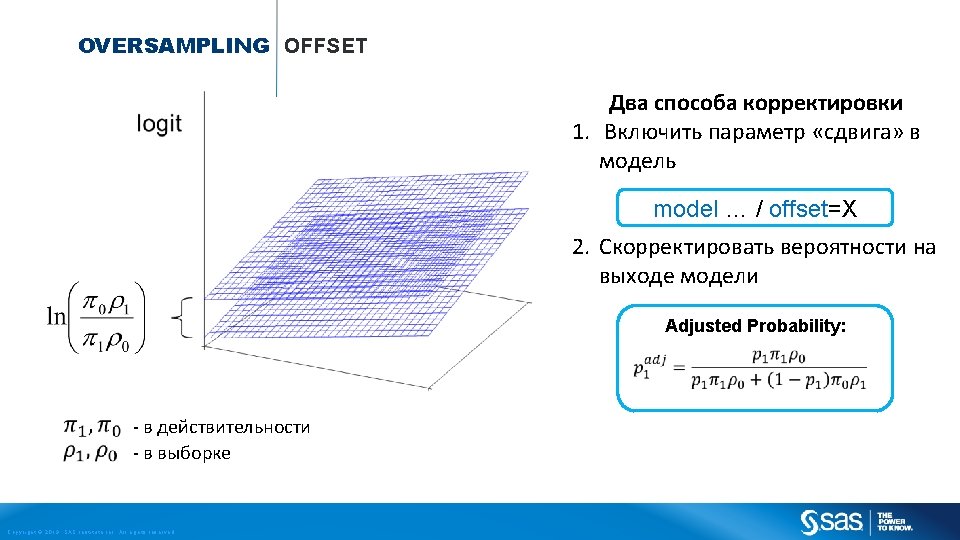
OVERSAMPLING КОРРЕКТИРОВКА ВЕРОЯТНОСТЕЙ /* Specify the prior probability /* to correct for oversampling %let pi 1=. 02; */ */ /* Correct predicted probabilities */ proc logistic data=develop; model ins(event='1')=dda ddabal depamt cashbk checks; score data = pmlr. new out=scored priorevent=&pi 1; run; Copyright © 2013, SAS Institute Inc. All rights reserved.
PREPARING THE INPUT VARIABLES Copyright © 2013, SAS Institute Inc. All rights reserved.
MISSING VALUES DOES PR(MISSING) DEPEND ON THE DATA? • No o MCAR (missing completely at random) • Yes o that unobserved value o other unobserved values o other observed values (including the target) Copyright © 2013, SAS Institute Inc. All rights reserved. 14 2 2 67 1 4 ? 3 1 33 1 7 18 2 1 6 0 1 31 3 8 51 1 8
MISSING VALUES COMPLETE CASE ANALYSIS Cases Input Variables Copyright © 2013, SAS Institute Inc. All rights reserved. .
MISSING VALUES COMPLETE CASE ANALYSIS Cases Input Variables Copyright © 2013, SAS Institute Inc. All rights reserved.
MISSING VALUES NEW MISSING VALUES Fitted Model: New Case: Predicted Value: Copyright © 2013, SAS Institute Inc. All rights reserved.
MISSING VALUES MISSING VALUE IMPUTATION Copyright © 2013, SAS Institute Inc. All rights reserved. 6 03 2. 6 0 8. 3 42 66 C 03 12 6. 5 8 6 3 2 10 7 6. 5 04 01 01 02 03 01 01 1. 8 0 0. 5 86 2. 3. 33 4. 8 37 2. 1 1 4. 8 37 2. 8 1 9. 6 22 2. 7 0 1. 1 28 2. 1 1 5. 9 21 2. 0 0 0. 8 0 2. 5 0 5. 5 62 2. 4 0 0. 9 29 65 66 64 63 63 67 63 C 14 C 00 C 08 C 99 C 00 C 03 C 99 C 12 C 05
MISSING VALUES IMPUTATION + INDICATORS Incomplete Data Completed Data Missing Indicator 34 63. 22 26 54 18. 47 20 34 63 30 22 26 54 18 30 49 20 0 0 1 0 0 Median = 30 Copyright © 2013, SAS Institute Inc. All rights reserved.
MISSING VALUES IMPUTATION + INDICATORS data develop 1; /* Create missing indicators */ set develop; /* name the missing indicator variables */ array mi{*} MIAcct. Ag MIPhone … MICRScor; /* select variables with missing values */ array x{*} acctage phone … crscore; do i=1 to dim(mi); mi{i}=(x{i}=. ); end; run; proc stdize data=develop 1 reponly method=median /* Impute missing values with the median */ out=imputed; var &inputs; run; Copyright © 2013, SAS Institute Inc. All rights reserved.
MISSING VALUES CLUSTER IMPUTATION [AT LATER LECTURES] X 1 = X 2 = ? Copyright © 2013, SAS Institute Inc. All rights reserved.
CATEGORICAL INPUTS Copyright © 2013, SAS Institute Inc. All rights reserved.
CATEGORICAL DUMMY VARIABLES INPUTS Copyright © 2013, SAS Institute Inc. All rights reserved. X DA DB DC DD D B C C A A D C A. . . 0 0 1 1 0 0 1. . . 0 1 0 0 0 0. . . 0 0 1 1 0 0 0 1 0. . . 1 0 0 0 1 0 0. . .
CATEGORICAL SMARTER VARIABLES INPUTS ZIP 99801 99622 99523 99737 99937 99533 99523 99622. . . Copyright © 2013, SAS Institute Inc. All rights reserved. Home. Val 75 100 150 150 75 100 150 100. . . Urbanicity Local. . . 1 2 1 1 3 3 2 1 3. . . 1 1 1 0 1. . .
CATEGORICAL QUASI-COMPLETE SEPARATION INPUTS Copyright © 2013, SAS Institute Inc. All rights reserved. 0 1 DA DB Dc DD A 28 7 1 0 0 0 B 16 0 0 1 0 0 C 94 11 0 0 1 0 D 23 21 0 0 0 1
CATEGORICAL CLUSTERING LEVELS INPUTS 0 1 A 28 7 B 16 0 C 94 11 D 23 21 Merged: 2 = Copyright © 2013, SAS Institute Inc. All rights reserved. 31. 7 100%. . .
CATEGORICAL CLUSTERING LEVELS INPUTS 0 1 A 28 7 B 16 0 C 94 11 D 23 21 Merged: 2 = Copyright © 2013, SAS Institute Inc. All rights reserved. 31. 7 100% 0 1 28 7 110 11 23 21 B & C 30. 7 97%. . .
CATEGORICAL CLUSTERING LEVELS INPUTS 0 1 A 28 7 B 16 0 C 94 11 D 23 21 Merged: 2 = Copyright © 2013, SAS Institute Inc. All rights reserved. 31. 7 100% 0 1 28 7 0 11 23 21 B & C 1 138 18 23 21 A & BC 30. 7 97% 28. 6 90%. . .
CATEGORICAL CLUSTERING LEVELS INPUTS 0 1 A 28 7 B 16 0 C 94 11 D 23 21 Merged: 2 = 31. 7 100% 0 1 28 7 0 11 23 21 B & C 1 138 18 23 21 A & BC 30. 7 97% 0 1 161 39 ABC & D 28. 6 90% 0 0% Greenacre (1988, 1993) PROC MEANS – PROC CLUSTER – PROC TREE -… HOME WORK Copyright © 2013, SAS Institute Inc. All rights reserved.
VARIABLE CLUSTERING Copyright © 2013, SAS Institute Inc. All rights reserved.
VARIABLE REDUNDANCY CLUSTERING Copyright © 2013, SAS Institute Inc. All rights reserved.
VARIABLE CLUSTERING PROC VARCLASS [LATER LECTURE] Mortgage Balance Number of Checks Credit Card Balance Age Copyright © 2013, SAS Institute Inc. All rights reserved. Checking Deposits Teller Visits
VARIABLE UNIVARIATE SCREENING Copyright © 2013, SAS Institute Inc. All rights reserved.
VARIABLE UNIVARIATE SMOOTHING SCREENING Copyright © 2013, SAS Institute Inc. All rights reserved.
EMPIRICAL LOGITS where mi= number of events Mi = number of cases Copyright © 2013, SAS Institute Inc. All rights reserved.
EMPIRICAL LOGIT PLOTS 1. Hand-Crafted New Input Variables 2. Polynomial Models 3. Flexible Multivariate Function Estimators 4. Do Nothing Copyright © 2013, SAS Institute Inc. All rights reserved.
SUBSET SELECTION Copyright © 2013, SAS Institute Inc. All rights reserved.
SUBSET SELECTION SCALABILITY IN PROC LOGISTIC Stepwise Time All Subsets d r a w k c a Fast B 25 50 75 100 150 Number of Variables Copyright © 2013, SAS Institute Inc. All rights reserved. 200
MEASURING CLASSIFIER PERFORMANCE Copyright © 2013, SAS Institute Inc. All rights reserved.
HONEST THE OPTIMISM PRINCIPLE ASSESSMENT Training Accuracy = 70% Test Accuracy = 47% x 1 gray black x 2 Copyright © 2013, SAS Institute Inc. All rights reserved. gray black x 2
HONEST ASSESSMENT DATA SPLITTING Validation Training Test Copyright © 2013, SAS Institute Inc. All rights reserved.
HONEST OTHER APPROACHES ASSESSMENT A 1) 2) 3) 4) 5) Copyright © 2013, SAS Institute Inc. All rights reserved. B C Train BCDE ABDE ABCD D Validate A B C D E E
MISCLASSIFICATION CONFUSION MATRIX Actual Class Predicted Class Copyright © 2013, SAS Institute Inc. All rights reserved. 0 1 0 True Negative False Positive Actual Negative 1 False Negative True Positive Actual Positive Predicted Negative Predicted Positive
SENSITIVITY AND POSITIVE PREDICTED VALUE Predicted Class Actual Class 0 1 True Positive Predicted Positive Copyright © 2013, SAS Institute Inc. All rights reserved. Actual Positive
ROC CURVE Copyright © 2013, SAS Institute Inc. All rights reserved.
OVERSAMPLED TEST SET Actual Predicted 0 1 0 29 21 50 56 41 97 1 17 33 50 1 2 3 46 54 57 43 Sample Copyright © 2013, SAS Institute Inc. All rights reserved. Predicted 0 1 Population
ADJUSTMENTS FOR OVERSAMPLING Actual Class Predicted Class Copyright © 2013, SAS Institute Inc. All rights reserved. 0 1 0 0·Sp 0(1—Sp) 0 1 1(1—Se) 1·Se 1
ALLOCATION RULES CUTOFFS Copyright © 2013, SAS Institute Inc. All rights reserved.
ALLOCATION RULES PROFIT MATRIX Total Profit Actual Predicted Copyright © 2013, SAS Institute Inc. All rights reserved. 0 1 $0 -$1 $0 $99 70 5 9 16 66 9 4 21 57 18 1 24 16*99 - 5 = $1579 21*99 - 9 = $2070 24*99 - 18 = $2358
ALLOCATION RULES PROFIT MATRIX Bayes Rule: Decision Actual Class 0 Copyright © 2013, SAS Institute Inc. All rights reserved. 0 1 1 Decision 1 if
ALLOCATION RULES CLASSIFIER PERFORMANCE Copyright © 2013, SAS Institute Inc. All rights reserved.
ALLOCATION RULES USING PROFIT TO ASSESS FIT Copyright © 2013, SAS Institute Inc. All rights reserved.
OVERALL CLASS SEPARATION PREDICTIVE POWER Copyright © 2013, SAS Institute Inc. All rights reserved.
OVERALL K-S STATISTIC PREDICTIVE POWER Copyright © 2013, SAS Institute Inc. All rights reserved.
OVERALL AREA UNDER THE ROC CURVE PREDICTIVE POWER Copyright © 2013, SAS Institute Inc. All rights reserved.
ROC AND ROCCONTRAST STATEMENTS ROC <'label'> <specification> </ options>; ROCCONTRAST <'label'><contrast></ options>; Copyright © 2013, SAS Institute Inc. All rights reserved.