Ch 10 Logistic Regression Logistic Regression An Introduction


 1 + ef(x) 1 1–P= P 1–P ln")


 Criteria for Assessing Model Fit 2 Intercept and Covariates Chi-Square")
 Analysis of Maximum Likelihood Estimates Parameter Standard Wald Pr >")
 4 b Classification Table Predicted EVENT NO EVENT +-----------+ EVENT")
 5 OBS 1 2 3 4 5 6 7 8")

 1 STATISTICS FOR TABLE OF SUCCESS BY SIZE Statistic DF")

 2 Analysis of Variables Not in the Model Variable SIZE")
 4 Step 2. Variable SIZE entered: Criteria for Assessing Model")
 4 b Analysis of Maximum Likelihood Estimates Parameter Variable Estimate")
 4 c Association of Predicted Probabilities and Observed Responses Concordant")
 5 Classification Table Predicted EVENT NO EVENT +-----------+ EVENT |")
 5 a NOTE: An EVENT is an outcome whose ordered")

 3 Classification results Actual Group ----------- No. of Predicted Group")

 2 Summary of Stepwise Procedure Variable Number Score Step Entered")
 3 Analysis of Maximum Likelihood Estimates Variable INTERCPT SIZE SCHARGE")
 4 Association of Predicted Probabilities and Observed Responses Concordant Discordant")
 5 Classification Table Predicted EVENT NO EVENT Total +-----------+ EVENT")
- Slides: 42
Ch 10 Logistic Regression
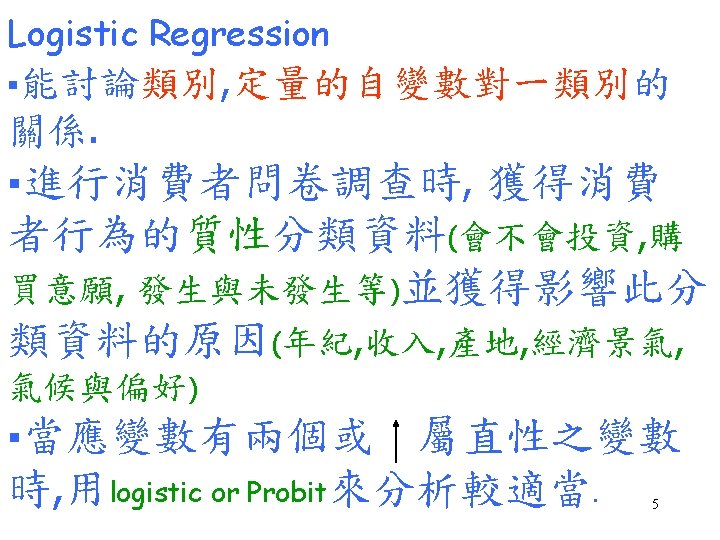
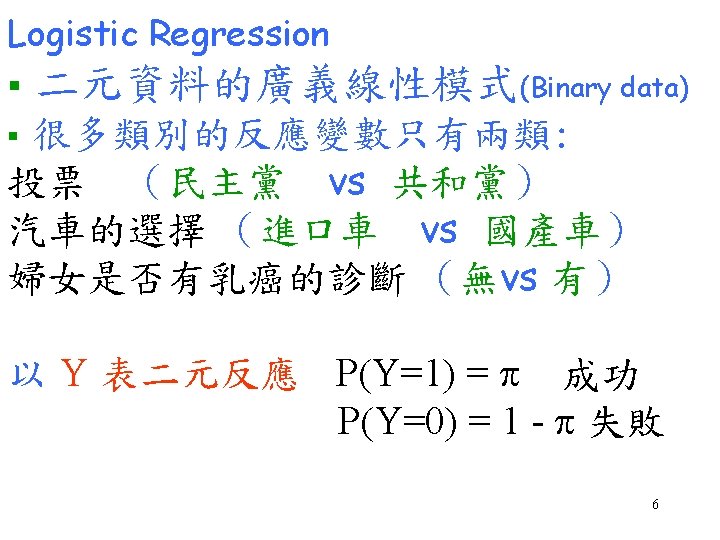
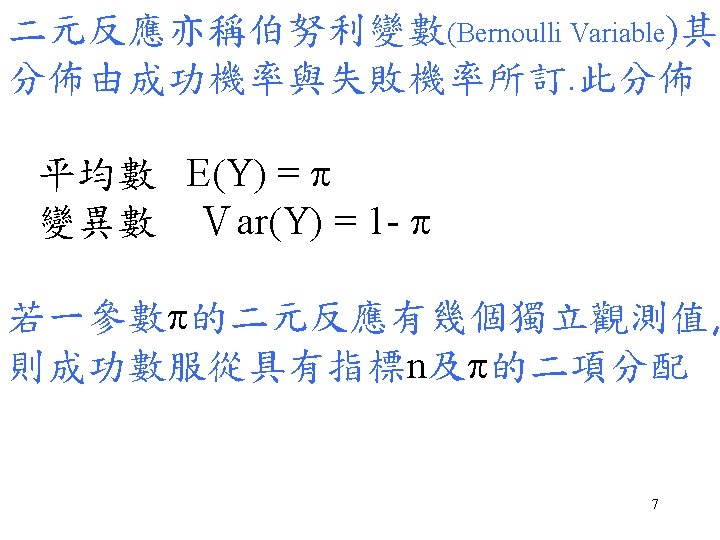
Logistic Regression An Introduction to Categorical data Analysis---Alan Agresti, 1996 §當區別分析的群體中, 不符合常態分 配假設時, 可用(logistic Regression)來做. §Logistic Regression並非預測事件是否發生. 而是預測該事件的機率. §當應變數(x)屬於離散型的變數, 其分 類只有2類或少數時, 以logistic Regression 來分析. 4
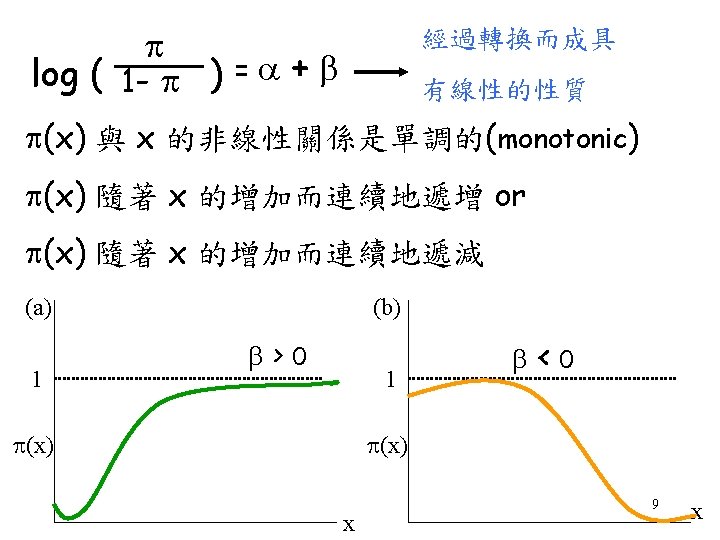
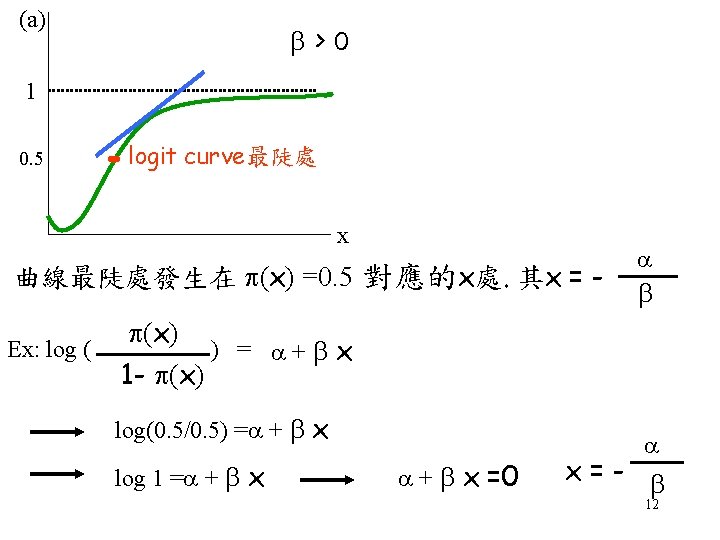
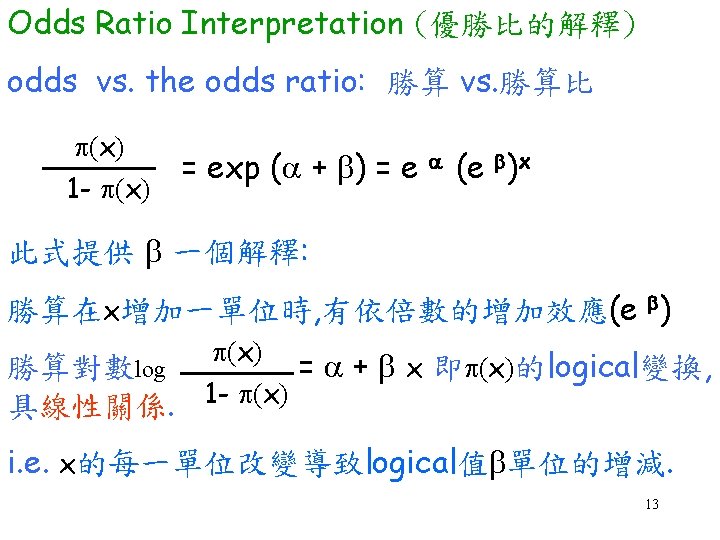
Logical regression function P = ef(x) 1 + ef(x) 1 1–P= P 1–P ln ( 成功的機率 (非線性) 1 + ef(x) = P 1 -P ef(x) 失敗的機率(非線性) 優勢比 ) = f(x) = 0 + 1 x 1+ 2 x 2 +. . 8
EXHIBIT 10. 1: Logistic regression analysis with one categorical variable as the independent variable 1 Response Variable: SUCCESS Number of Observations: 24 Link Function: Logit Response Levels: 2 Response Profile Ordered Value SUCCESS Count 1 1 12 2 2 12 22
Exhibit 10. 1 (continued) Criteria for Assessing Model Fit 2 Intercept and Covariates Chi-Square for Covariates 21. 864. 2 a Intercept Criterion Only AIC 35. 271 2 b SC 36. 449 24. 221 -2 LOG L 33. 271 17. 864 2 c 2 d Score . . . 15. 407 with 1 DF (p=0. 0001) 13. 594 with 1 DF (p=0. 0002) 23
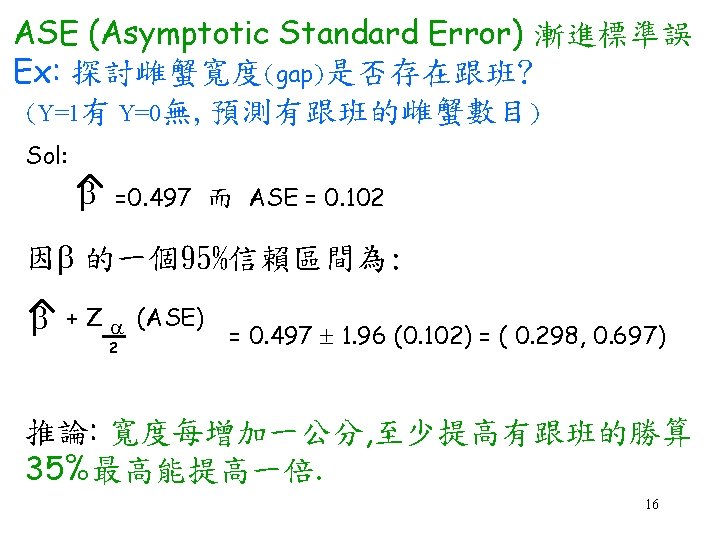
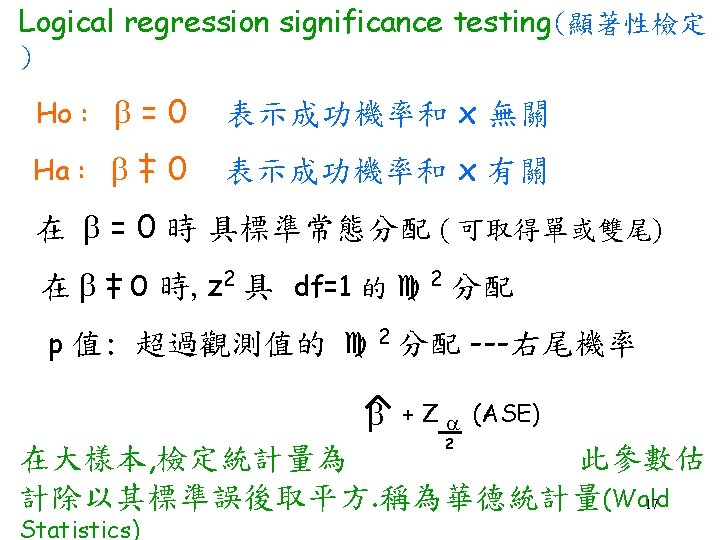
Exhibit 10. 1 (continued) Analysis of Maximum Likelihood Estimates Parameter Standard Wald Pr > Standardized Variable Estimate Error Chi-Square Estimate INTERCPT -1. 7047 0. 7687 4. 9181 0. 0266. SIZE 4. 0073 1. 3003 9. 4972 0. 0021 1. 124514 3 4 a Association of Predicted Probabilities and Observed Responses Concordant = 76. 4% Somers' D = 0. 750 Discordant = 1. 4% Gamma = 0. 964 Tied = 22. 2% Tau-a = 0. 391 (144 pairs) c = 0. 875 24
Exhibit 10. 1 (continued) 4 b Classification Table Predicted EVENT NO EVENT +-----------+ EVENT | 10 2 | Observed | | NO EVENT | 1 11 | +-----------+ Total 11 13 Total 12 12 24 Sensitivity= 83. 3% Specificity= 91. 7% Correct= 87. 5% False Positive Rate= 9. 1% False Negative Rate= 15. 4% NOTE: An EVENT is an outcome whose ordered response value is 1. 25
Exhibit 10. 1 (continued) 5 OBS 1 2 3 4 5 6 7 8 9 10 11 12 SUCCESS SIZE 1 1 1 1 1 1 0 PHAT OBS 0. 90909 13 0. 90909 14 0. 90909 15 0. 90909 16 0. 90909 17 0. 90909 18 0. 90909 19 0. 90909 20 0. 90909 21 0. 90909 22 0. 15385 23 0. 15385 24 SUCCESS 2 2 2 SIZE 1 0 0 0 PHAT 0. 90909 0. 15385 0. 15385 26
Exhibit 10. 2: Contingency Analysis Output TABLE OF SUCCESS BY SIZE SUCCESS SIZE Frequency| Percent | Row Pct | Col Pct | 1| 2| Total -------+----------+ 1| 10 | 2| 12 | 41. 67 | 8. 33 | 50. 00 | 83. 33 | 16. 67 | | 90. 91| 15. 38 | -------+----------+ 2| 1| 11 | 12 | 4. 17 | 45. 83 | 50. 00 | 8. 33 | 91. 67 | | 9. 09 | 84. 62 | -------+-----------+ Total 11 13 24 45. 83 54. 17 100. 00 27
Exhibit 10. 2 (continued) 1 STATISTICS FOR TABLE OF SUCCESS BY SIZE Statistic DF Value Prob -------------------------------------Chi-Square 1 13. 594 0. 000 Likelihood Ratio Chi-Square 1 15. 407 0. 000 Continuity Adj. Chi-Square 1 10. 741 0. 001 2 Statistic Value ASE -------------------------------------Gamma 0. 964 0. 046 Kendall's Tau-b 0. 753 0. 133 Stuart's Tau-c 0. 750 0. 134 Somers' D C|R 0. 750 0. 134 Somers' D R|C 0. 755 0. 132 28
Exhibit 10. 3: Logistic regression for categorical and continuous variables Step 0. Intercept entered: 1 Analysis of Maximum Likelihood Estimates Parameter Standard Wald Pr > Standardized Variable Estimate Error Chi-Square Estimate INTERCPT 0 0. 4082 0. 0000 1. 0000. Residual Chi-Square = 16. 5512 with 2 DF (p=0. 0003) 1 a 29
Exhibit 10. 3 (continued) 2 Analysis of Variables Not in the Model Variable SIZE FP Score Chi-Square 13. 5944 13. 8301 Pr > Chi-square 0. 0002 Step 1. Variable FP entered: 3 3 a Analysis of Variables Not in the Model Variable SIZE Score Chi-Square 5. 0283 Pr > Chi-Square 0. 0249 30
Exhibit 10. 3 (continued) 4 Step 2. Variable SIZE entered: Criteria for Assessing Model Fit Intercept 4 a Intercept and Criterion Only Covariates AIC 35. 271 17. 789 SC 36. 449 21. 323 -2 LOG L 33. 271 11. 789 Score. . Chi-Square for Covariates. . 21. 482 with 2 DF (p=0. 0001) 16. 551 with 2 DF (p=0. 0003) 31
Exhibit 10. 3 (continued) 4 b Analysis of Maximum Likelihood Estimates Parameter Variable Estimate Standard Error INTERCPT -4. 4450 SIZE 3. 0552 FP 1. 9245 1. 8432 1. 5981 0. 9116 Wald Chi-Square Pr > Standardized Chi-Square Estimate 5. 8159 3. 6550 4. 4570 0. 0159 0. 0559 0. 0348 . 0. 857342 1. 139820 32
Exhibit 10. 3 (continued) 4 c Association of Predicted Probabilities and Observed Responses Concordant = 95. 8% Discordant = 4. 2% Tied = 0. 0% (144 pairs) Somers' D = 0. 917 Gamma = 0. 917 Tau-a = 0. 478 c = 0. 958 NOTE: All explanatory variables have been entered into the model. Summary of Stepwise Procedure 4 d Variable Number Score Step Entered Removed In Chi-Square 1 FP 1 13. 8301 2 SIZE 2 5. 0283 Wald Chi-Square. . Pr > Chi 0. 0002 0. 0249 33
Exhibit 10. 3 (continued) 5 Classification Table Predicted EVENT NO EVENT +-----------+ EVENT | 9 3| Observed | | NO EVENT | 1 11 | +-----------+ Total 10 14 Total 12 12 24 Sensitivity= 75. 0% Specificity= 91. 7% Correct= 83. 3% False Positive Rate= 10. 0% False Negative Rate= 21. 4% 34
Exhibit 10. 3 (continued) 5 a NOTE: An EVENT is an outcome whose ordered response value is 1. OBS SUCCESS SIZE FP PHAT 11 1 0. 58 0. 43202 13 2 2 1 1 2. 80 0. 98199 3 1 1 2. 77 0. 98094 4 1 1 3. 50 0. 99525 5 1 1 2. 67 0. 97699 6 1 1 2. 97 0. 98695 7 1 1 2. 18 0. 94297 8 1 1 3. 24 0. 99220 9 1 1 1. 49 0. 81421 10 1 1 2. 19 0. 94400 11 1 0 2. 70 0. 67939 12 1 0 2. 57 0. 62265 OBS SUCCESS 1 2. 28 14 2 15 2 16 2 17 2 18 2 19 2 20 2 21 2 22 2 23 2 24 2 SIZE FP PHAT 0. 95248 0 1. 06 0. 08278 0 1. 08 0. 08575 0 0. 07 0. 01325 0 0. 16 0. 01572 0 0. 70 0. 04319 0 0. 75 0. 04735 0 1. 61 0. 20641 0 0. 34 0. 02208 0 1. 15 0. 09692 0 0. 44 0. 02664 0 0. 86 0. 05787 35
Exhibit 10. 4: Discriminant analysis for data in Table 10. 1 1 Canonical Discriminant Functions Pct of Cum Canonical After Wilks' Fcn Eigenvalue Variance Pct Corr Fcn Lambda Chi-square df Sig : 0. 310367 24. 570 2. 0000 1* 2. 2220 100. 00. 8304 : * Marks the 1 canonical discriminant functions remaining in the analysis. 2 Unstandardized canonical discriminant function coefficients Func 1 SIZE 1. 8552118 FP. 9162471 (Constant) -2. 3834923 36
Exhibit 10. 4 (continued) 3 Classification results Actual Group ----------- No. of Predicted Group Membership Cases 1 2 -------------- Group 1 12 11 91. 7% 1 8. 3% Group 2 12 1 8. 3% 11 91. 7% Percent of "grouped" cases correctly classified: 91. 67% 37
Exhibit 10. 5: Logistic Regression For Mutual Fund Data Stepwise Selection Procedure Criteria for Assessing Model Fit 1 a 1 Criterion Intercept Only Intercept and Covariates AIC SC -2 LOG L Score 190. 400 193. 327 188. 400. 147. 711 165. 275 135. 711. 1 b Chi-Square for Covariates. . 52. 689 with 5 DF (p=0. 0001) 44. 034 with 5 DF (p=0. 0001) NOTE: All explanatory variables have been entered into the model. 38
Exhibit 10. 5 (continued) 2 Summary of Stepwise Procedure Variable Number Score Step Entered Removed In Chi-Square 1 YIELD 1 21. 0379 2 TOTRET 2 11. 9103 3 SIZE 3 8. 5928 4 SCHARGE 4 4. 1344 5 EXPENRAT 5 5. 5516 Wald Chi-Square. . . Pr > Chi-Square 0. 0001 0. 0006 0. 0034 0. 0420 0. 0185 39
Exhibit 10. 5 (continued) 3 Analysis of Maximum Likelihood Estimates Variable INTERCPT SIZE SCHARGE EXPENRAT TOTRET YIELD Parameter Estimate -2. 5902 0. 8542 -0. 1394 - 1. 4361 0. 8090 0. 0553 Standard Wald Error Chi-Square 1. 2642 4. 1981 0. 4773 3. 2020 0. 0589 5. 6088 0. 6793 4. 4699 0. 2509 10. 3988 0. 0124 19. 9669 Pr > Standardized Chi-Square Estimate 0. 0405. 0. 0735 0. 236320 0. 0179 -0. 302154 0. 0345 -0. 321113 0. 0013 0. 402480 0. 0001 0. 694773 40
Exhibit 10. 5 (continued) 4 Association of Predicted Probabilities and Observed Responses Concordant Discordant Tied (4661 pairs) = 85. 5% = 14. 4% = 0. 1% Somers' D Gamma Tau-a c = 0. 711 = 0. 712 = 0. 351 = 0. 856 41
Exhibit 10. 5 (continued) 5 Classification Table Predicted EVENT NO EVENT Total +-----------+ EVENT ] 45 14 ] 59 Observed ] ] NO EVENT ] 12 67 ] 79 +-----------+ Total 57 81 138 Sensitivity= 76. 3% Specificity= 84. 8% Correct= 81. 2% False Positive Rate= 21. 1% False Negative Rate= 17. 3% 42