Logistic Regression Principal Component Analysis Sampling Logistic Regression

: Where:")


NB model Factoring the model")


 Suppose I have the following data: Uncorrelated Data")


; M =")


- Slides: 25
Logistic Regression Principal Component Analysis Sampling
Logistic Regression: A form of Generalized Linear Model (GLM): Where:
Logistic Regression Model Classification Rule:
Decision Surface: We say Y=0 when: Therefore: Which leads to:
How do we choose weights? We want: Writing the log-likelihood: Rearranging terms: Simplifying: Take the derivative:
Minimizing the derivative: Derivative: Can’t be analytically solved so we use gradient ascent: … or you could use: Matlab
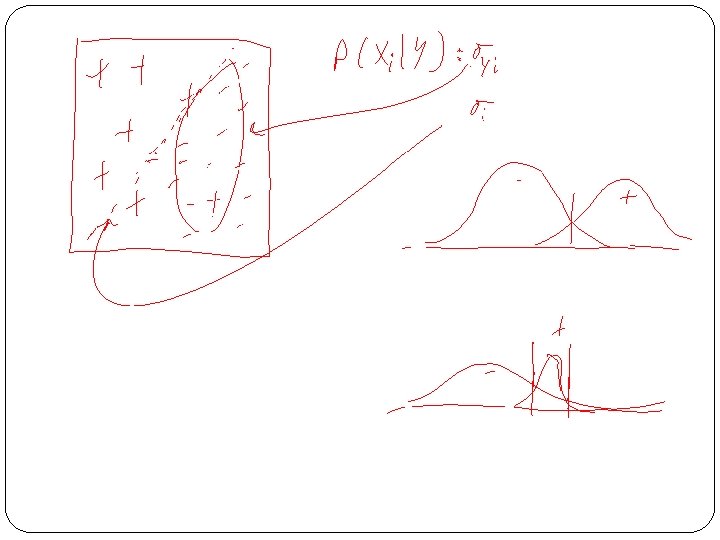
Gaussian Naïve Bayes Class Label: Features: X 1 Y X 2 General Gaussian Naï ve Bayes equation: We can impose different assumptions about the class variances. Mathematica Demo X 3
Relation between GNB and LR Prediction Probability from the (G)NB model Factoring the model we get:
Further Expansion More Algebra Assume variance does not depend on class label.
Finally! We have shown that this: Can be written like this: Which is the same form as:
Big Question? Can I compute the LR weights by learning a NB classifier?
Singular Value Decomposition Principal Component Analysis
The main idea (in 2 Dimensions) Suppose I have the following data: Uncorrelated Data Z 2 X 2 Z 1 Z 1 X 1 Anomaly Detection Z 1 “High dimensional correlated data” Low dimensional Approximation
Your face as a Linear Combination Suppose I wanted to represent your face as a weighted mixture of faces: ≈ z 1 z + 2 z + 3 Could I accurately represent myself as a combination of these faces? What are the “optimal” faces to represent my face as?
Graphical Intuition Subtract the average face: Example Average Faces: http: //www. uni-regensburg. de/Fakultaeten/phil_Fak_II/Psychologie/Psy_II/beautycheck/english/index. htm
Now I express my face as: Second Eigenface Second Eigenvector ≈ + z 1 z + 2 z + 3 First Eigenface First Eigenvector
The Math behind SVD The SVD “Function”: Matrix decomposition X 1 X 2 X 3 X 4 X 5 X 6 = S U T V When you call svd in matlab: %> [u, s, v] = svds(X, 100); Then: X ≈ u * s * v’ Don’t Forget
Matlab Example: Why don’t I subtract the mean? z = randn(1000, 2); M = [1, 2; 3, 1]; x = z * M; subplot(1, 2, 1); plot(z(: , 1), z(: , 2), '. '); axis('equal') subplot(1, 2, 2); plot(x(: , 1), x(: , 2), '. '); axis('equal') [u, d, v] = svds(M, 2); vtrans = sqrt(d) * v'; line([0, vtrans(1, 1)], [0, vtrans(1, 2)], 'Color', 'Linewidth', 5); line([0, vtrans(2, 1)], [0, vtrans(2, 2)], 'Color', 'g', 'Linewidth', 5);
SVD and PCA Typically PCA is thought of as finding the eigenvectors of the Covariance Matrix Want to find a single dimension (vector) z to project onto Average Vector: Covariance: The projected variance becomes: Add the constraint: Unconstrained Lagrangian Optimization: Setting derivative equal to zero and solving:
SVD finds the PCA Eigenvectors: Lets assume that the data matrix X is zero mean Assume: The covariance of X is: Then by some linear algebra: Where V are the eigenvectors of the covariance matrix.
Gibbs Sampling
Image Denoising Problem Graphical represent of local statistical dependencies Observed Random Variables Noisy Picture Inference What is the probability that this pixel is black? Local Dependencies Continuity Assumptions Latent Pixel Variables “True” Pixel Values
Some real Synthetic Data:
Conditioning on the Markov Blanket f 1 Collect the joint assignment to all variables as a single sample and repeat. Xi f 4 1 f 3 f 2 0 1 Sweep: For each vertex in the model (in some order): 1