Logistic Logistic regression logistic Monday January Monday January


个单位 Monday, January")


 Monday, January")


 satisfied. Model Fit Statistics Intercept and Criterion")


- Slides: 50
Logistic回归 Logistic regression
一、logistic回归模型 Monday, January
概率预报模型 Monday, January
参数估计的公式 Monday, January
SAS程序 Monday, January
The LOGISTIC Procedure Analysis of Maximum Likelihood Estimates Monday, January
预报模型 Monday, January
The LOGISTIC Procedure Analysis of Maximum Likelihood Estimates Monday, January
预报模型 Monday, January
Monday, January
优势比改变exp(bj)个单位 Monday, January
Monday, January
Monday, January
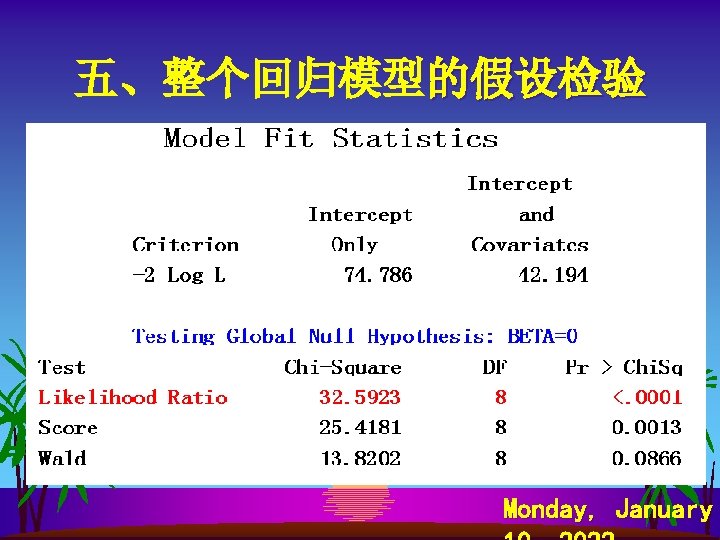
似然比检验(likelihood ratio test) Monday, January
ROC曲线模型评价 Monday, January
ROC曲线模型评价 图 16 -2 Logistic回归预报能力的ROC曲线 Monday, January
第二节. 条件logistic回归 Monday, January
条件似然函数 Monday, January
1: 3配对的例子 Monday, January
1: 2配对的例子 Monday, January
表 16 -7条件logistic回归的SAS程序 Monday, January
结果 Monday, January
SPSS软件计算 s s s s Analyze Regression Binary Logistic… Dependent: y Covariates: x 1~ x 8 Method: Forward Ward Save…—— Predicted Values Probabilities Group membership Option—— CI for exp 95% Probability for Stepwise Entry: 0. 1 Removal 0. 15 Monday, January
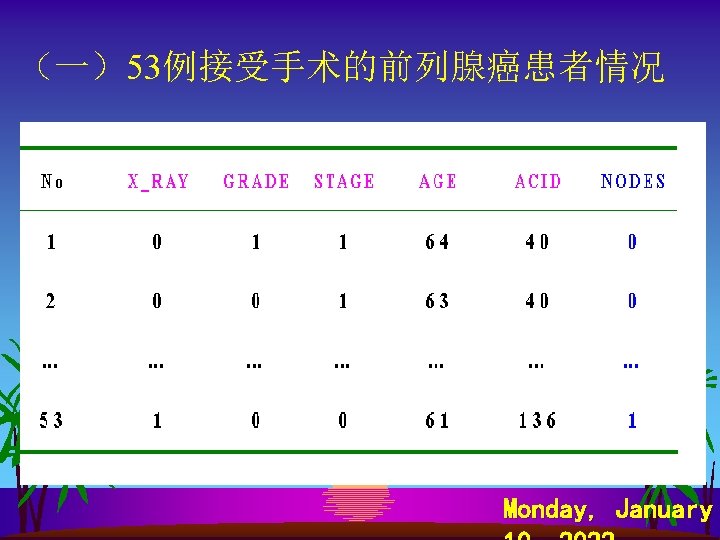
DATA samp 16_1; INPUT x_ray grade stage acid nodes; CARDS; . . . ; PROC LOGISTIC DESCENDING; MODEL nodes=x_ray grade stage acid/RISKLIMITS; OUTPUT OUT=pred PROB=pred; PROC PRINT DATA=pred; RUN; Monday, January
The SAS System 22: 07 Monday, November 29, 2005 1 The LOGISTIC Procedure Model Information Data Set WORK. SAMP 16_1 Response Variable nodes Number of Response Levels 2 Number of Observations 53 Model binary logit Optimization Technique Fisher's scoring Response Profile Ordered Value 1 2 nodes 1 0 Total Frequency 20 33 Probability modeled is nodes=1.
Model Convergence Status Convergence criterion (GCONV=1 E-8) satisfied. Model Fit Statistics Intercept and Criterion Only Covariates AIC SC -2 Log L 72. 252 74. 222 70. 252 60. 126 71. 948 48. 126 Testing Global Null Hypothesis: BETA=0 Test Chi-Square DF Likelihood Ratio 22. 1264 Score 19. 4514 5 Wald 13. 1406 5 Pr > Chi. Sq 5 0. 0005 0. 0016 0. 0221
The SAS System 22: 07 Monday, November 29, 2005 2 The LOGISTIC Procedure Analysis of Maximum Likelihood Estimates Parameter Intercept x_ray grade stage acid DF Standard Estimate Wald Error Chi-Square 1 0. 0618 3. 4599 1 2. 0453 0. 8072 1 0. 7614 0. 7708 1 1. 5641 0. 7740 1 -0. 0693 0. 0579 1 0. 0243 0. 0132 0. 0003 6. 4208 0. 9759 4. 0835 1. 4320 3. 4230 Pr > Chi. Sq 0. 9857 0. 0113 0. 3232 0. 0433 0. 2314 0. 0643
The SAS System 22: 07 Monday, November 29, 2005 2 The LOGISTIC Procedure Analysis of Maximum Likelihood Estimates Parameter Intercept x_ray grade stage acid DF 1 1 1 Standard Estimate 0. 0618 2. 0453 0. 7614 1. 5641 -0. 0693 0. 0243 Wald Error Chi-Square 3. 4599 0. 8072 0. 7708 0. 7740 0. 0579 0. 0132 0. 0003 6. 4208 0. 9759 4. 0835 1. 4320 3. 4230 Odds Ratio Estimates Point 95% Wald Effect Estimate Confidence Limits x_ray 7. 732 1. 589 37. 614 grade 2. 141 0. 473 9. 700 stage 4. 778 1. 048 21. 783 age 0. 933 0. 833 1. 045 acid 1. 025 0. 999 1. 051 Pr > Chi. Sq 0. 9857 0. 0113 0. 3232 0. 0433 0. 2314 0. 0643
Association of Predicted Probabilities and Observed Responses Percent Concordant 84. 5 Somers' D Percent Discordant 15. 2 Gamma Percent Tied 0. 3 Tau-a Pairs 660 c 0. 694 0. 696 0. 332 0. 847 Wald Confidence Interval for Adjusted Odds Ratios Effect Unit x_ray grade stage acid 1. 0000 Estimate 7. 732 2. 141 4. 778 0. 933 1. 025 95% Confidence Limits 1. 589 0. 473 1. 048 0. 833 0. 999 37. 614 9. 700 21. 783 1. 045 1. 051
Obs no x_ray 1 2 3 4 0 0 1 0 grade 1 0 0 1 。。。。。 50 51 52 53 1 0 1 1 stage 1 1 0 0 age acid 64 63 65 67 40 40 46 47 。。。。。。 0 1 1 0 1 0 64 59 68 61 nodes 0 0 _LEVEL_ 1 1 pred 0. 25511 0. 14633 0. 21842 0. 06459 。。。。。 。 89 99 126 136 1 1 1 1 0. 80302 0. 29880 0. 94215 0. 76730