DIABETES ECONOMY Amini Masoud 1398 Socioeconomic Conditions And

DIABETES ECONOMY Amini Masoud 1398


Socio-economic Conditions And Health n n n n ECONOMIC STATUS EDUCATION OCCUPATION POLITICAL SYSTEM HOUSING EMPLOYMENT POVERTYAND AFFLUENCE


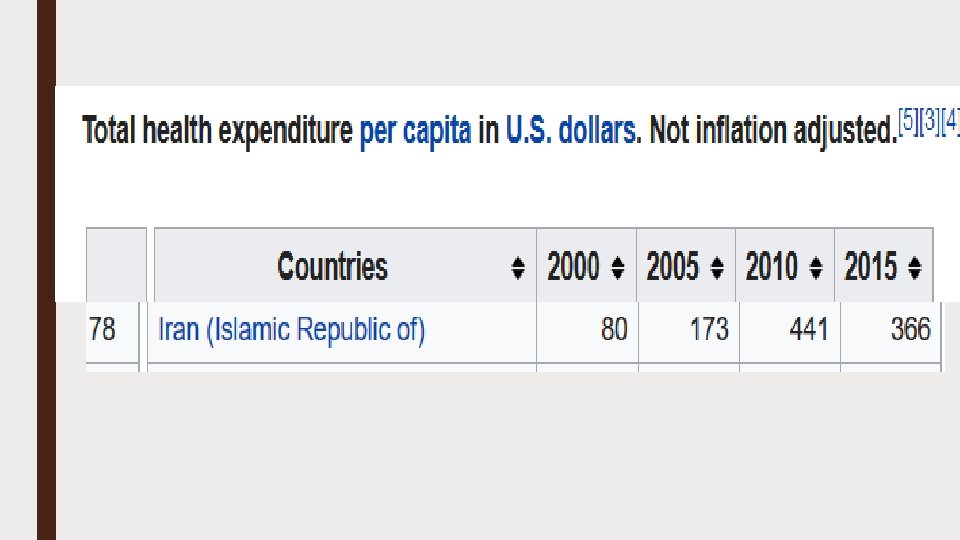

Introduction Health expenditure and Income Country USA France Gulf Countries Iran Turkey Arabs in Asia Arabs in Africa Pakistan Gross Income per Capita (US dollars) 23, 000 17, 000 2, 647 500 - 1, 100 1, 000 452 Expenditure by government on health (per capita) (US$) 2000 1800 150 -550 180 200 80 -150 7 -125 15

 is a progressive disease. Achieving glycemic control")
Type 2 diabetes mellitus (T 2 DM) is a progressive disease. Achieving glycemic control and controlling cardiovascular risk factors have been conclusively shown to reduce diabetes complications, mortality. comorbidities,

Most notably, the report revealed that the economic costs of diabetes increased 26 percent from 2012 to 2017, due to both the increased prevalence of the disease and the increased cost person living with diabetes.

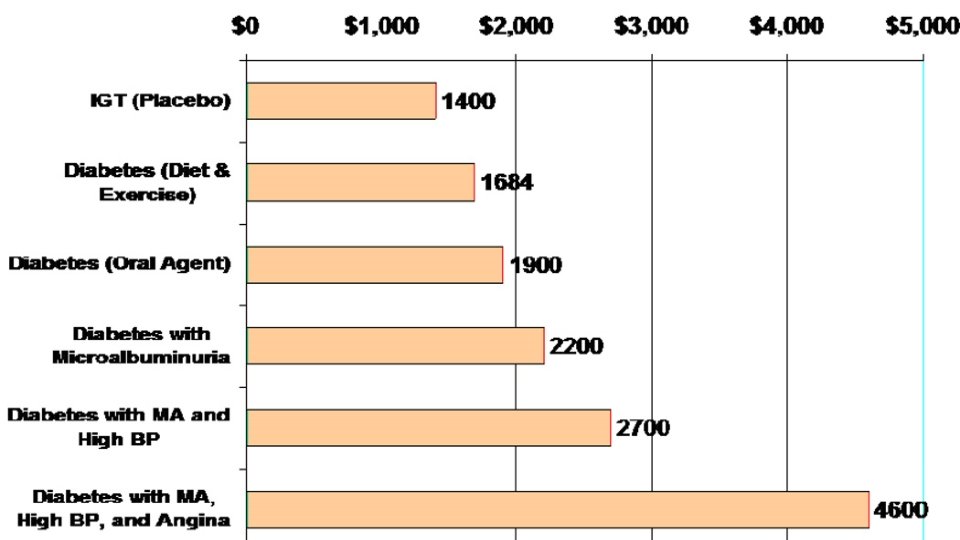
People with diagnosed diabetes incur average medical expenditures of ∼$16, 750 per year, of which ∼$9, 600 is attributed to diabetes.

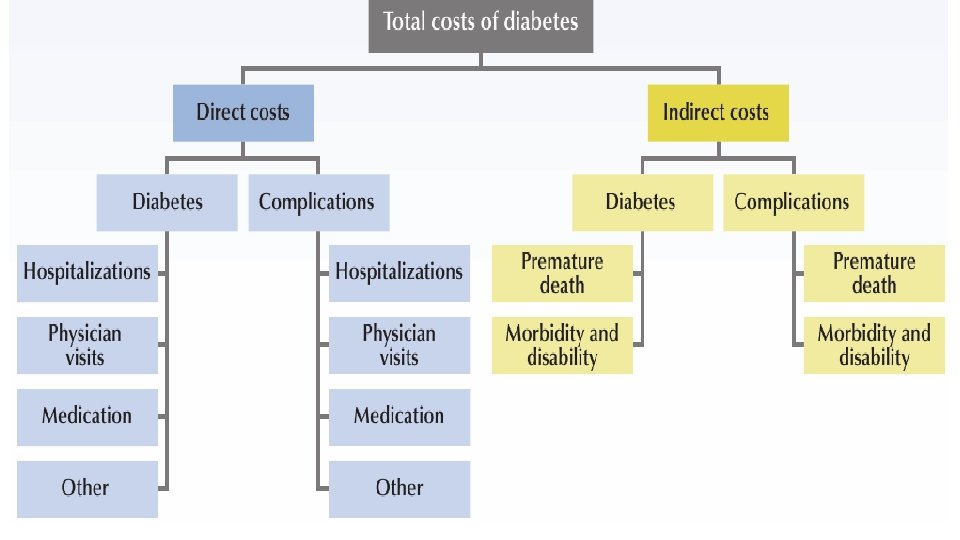
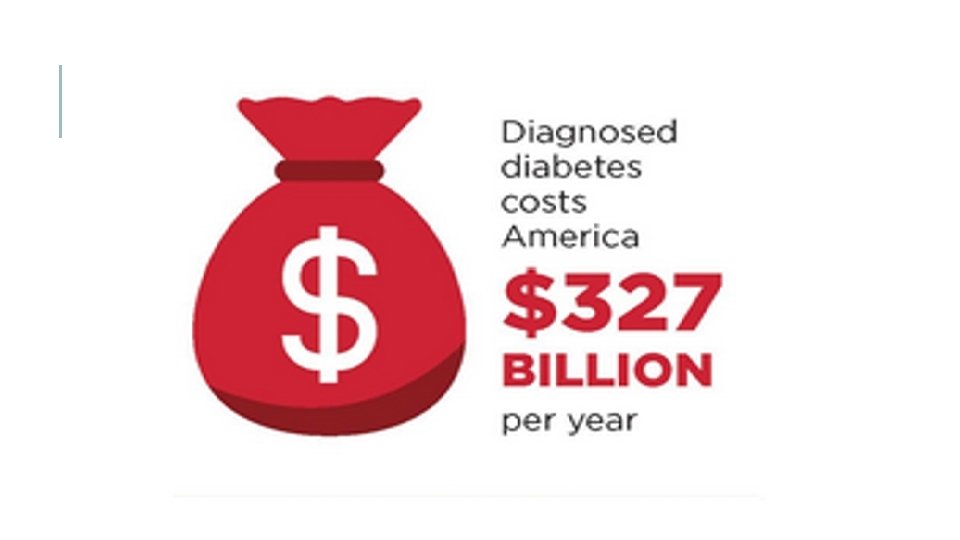
The total estimated cost of diagnosed diabetes in 2017 is $327 billion, including $237 billion in direct medical costs and $90 billion in reduced productivity.
. • Reduced productivity")
Indirect costs: $90 billion, including, • Increased absenteeism ($3. 3 billion). • Reduced productivity at work ($26. 9 billion) for the employed population
. • Inability to")
. • Reduced productivity for those not employed ($2. 3 billion). • Inability to work as a result of disease related disability ($37. 5 billion). • Lost productive capacity due to early mortality ($19. 9 billion).

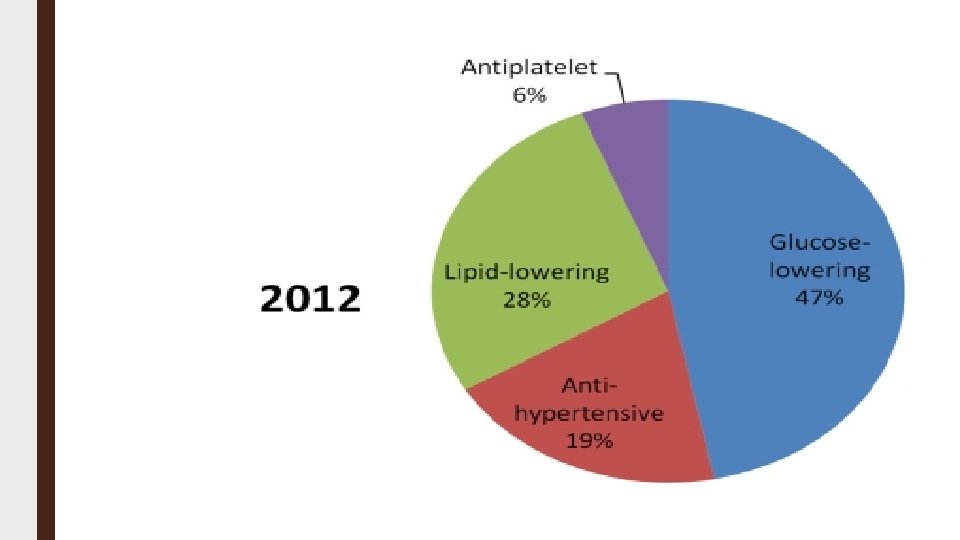
Direct medical costs: $237 billion (57% of the total medical costs including, • Hospital inpatient care ($69. 7 billion). • Prescription medications to treat the complications of diabetes ($71. 2 billion).

Together, these two direct costs account for 60 percent of the total amount. The remaining costs include: • antidiabetic agents • diabetes supplies • physician’s office visits
. • Physician office visits")
• Antidiabetic agents and diabetes supplies ($34. 6 billion). • Physician office visits ($30. 0 billion). • Nursing/residential facility stays ($6. 4 billio
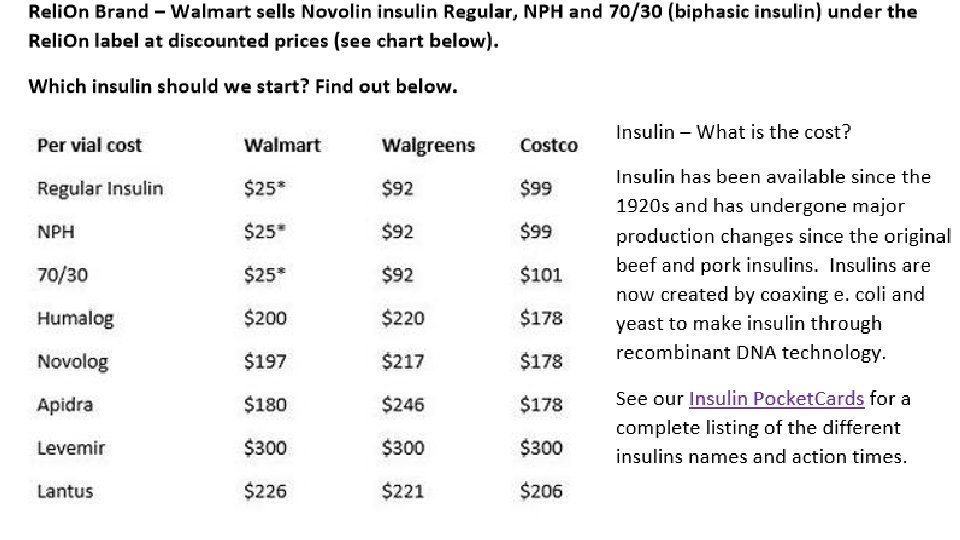

Annual spending on insulin per patient increased from $231 to $736. over the study period. By 2013, the per -patient spending on insulin was greater than the perpatient combined spending on other diabetes drugs, which was $502.

November 20, 2018 Global study predicts 20 -percent rise in insulin use by 2030 — but half the world's diabetics who need it won’t get i

The average price of insulin analogs tripled between 2002 and 2013, from an average of $4. 34/m. L to $12. 92/m. L. [1] In 2017, Americans spent $31 billion on diabetes medications, $15 billion of which was for insulin.

The availability of newer glucose-lowering medications such as dipeptidyl peptidase-4 inhibitors, glucagon-like peptide-1 agonists, and sodium-glucose cotransporter-2 inhibitors probably had minimal effect, as they had lower penetration at the time of the surveys, in part because of high cost and low reimbursement. But at the same time, the skyrocketing cost of insulin may well have presented a barrier, the editorialists note.

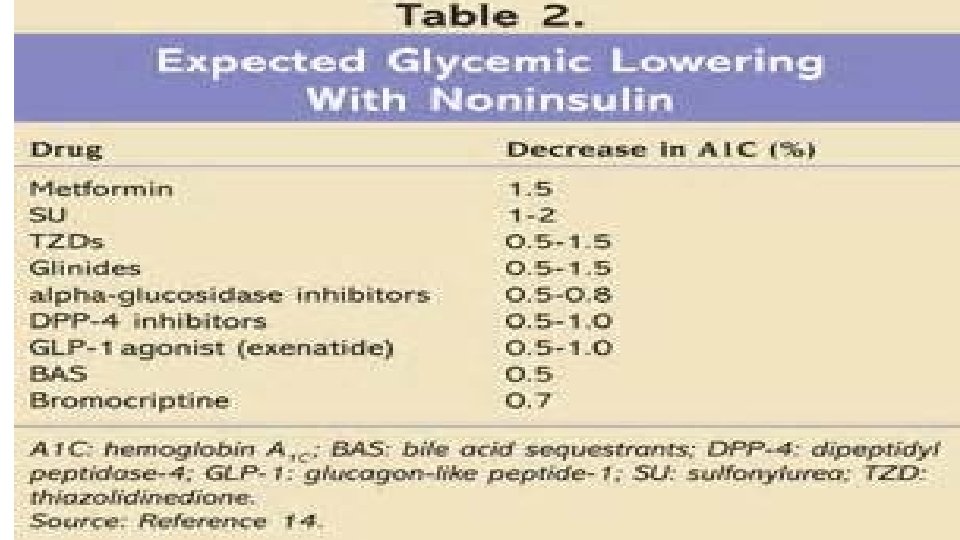
. Despite the approval of 40 new treatment options for type 2 diabetes since 2005 these therapies and approaches have not had a meaningful impact on the degree of glycemic control in a large subset of the population with diabetes
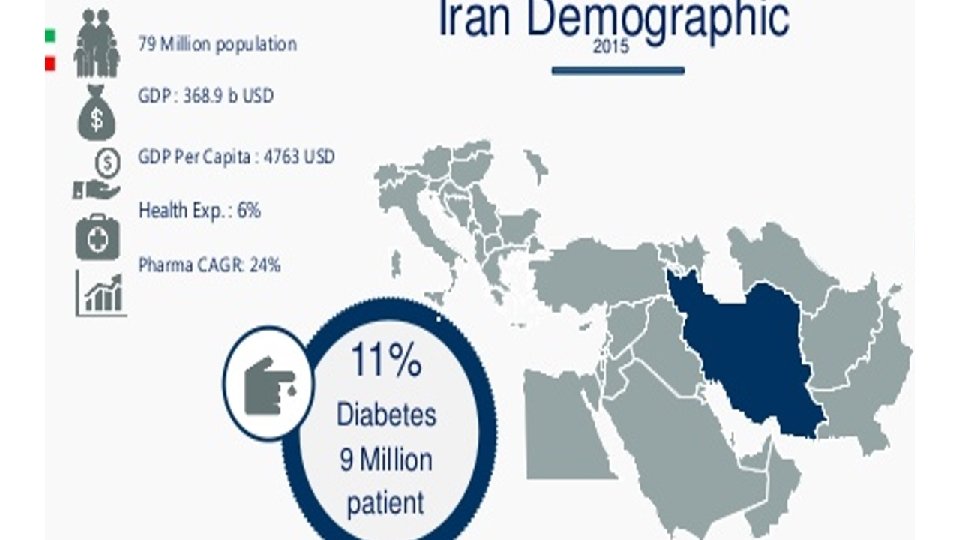

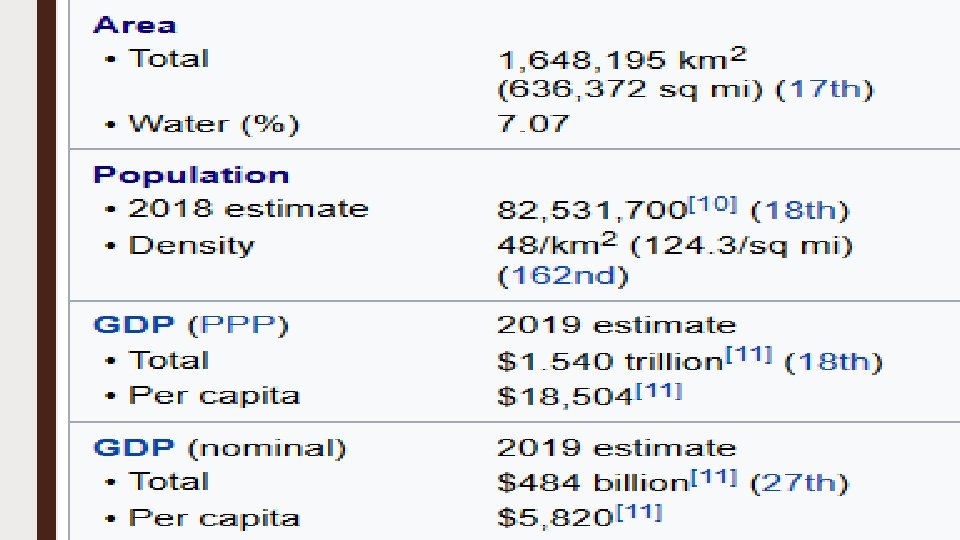
Direct costs of T 2 D were estimated to be about 8. 7% of the total health expenditure in Iran. 4


Moreover, management of diabetes complications comprises the largest share of direct costs. 8 It has been concluded that the direct and indirect annual health care costs for an Iranian patient with diabetes is about 2. 5 times higher than a healthy Iranian citizen. 8

Cost-of-Illness Analysis of Type 2 Diabetes Mellitus in Iran Mehdi Javanbakht , Hamid R. Baradaran, Atefeh Mashayekhi, Ali Akbar Haghdoost, Mohammad E. Khamseh, Erfan Kharazmi, Aboozar Sadeghi PLOS Published: October 31, 2011 https: //doi. org/10. 1371/journal. pone. 0026864

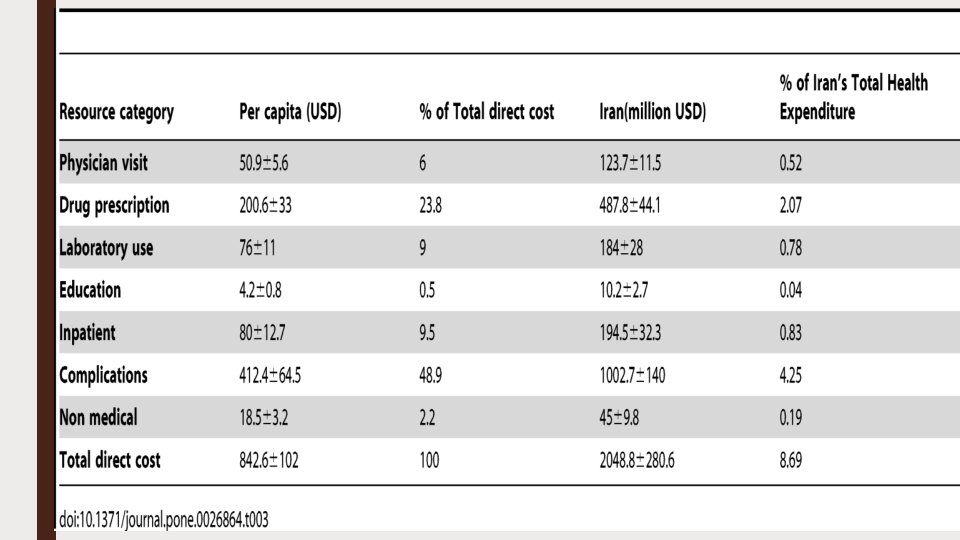
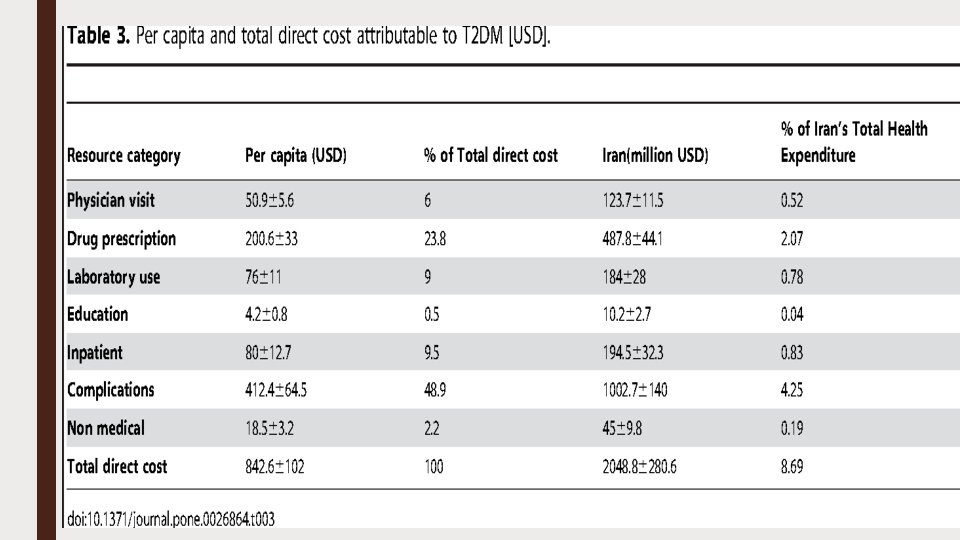
The total national cost of diagnosed T 2 DM in 2009 is estimated at 3. 78 billion USA dollars (USD) including 2. 04± 0. 28 billion direct (medical and non-medical) costs and indirect costs of 1. 73 million. Average direct and indirect cost per capita was 842. 6± 102 and 864. 8 USD respectively
 and drugs (23. 8%) were main components of direct cost.")
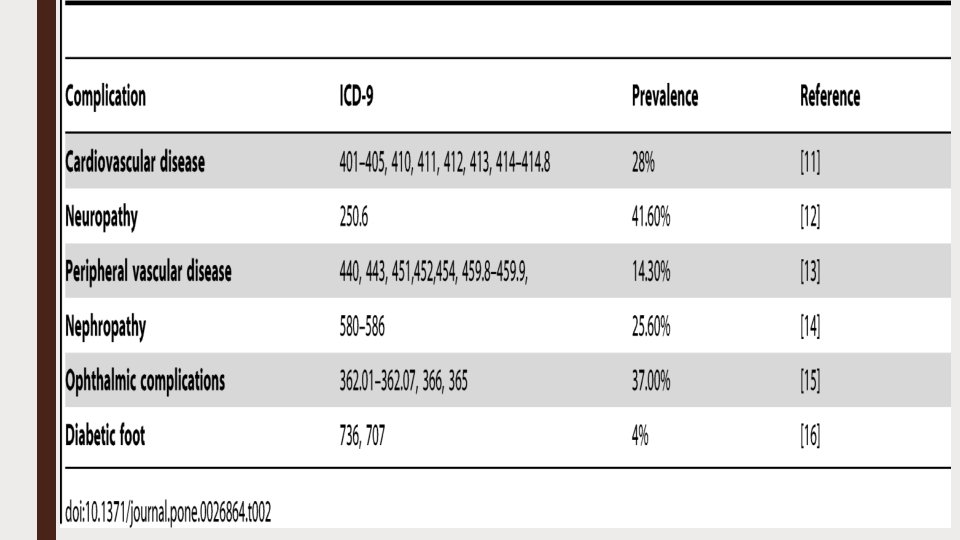
. Complications (48. 9%) and drugs (23. 8%) were main components of direct cost. The largest components of medical expenditures attributed to diabetes's complications are cardiovascular disease (42. 3% of total Complications cost), nephropathy (23%) and ophthalmic complications (14%).
, permanent disability (452. 4 million) and")
Indirect costs include temporarily disability (335. 7 million), permanent disability (452. 4 million) and reduced productivity due to premature mortality (950. 3 million).


Diabetologia August 2009, Volume 52, Issue 8, pp 1520– 1527 | Cite as The economic costs of diabetes: a populationbased study in Tehran, Iran

Total annual direct costs of diabetic and control participants were $152. 3 ± 14. 5 and $52. 0 ± 5. 8, respectively, which is indicative of 2. 92 times higher costs in diabetic patients. The most expensive components of direct costs were medications and devices, and hospitalisation in diabetic patients (28. 7% and 28. 6%, respectively).

Total indirect costs were $39. 6 ± 2. 4 and $16. 7 ± 1. 1 in diabetic and non-diabetic individuals. The aggregate annual direct costs of diabetes were estimated to be $112. 424 ± 10. 732 million and $590. 676 ± 65. 985 million in Tehran and Iran, respectively. Diabetes complications contributed 53% of the aggregate excess direct costs of diabetes.

- Slides: 78