Analytic Epidemiologic Study Panithee Thammawijaya MD Ph D


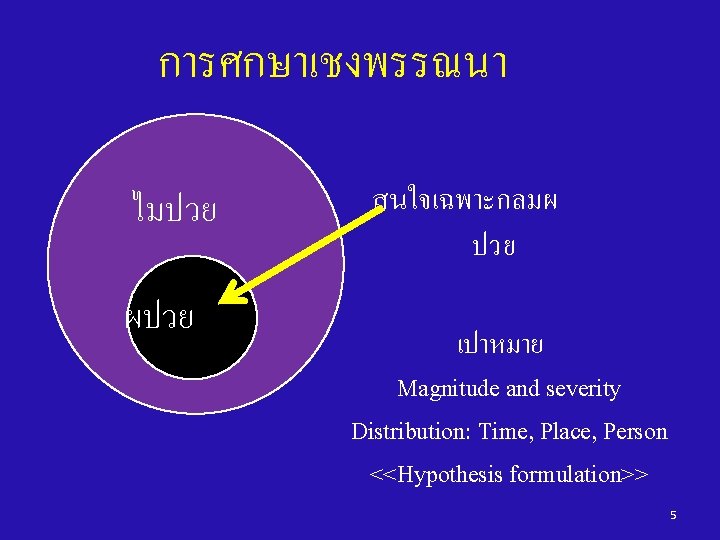
 การศกษาเชงพรรณนา Descriptive Study (ไมมกลมเปรยบเทยบ Case report Case")

 Mr. A • 20 -yrs male,")
 Mr. A • 20 -yrs male,")
 Mr. A • 20 -yrs male,")
 Mr. A • 20 -yrs male,")


 at start Exposed เกดโรค ไมเกดโรค Not Exposed เกดโรค ไมเกดโรค 21")


")

 Ill")


 and compares them")


 is chance or proportion that the event")


 • identify and enroll all incident cases")


 (Case-control study) Case Control Ate ice")
 (Case-control study) How to interpret OR")


 – so")
 • Cannot estimate disease")


- Slides: 74
Analytic Epidemiologic Study Panithee Thammawijaya, MD Ph. D Bureau of Epidemiology 1
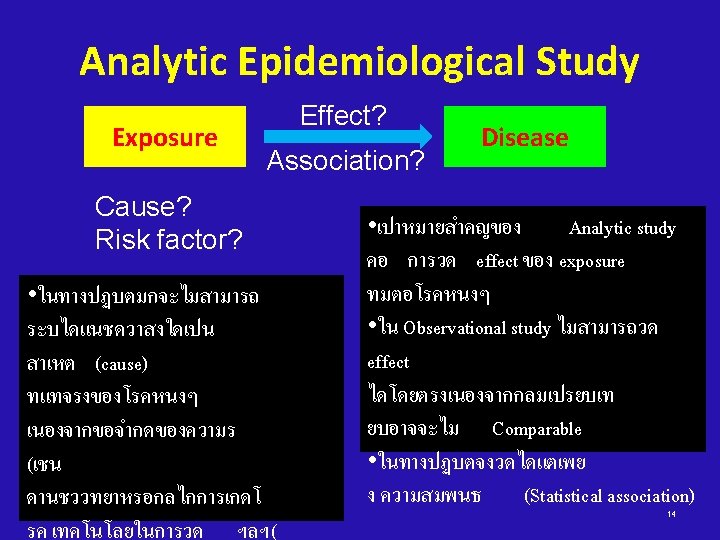
How epidemiologists work? 1. Counting: Counts cases or health events, and describes them in terms of time, place, and person Descriptive Epidemiology 2. Dividing: Divides the number of cases by an appropriate denominator to calculate “rates” 3. Comparing: Compares these “rates” over time or for different groups of people * Rate, in this case, simply means division of one number by another Analytic Epidemiology
Classification epidemiological study Observational Study (natural exposure) การศกษาเชงพรรณนา Descriptive Study (ไมมกลมเปรยบเทยบ Case report Case series From: modified from Ram Rungsin Experimental Study (exposure given by researcher) ) การศกษาเชงวเคราะห Analytic Study (มกลมเปรยบเทยบ ) Cross – sectional Case control Cohort 3
ลำดบชนของการศกษาทางดานระบาด วทยา Case report: a hypertension case in young adult Case series: three hypertension cases in young adults Descriptive Cross – sectional study: a hypertension survey Cross – sectional study: HT vs Salt consumption Case – control study: HT vs Salt consumption Analytic Cohort study: HT vs Salt consumption Clinical trial: Beta blocker vs Hypertension From: Ram Rungsin Experiment 4
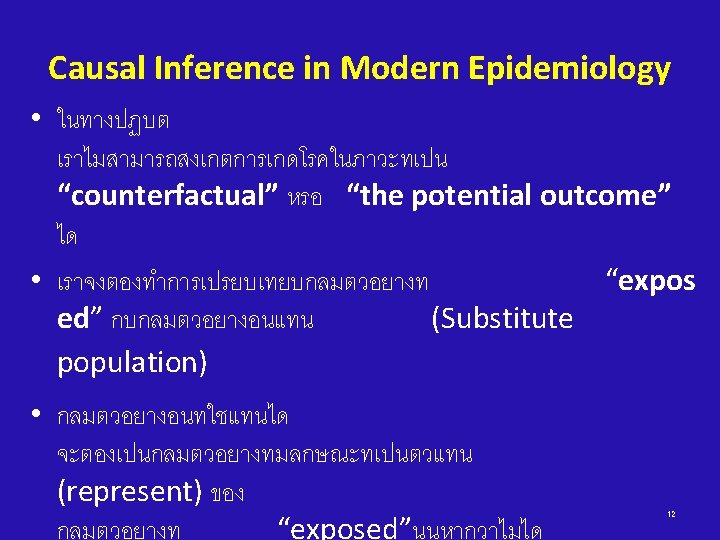
What Is the “Cause” of a Disease? (1) Mr. A • 20 -yrs male, Thai, farmer, etc. Counterfactual-not observed 1990 2010 Event actually occurred-observed Mr. A • 20 -yrs male, Thai, farmer, etc. Did pumpkin have an effect on the disease in Mr. A? Yes, causative effect.
What Is the “Cause” of a Disease? (2) Mr. A • 20 -yrs male, Thai, farmer, etc. Counterfactual-not observed 1990 2010 Event actually occurred-observed Mr. A • 20 -yrs male, Thai, farmer, etc. Did pumpkin have an effect on the disease in Mr. A? No. He is doomed.
What Is the “Cause” of a Disease? (3) Mr. A • 20 -yrs male, Thai, farmer, etc. Counterfactual-not observed 1990 2010 Event actually occurred-observed Mr. A • 20 -yrs male, Thai, farmer, etc. Did pumpkin have an effect on the disease in Mr. A? No. He is immune.
What Is the “Cause” of a Disease? (4) Mr. A • 20 -yrs male, Thai, farmer, etc. Counterfactual-not observed 1990 2010 Event actually occurred-observed Mr. A • 20 -yrs male, Thai, farmer, etc. Did pumpkin have an effect on the disease in Mr. A? Yes, protective effect.
What Is the “Cause” of a Disease? Unexposed group • age 15 -25 yrs 1990 ? 2010 Exposed group • age 15 -25 yrs ? Did pumpkin have an effect on the disease in population? Validity & Precision?
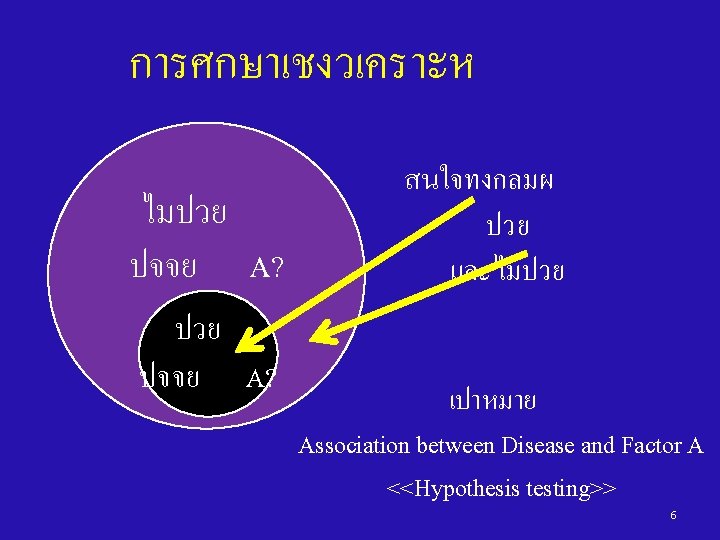
การศกษาเชงวเคราะห • Cohort Study • Case – Control Study • Cross – sectional Study 15
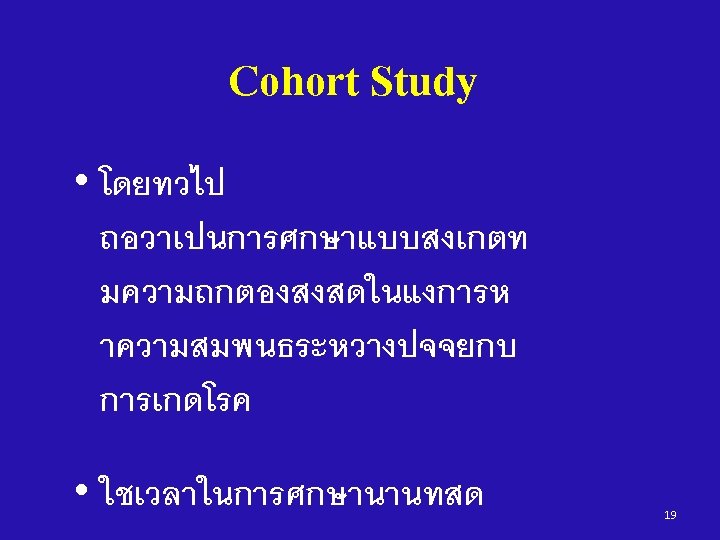
Cohort study A study in which the incidence proportion/rate of disease in 2 or more cohorts is compared 16
A Roman Cohort = A unit of 300 -600 men in the ancient Roman army Two centuries made one maniple and three maniples made up one cohort. 17
“COHORT” in Epidemiology = A group of persons who are followed over time 18
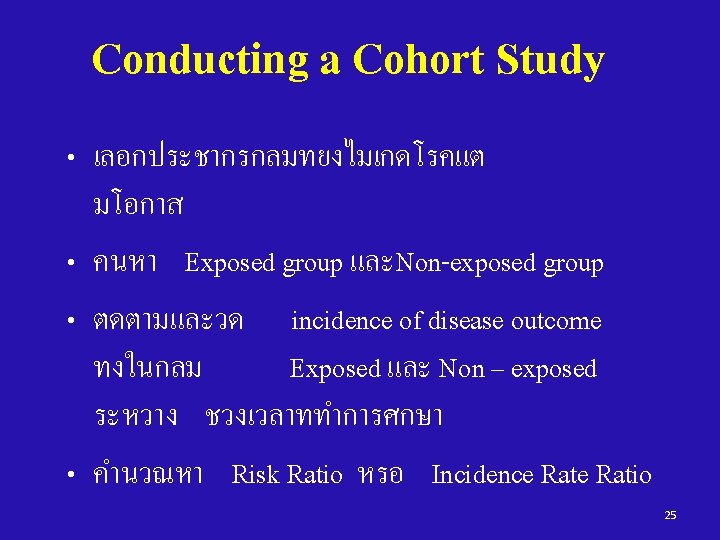
Person at-risk (without disease) at start Exposed เกดโรค ไมเกดโรค Not Exposed เกดโรค ไมเกดโรค 21
Persons without the disease !!!! 1970 Exposed Not Exposed Smoke #500 persons Not Smoke #500 persons Disease No Disease 2001 Disease No Disease Lung Cancer No Lung Cancer # 455 # 1 # 499 22
Risk Ratio CA Lung No CA Smoke A B A+B Not smoke C D C+D Risk Ratio = A/A+B C/C+D 23
CA Lung No CA Smoke 45 455 500 Not smoke 1 499 500 • Incidence of Smoker who develop Lung Cancer = 45/500 • Incidence of Non -Smoker whodevelop Lung Cancer = 1/500 • Risk Ratio of smoking for Lung Cancer = 45 • ผทสบบหรมโอกาสเกดโรคมะเรงปอดมากกว 24
Design 1: Prospective Cohort Study Time of Study Begin Cause Direction of inquiry Effect Disease Population Sampling? People without disease Exposed No disease Disease Unexposed No disease • If the study started before the disease occurred… 26 “Prospective cohort study”
Ex: A Study of Smoking and Lung Cancer (Prospective cohort study with person-time data) No. of Case F/U time (person-year) Smoking 90 30, 526 Non smoking 10 28, 364 Total 100 58, 890 Incidence rate in smokers = 90 / 30, 526 = 2. 9 per 1000 person-years Incidence rate in non-smokers = 10 / 28, 364 = 0. 5 per 1000 person-years Incidence Rate ratio (IRR) Rate of developing the disease in smokers is = 2. 9/0. 5 5. 8 times of that in non-smokers = 5. 8 27
Design 2: Retrospective Cohort Study Time of Study Begin Cause Direction of inquiry Effect Disease Population Sampling? People without disease Exposed No disease Disease Unexposed No disease • If the study started after the disease occurred… 28 “Retrospective (Historical) cohort study”
Ex: An Diarrhea Outbreak in a Party (Retrospective Cohort study with count data) Ill Not ill Total Ate salad 150 50 200 Not eat 10 90 100 Total 160 140 300 Incidence proportion in exposed group = 150 / 200 = 75% Incidence proportion in non-exposed group = 10 / 100 = 10% Risk ratio = 75/10 = 7. 5 Risk of developing the disease in exposed group is 29 7. 5 times of that in non-exposed group
Interpretation of RR, OR, and PR RR, IRR, OR, PR 1 0 Protective Effect or Negative Association stronger weaker ∞ Causative Effect or Positive Association weaker The null value (no association) stronger 30
Cohort Studies - Advantages • Can measure disease incidence • Can study the natural history • Provides strong evidence of casual association between E and D (time order is known) • Multiple diseases can be examined • Good choice if exposure is rare (assemble special exposure cohort) • Generally less susceptible to bias 31
Cohort Studies - Disadvantages • Takes time, need large samples, expensive • Not useful for rare diseases/outcomes • With prolonged time period: – Exposures change during follow-up period • Selection Bias (loss-to-follow up in pros. cohort or selective survival in retro. cohort) • Information Bias (recall bias in retro. Cohort) 32
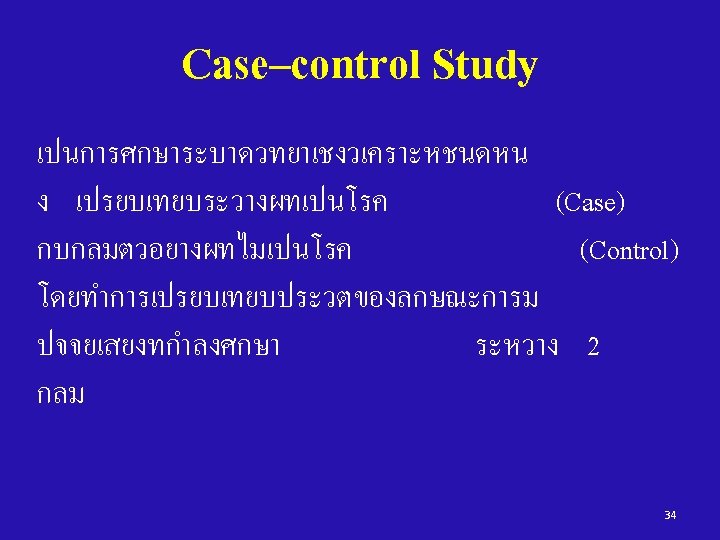
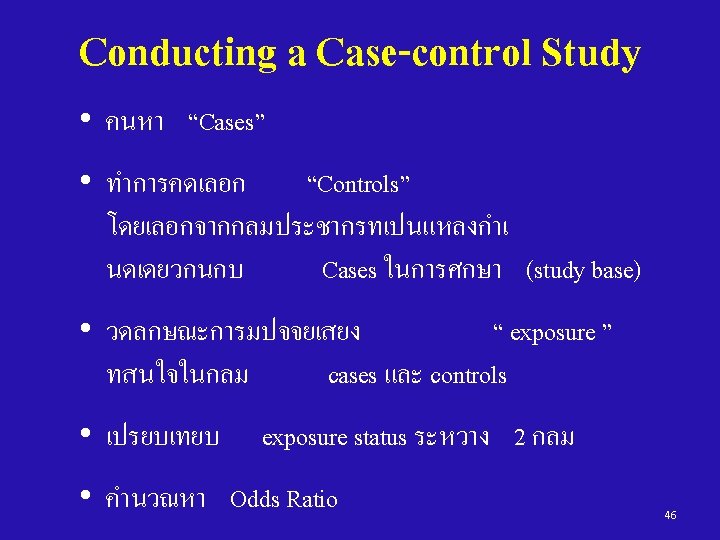
Case-control study Key: it begins with people with the disease (cases) and compares them to people without the disease (controls) 33
Case–control Study Non Cases Factor A 35
Design of a Case–control Study Disease Exposed Not Exposed No Disease Exposed Not Exposed 36
Design of a Case-control Study Cause Exposed Not exposed Exposed Time of Study Begin Direction of inquiry Effect Case (People with disease) Case Population Controls (People without disease) Non-case Population Not exposed • Identify true case, and true non-case populations • Sampling fractions from case<>non-case • Determine exposure status by history 37
Case-Control V. S. Cohort Cause Factors Effect Case – Control Cohort Disease 38
Probability VS Odds Probability (of an event) is chance or proportion that the event would occur among all possible outcomes (= p) Odds of an event with an occurrence probability of p is “the ratio of (p) to (1 -p)” Odds = Probability of event Probability of non-event = p/(1 -p) Probability = odds/(1+odds) Probability Head-to-Head = 9 : 18 Odds If p = 0. 1 Odds = If p = 0. 2 Odds = 0. 1/0. 9 = 0. 11 0. 2/0. 8 = 0. 25 If p = 0. 5 Odds = If p = 0. 8 Odds = 0. 5/0. 5 = 0. 8/0. 2 = 1 4
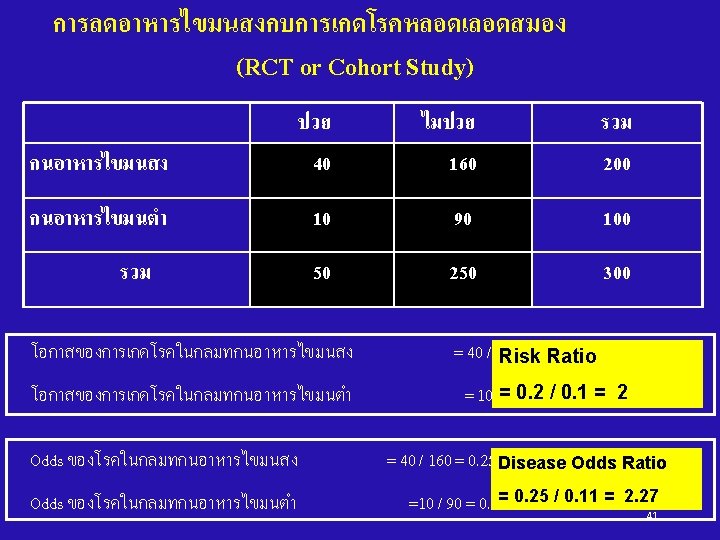
2 x 2 Table and Measure of Association Disease Non disease Total Exposed A B A+B Unexposed C D C+D A+C B+D A+B+C+D Total RCT or Cohort Study Risk Ratio (RR) = Incidence of disease in Exposed group = Incidence of disease in Unexposed group A/(A+B) C/(C+D) Disease Odds Ratio (OR) = Odds of disease in Exposed group = [A/(A+B)] / [B/(A+B)] Odds of disease in Unexposed group [C/(C+D)] / [D/(C+D)] = [A/B] / [C/D] = AD/BC
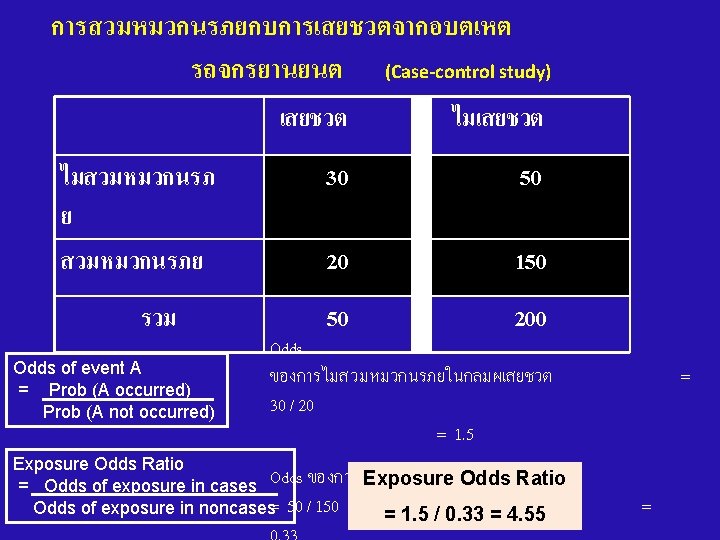
2 x 2 Table and Measure of Association Disease Non disease Total Exposed A B A+B Unexposed C D C+D A+C B+D A+B+C+D Total Case-Control Study Exposure Odds Ratio (OR) = Odds of exposure in Disease group = [A/(A+C)] / [C/(A+C)] Odds of exposure in Non Disease Group [B/(B+D)] / [D/(B+D)] = [A/C] / [B/D] = [A/B] / [C/D] = AD/BC
2 x 2 Table and Measure of Association Disease Non disease Total Exposed A B A+B Unexposed C D C+D A+C B+D A+B+C+D Total RCT or Risk Ratio (RR) = [A/(A+B)] / [C/(C+D)] Cohort Study Disease Odds Ratio (OR) = [A/B] / [C/D] Case-control study If disease is rare, then OR ~ RR Exposure Odds Ratio (OR) = [A/C] / [B/D] = [A/B] / [C/D] If we compare case with total population: Case-cohort study Exposure Odds Ratio (OR) = [A/C] / [(A+B)/(C+D)]. = [A/(A+B)] / [C/(C+D)]
Example: Stroke Survey Ex. 1 Stroke Non. Stroke Case-control study OR ~ RR HT Ex. 2 Stroke HT (if rare outcome) Population (Stroke & Non-stroke) Case-cohort study OR = RR Smoke 45
Sources of Cases • Population-based (ผปวยในชมชน ) • identify and enroll all incident cases from a defined population • e. g. , disease registry, defined geographical area, vital records • Hospital-based (ผปวยทมารกษา ( – identify cases where you can find them • e. g. , hospitals, clinics. – But…… • issue of representativeness? • prevalent vs incident cases? 47
Sources of Controls • Population-based Controls • Ideal design • Represents exposure distribution in the general population, e. g. , – Population registration lists – Health care registration – Tax lists – Voting lists – Telephone RDD survey 48
Sources of Controls • Hospital-based Controls – Hospital-based case control studies used when population-based studies not feasible – More susceptible to bias – Advantages • similar to cases (using the same hospitals means similar SES, location) • more likely to participate (they are sick) • efficient (interview in hospital) – Disadvantages • they may have the disease we want to study? – Don’t select if risk factor for their disease is similar to the disease under study e. g. , COPD and Lung CA • Their exposure characteristic may not represent noncases in the study base “Selection bias” 49
Other Sources of Controls • Relatives, Neighbors, Friends of Cases – One kind of matched case-control study – Advantages • similar to cases (SES/education/occupation) • more willing to co-operate – Disadvantages • Tendency of selection bias: controls and cases may have similar risk factors (e. g. , smoke, alcohol, environmental exposure) • more time consuming (in some circumstances) • cases may not be willing to give information about their relatives or friends 50
Cohort Study Ex: Smoking and Oral Cancer Exposed Unexposed Smoke Not smoke Disease Oral CA Case-control Study No disease No Oral CA Disease Oral CA No disease No Oral CA Cases Control Oral CA No Oral CA Exposed Smoke Unexposed Not Smoke
Oral CA No Oral CA Smoke Not smoke 50 10 950 990 Oral CA No Oral CA Smoke 50 95 Not smoke 10 99 Note: Cohort Study 1, 000 RR = (50/1000)/(10/1000) =5 OR = (50/950)/(10/990) = 5. 2 Case–control Study OR = (50/10)/(95/99) = 5. 2 1. If cases and controls in case-control study well represent those in cohort, Exposure OR = Disease OR 2. For rare disease, OR ≈ RR
Ex: A Food Poisoning in a School (1) (Case-control study) Case Control Ate ice cream 40 17 Not eat 15 38 55 55 Total Odds of eating ice cream in cases = (40/55) / (15/55) = 40/15 = 2. 67 Odds of eating ice cream in control = (17/55) / (38/55) = 17/38 = 0. 45 Odds ratio = 2. 67 / 0. 45 = 5. 9 Odds of exposure among the cases is 5. 9 times of that among the controls 54
Ex: A Food Poisoning in a School (2) (Case-control study) How to interpret OR = 5. 9 better? In conventional case-control study: case-noncase sampling 1. Cases in the study well represent cases in population 2. Control in the study well represent non-case in population >>> Exposure OR = Disease OR “Odds of disease among the exposed is 5. 9 times of that among the unexposed” If 1. +2. + Rare disease >>> OR ~ RR In population-based case-control study: • With case-cohort sampling >>> OR = RR • With density sampling >>> OR = IRR 55
Case-control study: case-noncase sampling 56
Case-control study: case-cohort sampling 57
Case-control study: density sampling 58
Case-control Study - Advantages • Quick and cheap (compared with cohort study) – so ideal for outbreaks • Can study rare diseases • Can evaluate multiple exposures 59
Case-control Study - Disadvantages • Uncertain exposure-disease relationship (esp. timing) • Cannot estimate disease incidence • Inefficient if exposures are rare • Selection bias – Much worry about representativeness of controls (esp. in hospital control or matching design) – selective survival if not using incidence cases • Information bias (recall bias) 60
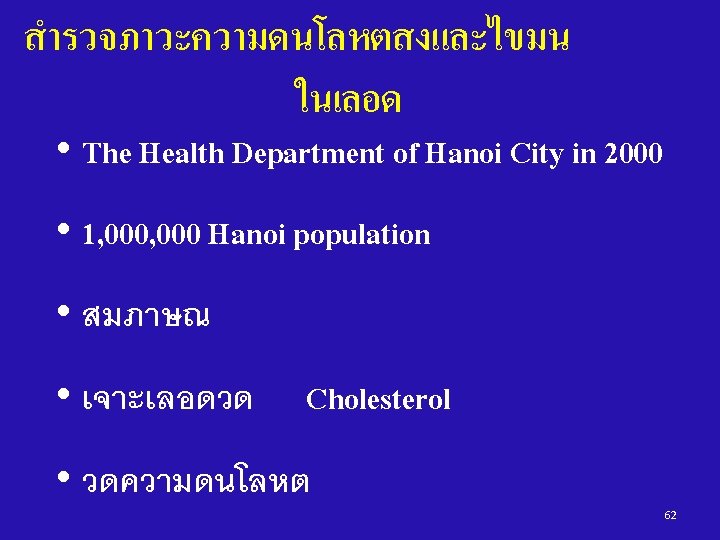
Cross-sectional study In a cross-sectional study, the measurements of exposure and effect are made at the same time 61
สำรวจภาวะความดนโลหตสงและไขมน ในเลอด Defined Population Gather Data on Exposure & Disease at the same time Exposed: Not Exposed: Have disease No disease 65
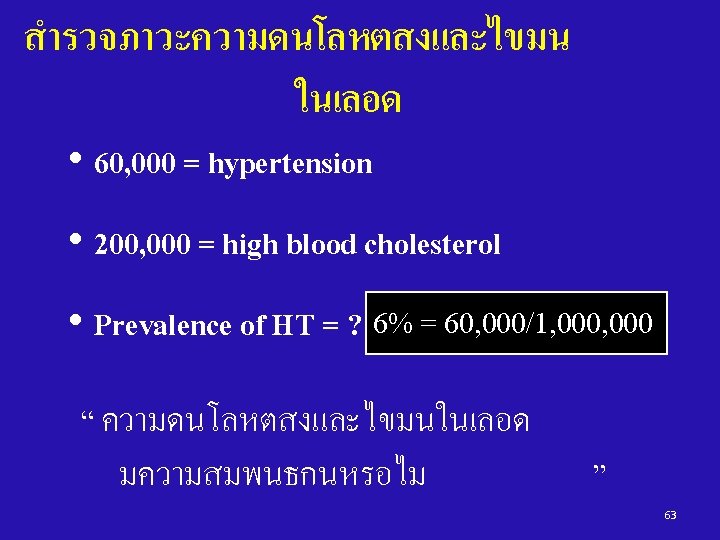
สำรวจภาวะความดนโลหตสงและไขมน ในเลอด HT No HT High Chol. 20, 000 180, 000 200, 000 Normal Chol. 40, 000 760, 000 800, 000 , 60, 000 940, 000 1, 000 67
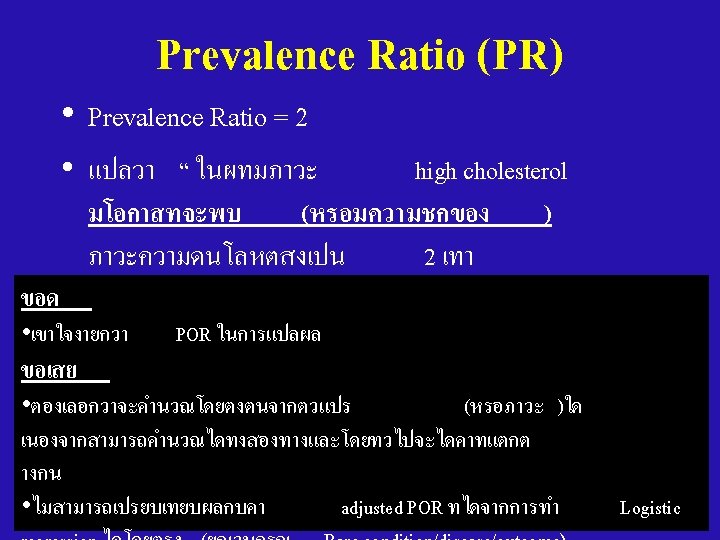
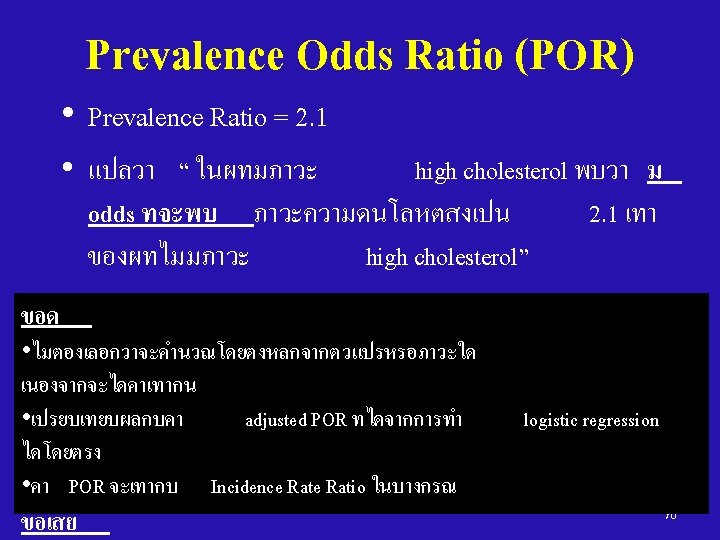
สำรวจภาวะความดนโลหตสงและไขมน ในเลอด • High Cholesterol: HT Prevalence = 20, 000 / 200, 000 = 10% • Normal Cholesterol: Odds of HT = 20, 000 / 180, 000 • Normal Cholesterol: Odds of HT = 40, 000 / 760, 000 HT Prevalence = 40, 000 / 800, 000 = 5% • Prevalence Ratio (PR) • Prevalence Odds Ratio (POR) = (20, 000 / 200, 000) =(20, 000/180, 000) (40, 000 / 800, 000 ) (40, 000/760, 000) =2 = 2. 1 68
Cross-sectional Studies • Advantages: – Quick – Inexpensive – Can study multiple health predictors, outcomes or diseases at the same time – Useful for health administration and hypothesis formulation 71
Cross-sectional Studies • Disadvantages: – Prevalence is product of incidence & disease duration e. g. low prevalence may be due to • low incidence (rare disease) • short duration – Selection Bias (“Prevalence-Incidence Bias” or “Selective survival”) – Uncertain temporal relationships – Information Bias (Recall bias) 72
Incidence VS Prevalence Cases Case Cross-sectional survey Jan Mar May Case with short disease duration Incidence Cases: Prevalence Cases: Jul Sep Nov Case with long disease duration Short : Long = 1 : 1 Short : Long = 1 : 2 Time
Thank you Acknowledgements Many slides are from: Dr. Ram Rungsin Dr. Chuleeporn Jiraphongsa Dr. Darin Areechokchai Dr. Mathew J. Reeves 74