
EVOLUTION OF HEALTH EXPECTANCY IN BELGIUM Prof Dr
EVOLUTION OF HEALTH EXPECTANCY IN BELGIUM Prof. Dr. Herman Van Oyen Epidemiology and public health FPS Social Security, 9 th December 2019
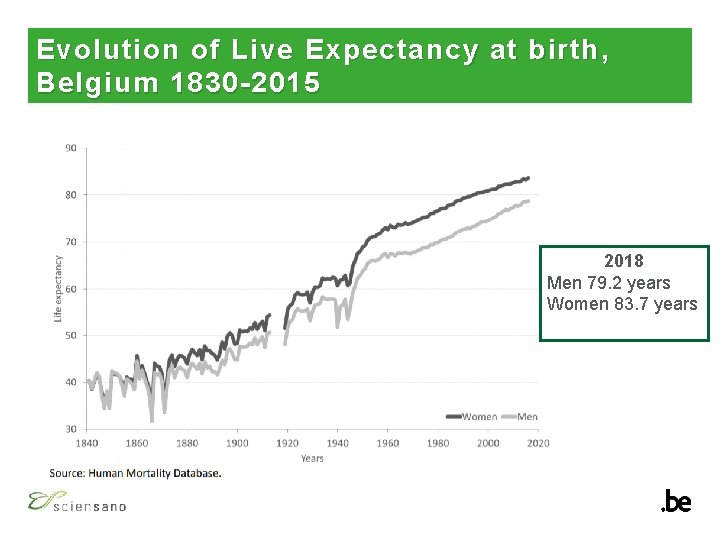
Evolution of Live Expectancy at birth, Belgium 1830 -2015 2018 Men 79. 2 years Women 83. 7 years
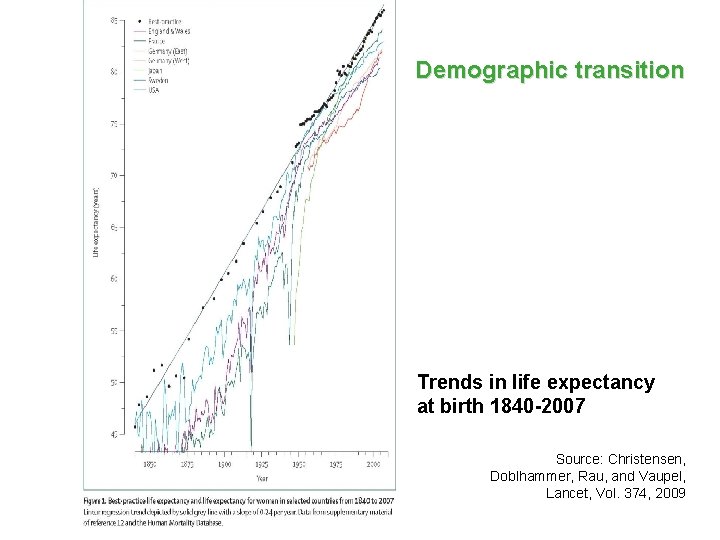
Demographic transition Trends in life expectancy at birth 1840 -2007 Source: Christensen, Doblhammer, Rau, and Vaupel, Lancet, Vol. 374, 2009
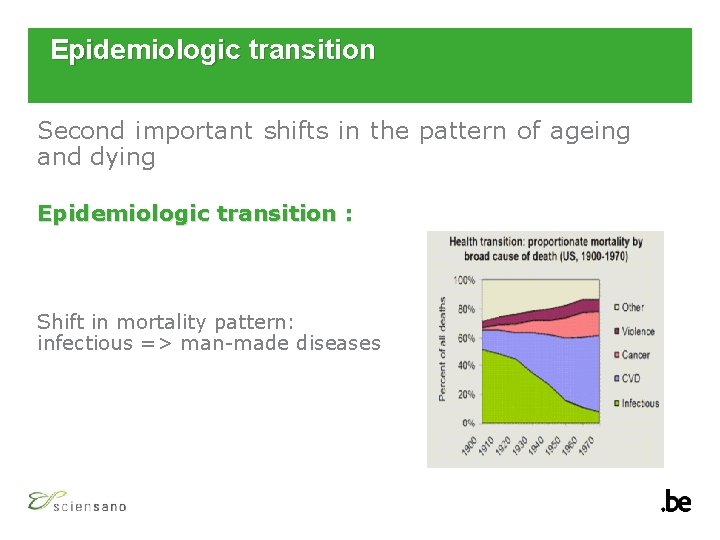
Epidemiologic transition Second important shifts in the pattern of ageing and dying Epidemiologic transition : Shift in mortality pattern: infectious => man-made diseases
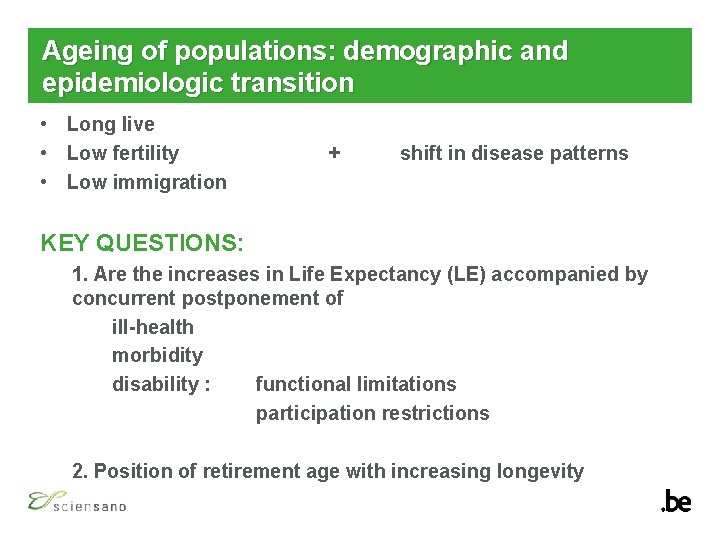
Ageing of populations: demographic and epidemiologic transition • Long live • Low fertility • Low immigration + shift in disease patterns KEY QUESTIONS: 1. Are the increases in Life Expectancy (LE) accompanied by concurrent postponement of ill-health morbidity disability : functional limitations participation restrictions 2. Position of retirement age with increasing longevity
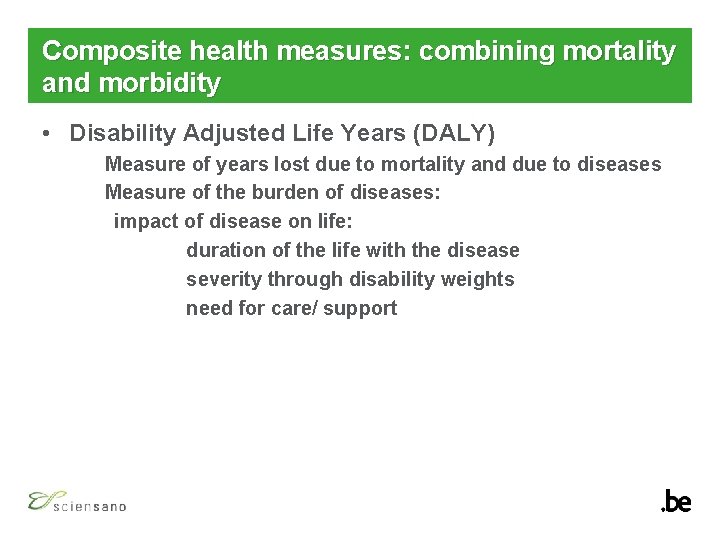
Composite health measures: combining mortality and morbidity • Disability Adjusted Life Years (DALY) Measure of years lost due to mortality and due to diseases Measure of the burden of diseases: impact of disease on life: duration of the life with the disease severity through disability weights need for care/ support
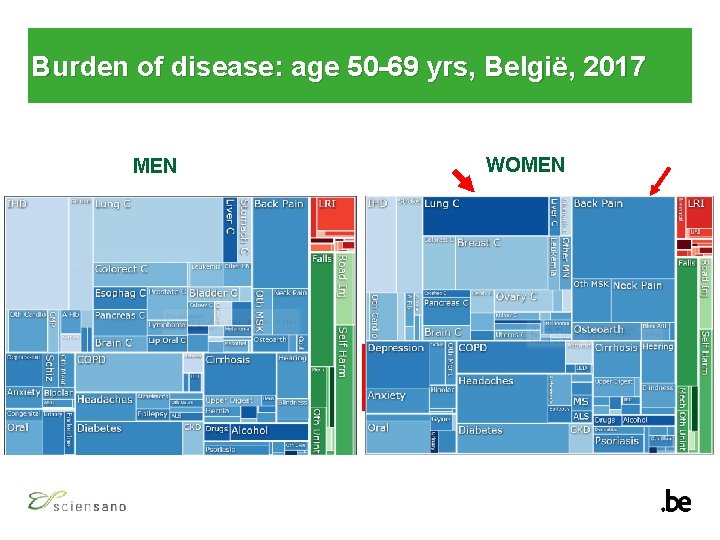
Burden of disease: age 50 -69 yrs, België, 2017 MEN WOMEN
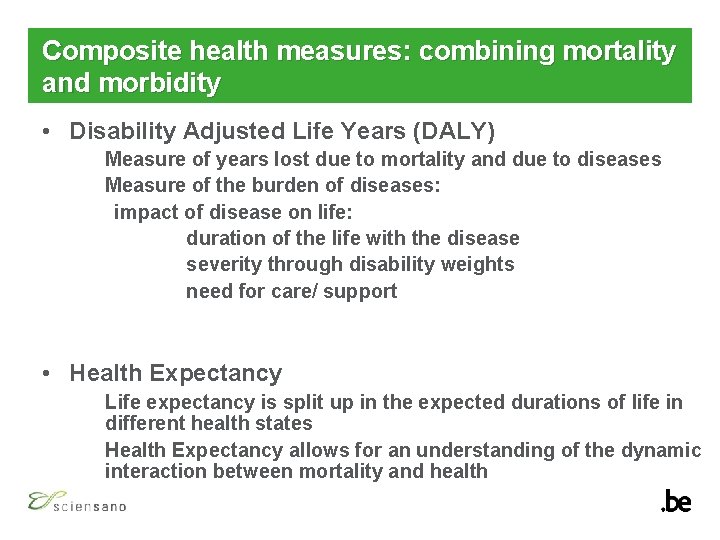
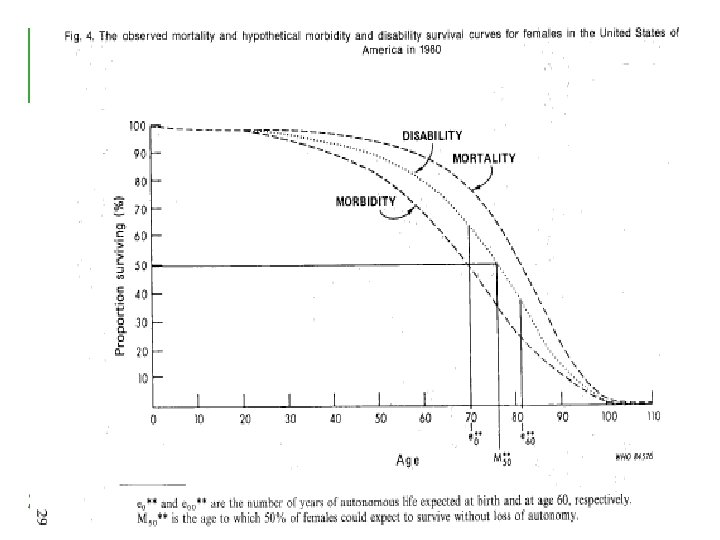
Composite health measures: combining mortality and morbidity • Disability Adjusted Life Years (DALY) Measure of years lost due to mortality and due to diseases Measure of the burden of diseases: impact of disease on life: duration of the life with the disease severity through disability weights need for care/ support • Health Expectancy Life expectancy is split up in the expected durations of life in different health states Health Expectancy allows for an understanding of the dynamic interaction between mortality and health

Health Expectancy (HE) The number of remaining years that a person can expect to spend in a health state at a particular age, assuming current rates of mortality and morbidity. Life Expectancy Years in good health Years in ill health
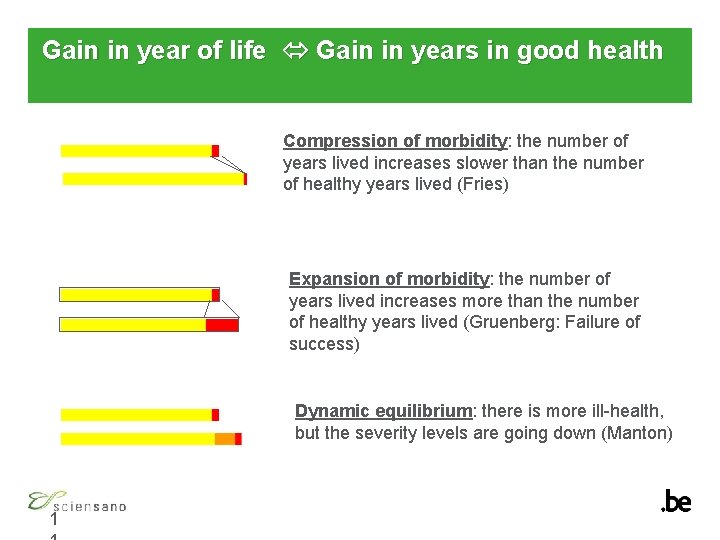
Gain in year of life Gain in years in good health Compression of morbidity: the number of years lived increases slower than the number of healthy years lived (Fries) Expansion of morbidity: the number of years lived increases more than the number of healthy years lived (Gruenberg: Failure of success) Dynamic equilibrium: there is more ill-health, but the severity levels are going down (Manton) 1
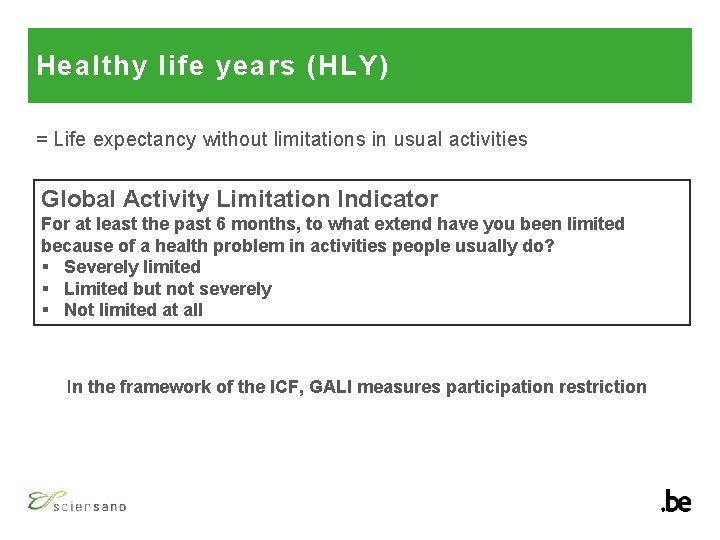
Healthy life years (HLY) = Life expectancy without limitations in usual activities Global Activity Limitation Indicator For at least the past 6 months, to what extend have you been limited because of a health problem in activities people usually do? § Severely limited § Limited but not severely § Not limited at all In the framework of the ICF, GALI measures participation restriction
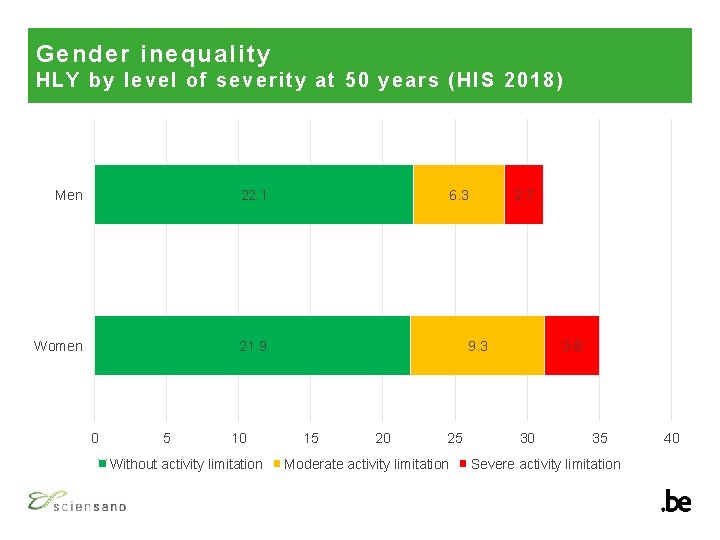
Gender inequality HLY by level of sever ity at 50 year s (HIS 2018) Men 22. 1 Women 21. 9 0 5 10 Without activity limitation 6. 3 2. 7 9. 3 15 20 25 Moderate activity limitation 3. 8 30 35 Severe activity limitation 40
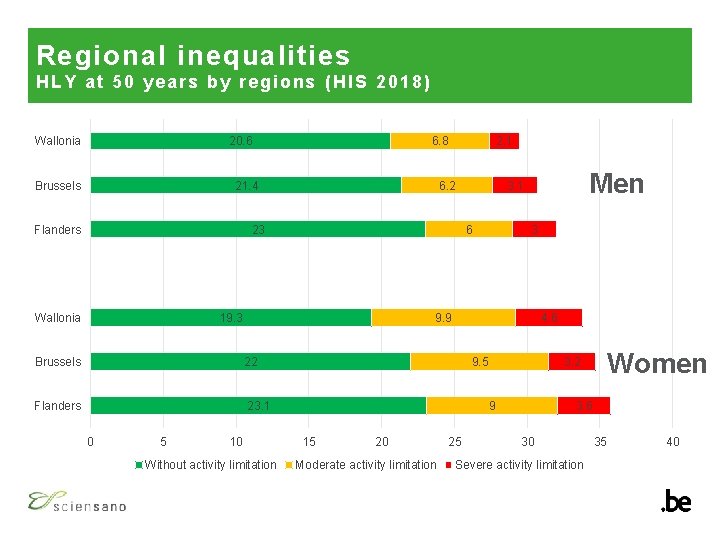
Regional inequalities HLY at 50 years by regions (HIS 2018) 20. 6 Wallonia 6. 8 21. 4 Brussels Flanders 2. 1 6. 2 23 Wallonia 6 19. 3 22 Flanders 23. 1 5 3 9. 9 Brussels 0 Men 3. 1 10 Without activity limitation 4. 6 9. 5 9 15 20 Moderate activity limitation 25 Women 3. 2 3. 6 30 Severe activity limitation 35 40
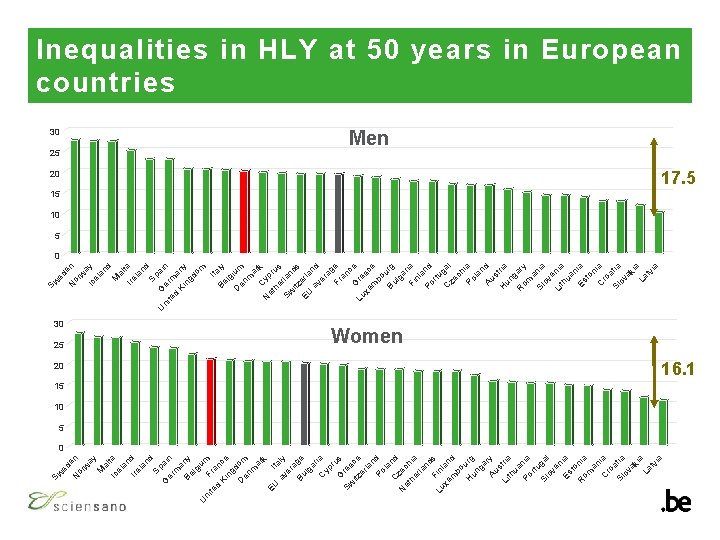
el ta al M an Ire d la nd Sp G ain er m a Be ny lg iu U m ni te Fra d n Ki ce ng d D om en m ar k EU I ta av ly er a Bu ge lg ar C ia yp ru G s Sw ree itz ce er la n Po d la C nd N zec et he hia rla nd s Lu Finl xe an m d bo H urg un ga Au ry s Li tria th ua Po nia rtu Sl gal ov en Es ia to R nia om an C ia ro a Sl tia ov ak ia La tv ia Ic ay w en ed or N Sw ay M an d el w al t Ire a la nd Sp a U ni Ger in te d ma Ki ny ng do m Ita Be ly lg D ium en m a C rk yp N et he rus Sw rlan itz ds EU erla av nd er ag Fr e an ce G Lu re xe ec m e bo u Bu rg lg ar Fi ia nl a Po nd rtu C gal ze ch Po ia la n Au d st H ria un g R ary om a Sl nia ov e Li nia th ua n Es ia to n C ia ro a Sl tia ov ak ia La tv ia Ic en ed or N Sw Inequalities in HLY at 50 years in European countries 30 25 Men 20 17. 5 15 10 5 0 30 25 Women 20 16. 1 15 10 5 0
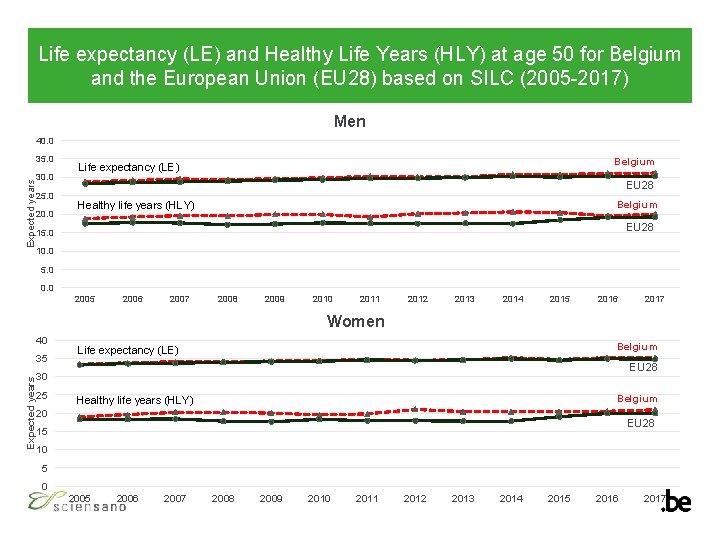
Life expectancy (LE) and Healthy Life Years (HLY) at age 50 for Belgium and the European Union (EU 28) based on SILC (2005 -2017) Men 40. 0 Expected years 35. 0 30. 0 25. 0 20. 0 Belgium Life expectancy (LE) EU 28 Belgium Healthy life years (HLY) EU 28 15. 0 10. 0 5. 0 0. 0 2005 2006 2007 2008 2009 2010 2011 2012 2013 2014 2015 2016 2017 Women 40 Expected years 35 Belgium Life expectancy (LE) EU 28 30 25 Belgium Healthy life years (HLY) 20 EU 28 15 10 5 0 2005 2006 2007 2008 2009 2010 2011 2012 2013 2014 2015 2016 2017
SOCIO-ECONOMIC STATUS AND HEALTH EXPECTANCY
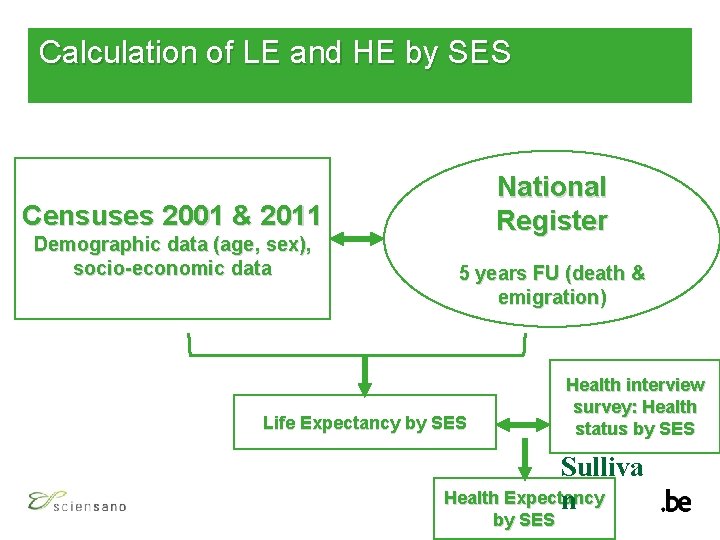
Calculation of LE and HE by SES National Register Censuses 2001 & 2011 Demographic data (age, sex), socio-economic data 5 years FU (death & emigration) Health interview survey: Health status by SES Life Expectancy by SES Sulliva Health Expectancy n by SES
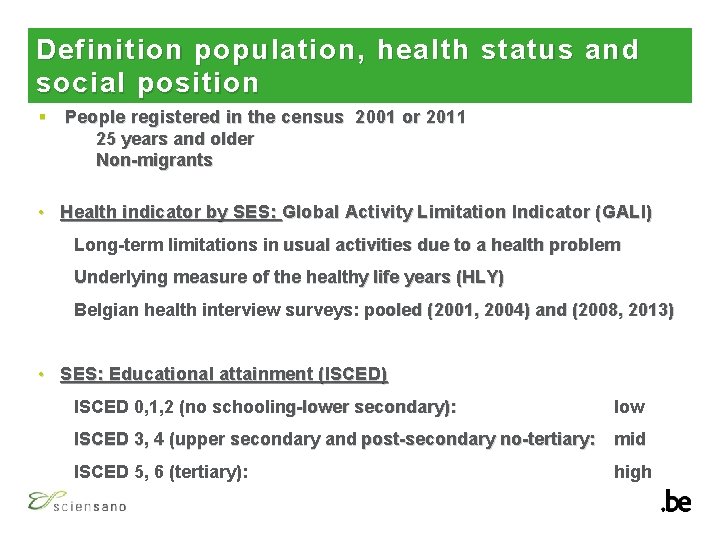
Definition population, health status and social position § People registered in the census 2001 or 2011 25 years and older Non-migrants • Health indicator by SES: Global Activity Limitation Indicator (GALI) Long-term limitations in usual activities due to a health problem Underlying measure of the healthy life years (HLY) Belgian health interview surveys: pooled (2001, 2004) and (2008, 2013) • SES: Educational attainment (ISCED) ISCED 0, 1, 2 (no schooling-lower secondary): low ISCED 3, 4 (upper secondary and post-secondary no-tertiary: mid ISCED 5, 6 (tertiary): high
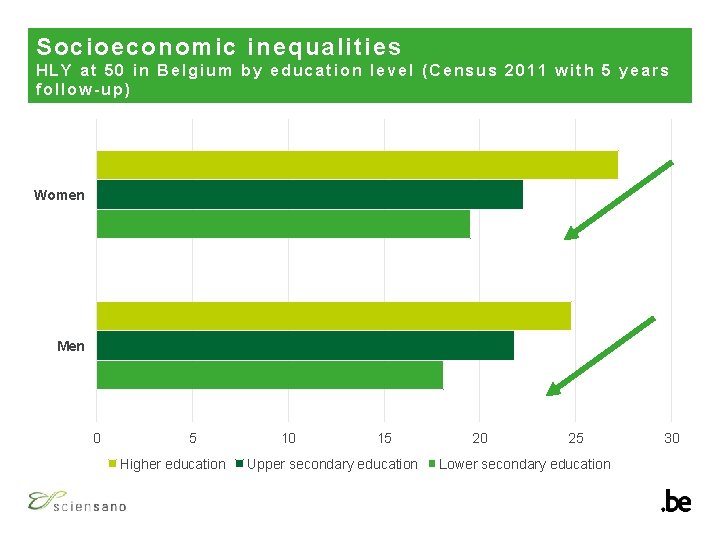
Socioeconomic inequalities HLY at 50 in Belgium by education level (Census 2011 with 5 years follow-up) Women Men 0 5 Higher education 10 15 Upper secondary education 20 25 Lower secondary education 30
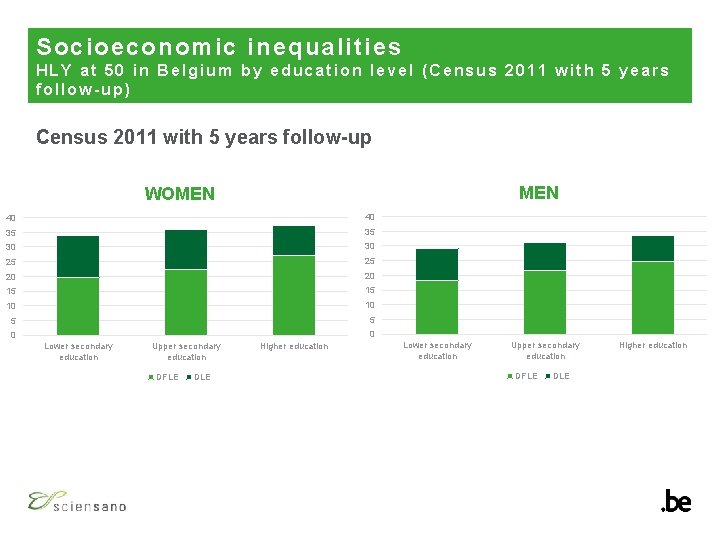
Socioeconomic inequalities HLY at 50 in Belgium by education level (Census 2011 with 5 years follow-up) Census 2011 with 5 years follow-up MEN WOMEN 40 40 35 35 30 30 25 25 20 20 15 15 10 10 5 5 0 0 Lower secondary education Upper secondary education DFLE DLE Higher education
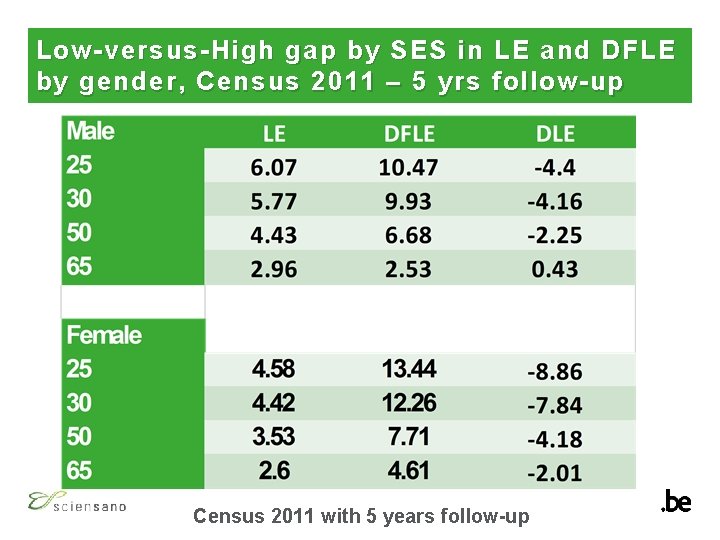
Low-versus-High gap by SES in LE and DFLE by gender, Census 2011 – 5 yrs follow-up Census 2011 with 5 years follow-up
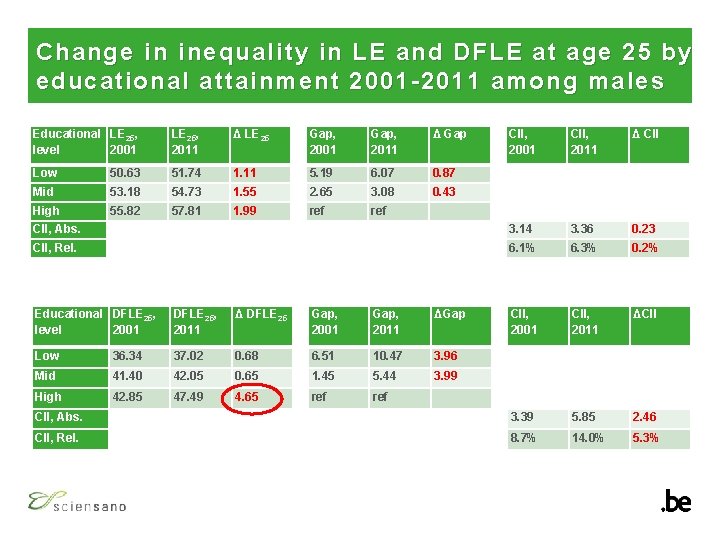
Change in inequality in LE and DFLE at age 25 by educational attainment 2001 -2011 among males Educational LE 25, level 2001 LE 25, 2011 Δ LE 25 Gap, 2001 Gap, 2011 Δ Gap CII, 2001 CII, 2011 Δ CII Low 50. 63 51. 74 1. 11 5. 19 6. 07 0. 87 Mid 53. 18 54. 73 1. 55 2. 65 3. 08 0. 43 High 55. 82 57. 81 1. 99 ref CII, Abs. 3. 14 3. 36 0. 23 CII, Rel. 6. 1% 6. 3% 0. 2% Educational DFLE 25, level 2001 DFLE 25, 2011 Δ DFLE 25 Gap, 2001 Gap, 2011 ΔGap CII, 2001 CII, 2011 ΔCII Low 36. 34 37. 02 0. 68 6. 51 10. 47 3. 96 Mid 41. 40 42. 05 0. 65 1. 45 5. 44 3. 99 High 42. 85 47. 49 4. 65 ref CII, Abs. 3. 39 5. 85 2. 46 CII, Rel. 8. 7% 14. 0% 5. 3%
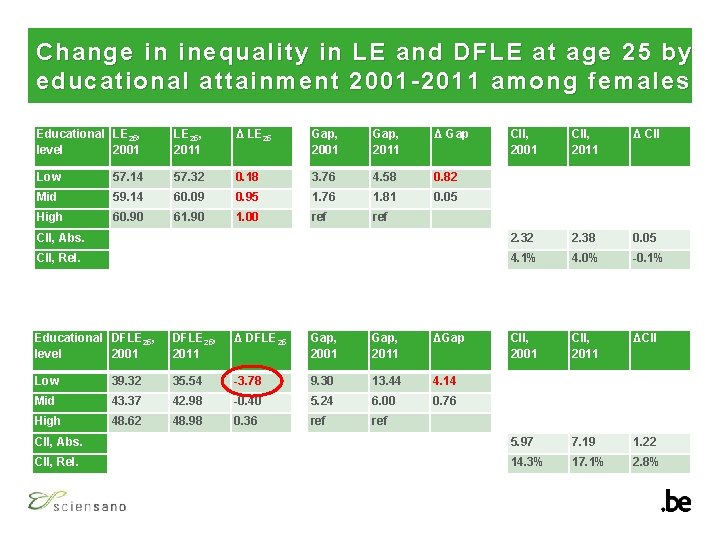
Change in inequality in LE and DFLE at age 25 by educational attainment 2001 -2011 among female s Educational LE 25, level 2001 LE 25, 2011 Δ LE 25 Gap, 2001 Gap, 2011 Δ Gap CII, 2001 CII, 2011 Δ CII Low 57. 14 57. 32 0. 18 3. 76 4. 58 0. 82 Mid 59. 14 60. 09 0. 95 1. 76 1. 81 0. 05 High 60. 90 61. 90 1. 00 ref CII, Abs. 2. 32 2. 38 0. 05 CII, Rel. 4. 1% 4. 0% -0. 1% Educational DFLE 25, level 2001 DFLE 25, 2011 Δ DFLE 25 Gap, 2001 Gap, 2011 ΔGap CII, 2001 CII, 2011 ΔCII Low 39. 32 35. 54 -3. 78 9. 30 13. 44 4. 14 Mid 43. 37 42. 98 -0. 40 5. 24 6. 00 0. 76 High 48. 62 48. 98 0. 36 ref CII, Abs. 5. 97 7. 19 1. 22 CII, Rel. 14. 3% 17. 1% 2. 8%
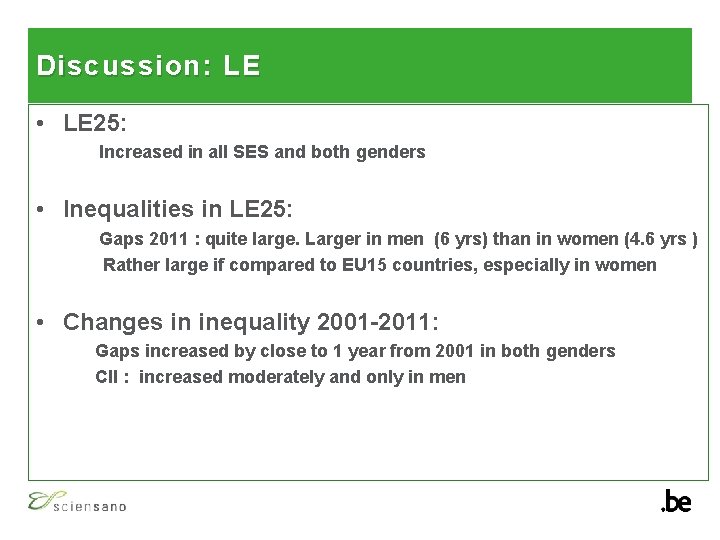
Discussion: LE • LE 25: Increased in all SES and both genders • Inequalities in LE 25: Gaps 2011 : quite large. Larger in men (6 yrs) than in women (4. 6 yrs ) Rather large if compared to EU 15 countries, especially in women • Changes in inequality 2001 -2011: Gaps increased by close to 1 year from 2001 in both genders CII : increased moderately and only in men
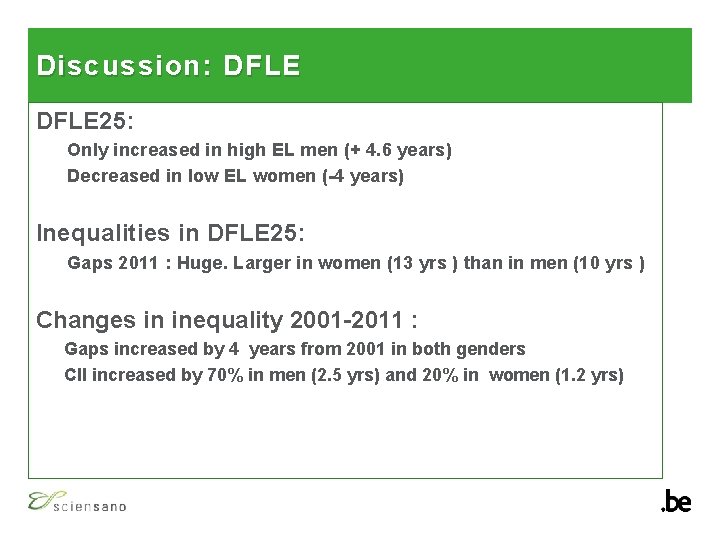
Discussion: DFLE 25: Only increased in high EL men (+ 4. 6 years) Decreased in low EL women (-4 years) Inequalities in DFLE 25: Gaps 2011 : Huge. Larger in women (13 yrs ) than in men (10 yrs ) Changes in inequality 2001 -2011 : Gaps increased by 4 years from 2001 in both genders CII increased by 70% in men (2. 5 yrs) and 20% in women (1. 2 yrs)
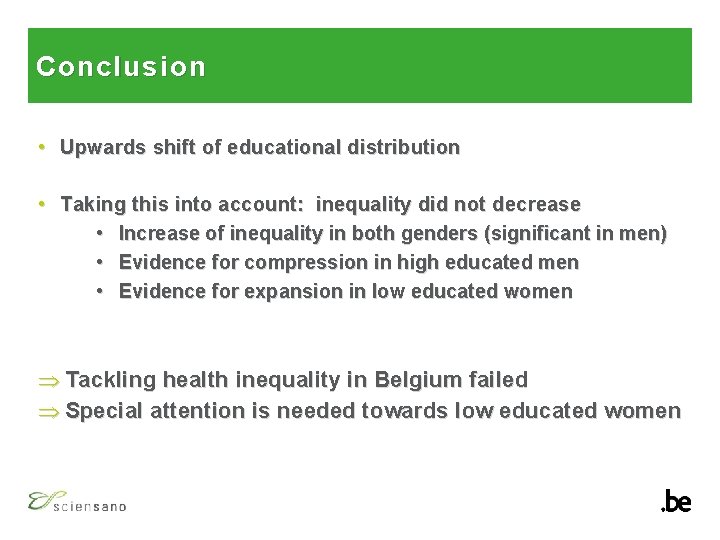
Conclusion • Upwards shift of educational distribution • Taking this into account: inequality did not decrease • Increase of inequality in both genders (significant in men) • Evidence for compression in high educated men • Evidence for expansion in low educated women Þ Tackling health inequality in Belgium failed Þ Special attention is needed towards low educated women
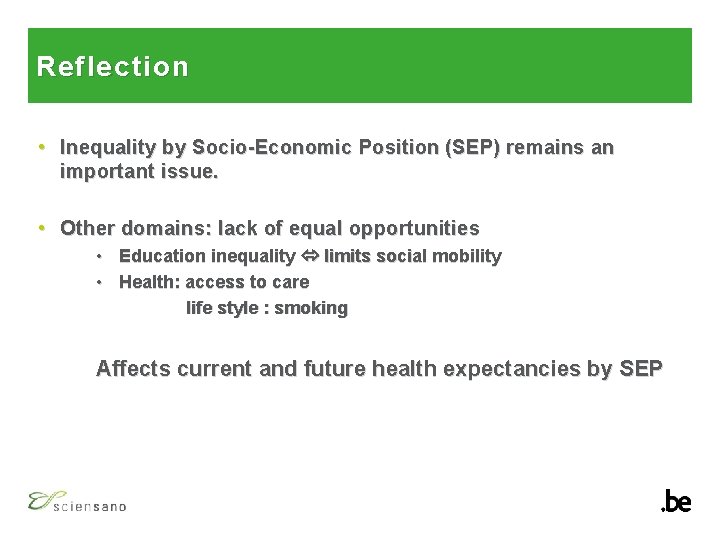
Reflection • Inequality by Socio-Economic Position (SEP) remains an important issue. • Other domains: lack of equal opportunities • Education inequality limits social mobility • Health: access to care life style : smoking Affects current and future health expectancies by SEP
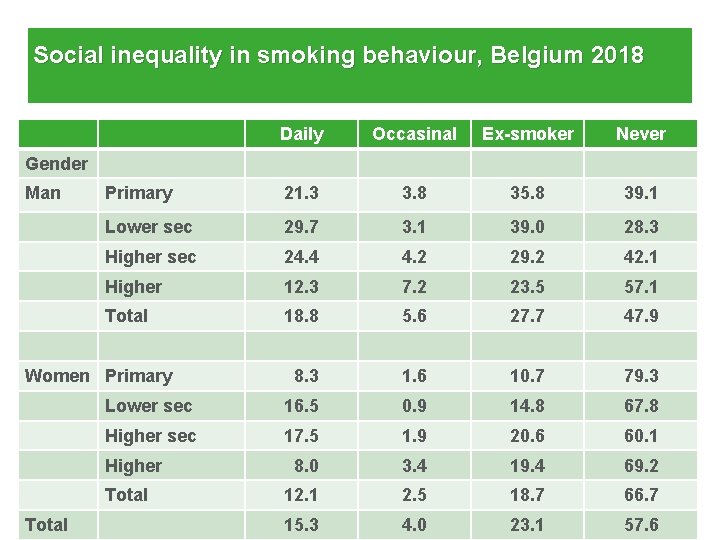
Social inequality in smoking behaviour, Belgium 2018 Daily Occasinal Ex-smoker Never Primary 21. 3 3. 8 35. 8 39. 1 Lower sec 29. 7 3. 1 39. 0 28. 3 Higher sec 24. 4 4. 2 29. 2 42. 1 Higher 12. 3 7. 2 23. 5 57. 1 Total 18. 8 5. 6 27. 7 47. 9 8. 3 1. 6 10. 7 79. 3 Lower sec 16. 5 0. 9 14. 8 67. 8 Higher sec 17. 5 1. 9 20. 6 60. 1 Higher 8. 0 3. 4 19. 4 69. 2 Total 12. 1 2. 5 18. 7 66. 7 15. 3 4. 0 23. 1 57. 6 Gender Man Women Primary Total
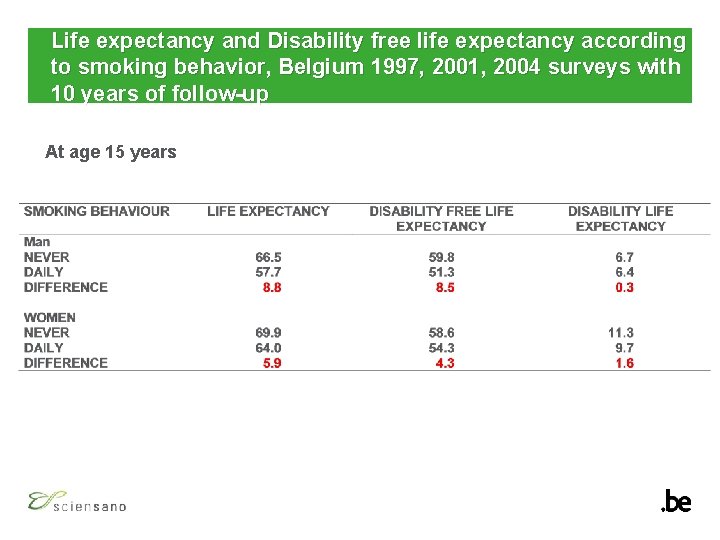
Life expectancy and Disability free life expectancy according to smoking behavior, Belgium 1997, 2001, 2004 surveys with 10 years of follow-up At age 15 years
Contact Herman Van Oyen • herman. vanoyen@sciensano. be • +32 2 642 50 29 Sciensano • Rue Juliette Wytsmanstraat 14 • 1050 Brussels • Belgium T +32 2 642 51 11 • T Press +32 2 642 54 20 • info@sciensano. be • www. sciensano. be
- Slides: 32