Measures in Epidemiology Panithee Thammawijaya Bureau of Epidemiology

Measures in Epidemiology Panithee Thammawijaya Bureau of Epidemiology, DDC, MOPH

Basic Ideas
���� ) Counts cases or health events, and describes")
How epidemiologists work? 1. Counting: )���� ) Counts cases or health events, and describes them in terms of time, place, and person Descriptive Epidemiology 2. Dividing: )��� ) Divides the number of cases by an appropriate denominator to calculate “rates” 3. Comparing: )������ ( Compares these “rates” over time or for different groups of people Analytic Epidemiology 3 *����� rate ������������

Count • Number of cases “we have 4 cases of DM” Simple but not informative How big of the population in which they are members? How serious of the situation if compare with other populations? Need to find appropriate denominator!! 4
 Population at risk")
Appropriate Denominator for Cervical Carcinoma? Total population All women (age groups) Population at risk 0 -25 years Men Women 25 -69 years 70+ years All of them still have cervix? Source: Basic Epidemiology, 2 nd Ed. , R Bonita, 2006 5
 Disease (��� ) Smoking Heart disease Alcohol Death")
Exposure and Disease Exposure (������ ) Disease (��� ) Smoking Heart disease Alcohol Death by motorcycle accident
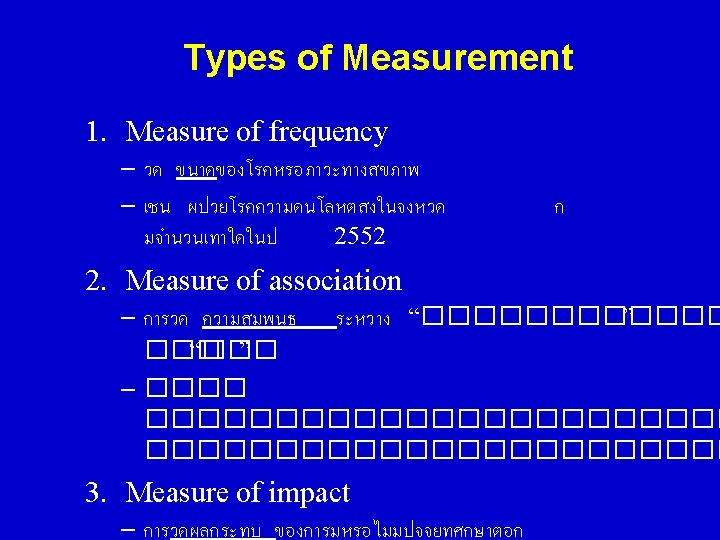

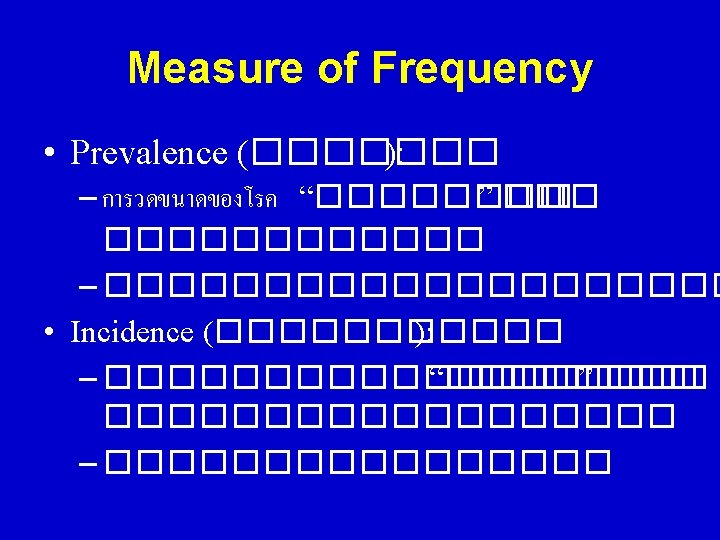
1. Measure of Frequency
 D = average disease duration New cases Prevalence (P) New")
Prevalence and Incidence (I) D = average disease duration New cases Prevalence (P) New + old cases Resolution • Cures • Deaths

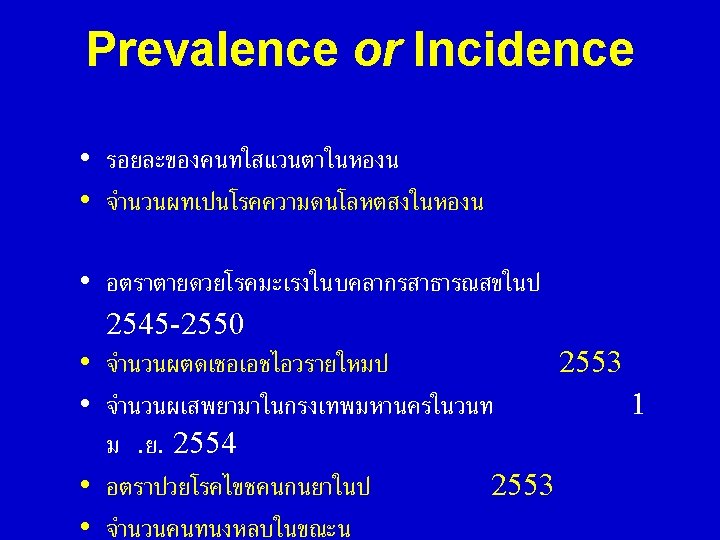
Measure of Frequency ? Measure of Exposure frequency Smoking in Community A in 2009 1. Prevalence of smoking • Male 30% • Female 10% 2. Incidence of new smokers • 5/1, 000 population ? Measure of disease frequency Heart disease in Community A in 2009 1. Prevalence of heart disease • 1% 2. Incidence of heart disease • 3/1, 000 population
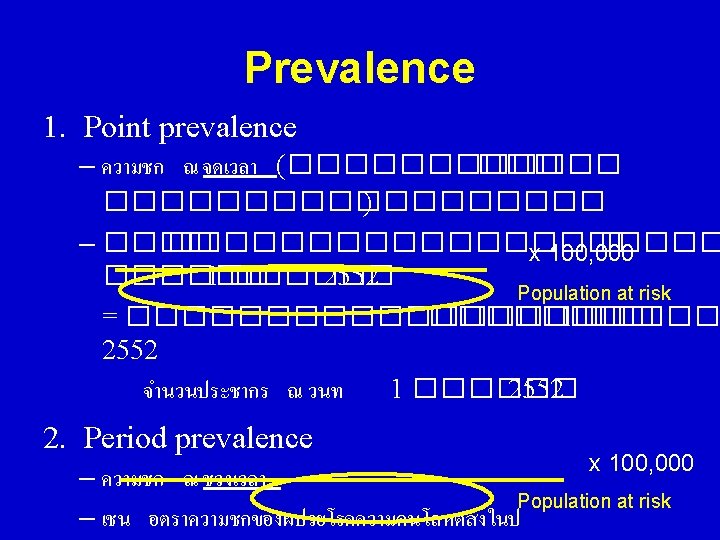

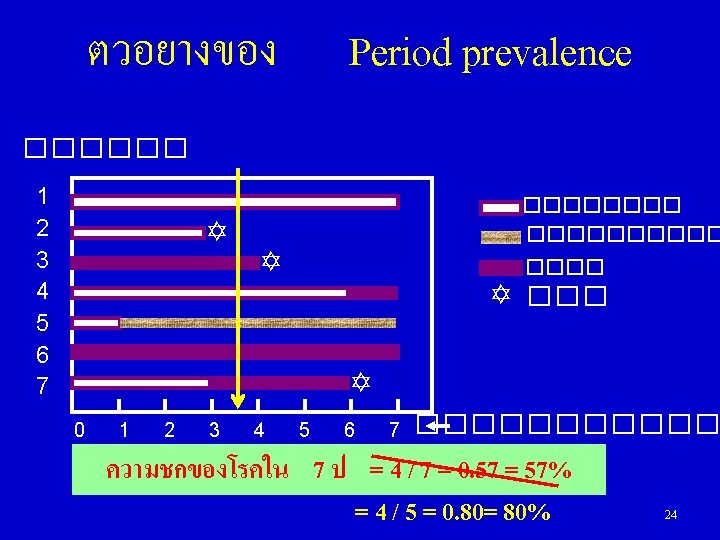
Interpretation of Prevalence • Because prevalence depends on both incidence and disease duration, it is not as useful as incidence for studying causes of a disease. • It is useful for measuring disease burden on a population, especially if those who have the disease require specific medical attention. 15

Incidence 1. Incidence proportion ชออนๆ ไดแก • Incidence risk • Cumulative incidence • Attack rate (������� ) 2. Incidence rate ชออนๆ • • • ไดแก Incidence density Force of morbidity/Force of mortality Hazard rate Person-time rate Disease intensity
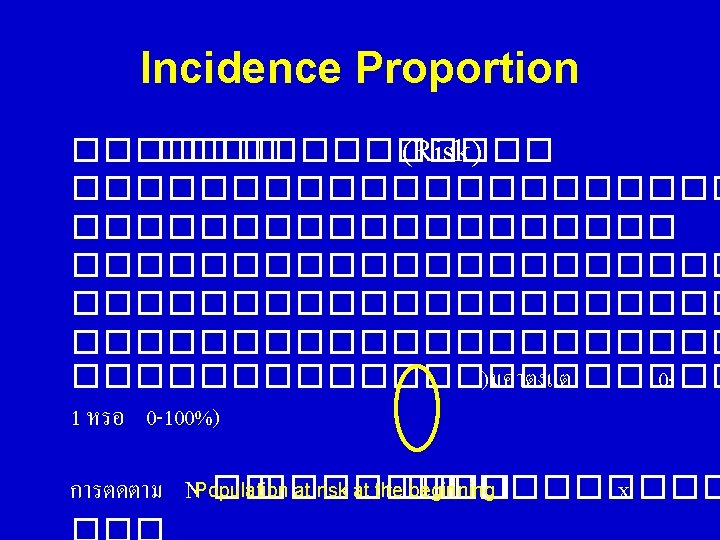

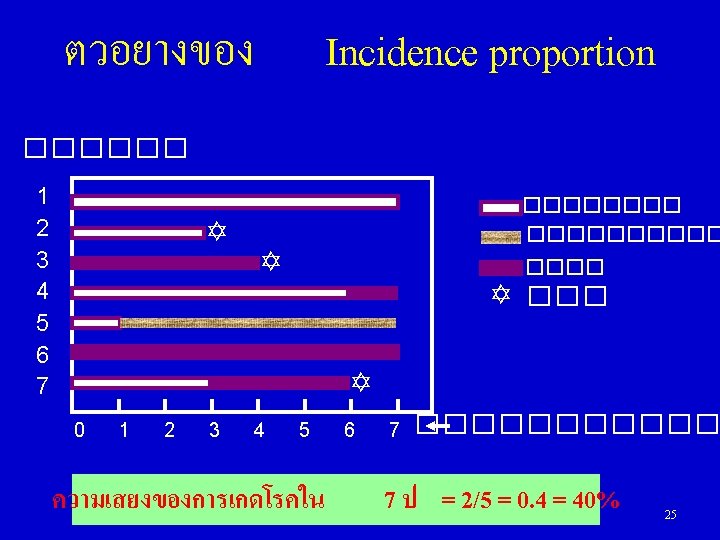
Interpretation of Incidence Proportion • Three assumptions required when calculating incidence proportion: – No migration, no deaths from other causes – At the beginning, all participants are at risk of the outcome of interest – Entire population at risk has been followed from the beginning of the study till the end • The only way to interpret incidence proportion, or “risk”, is to know the length of the time period over which the risk applies 18
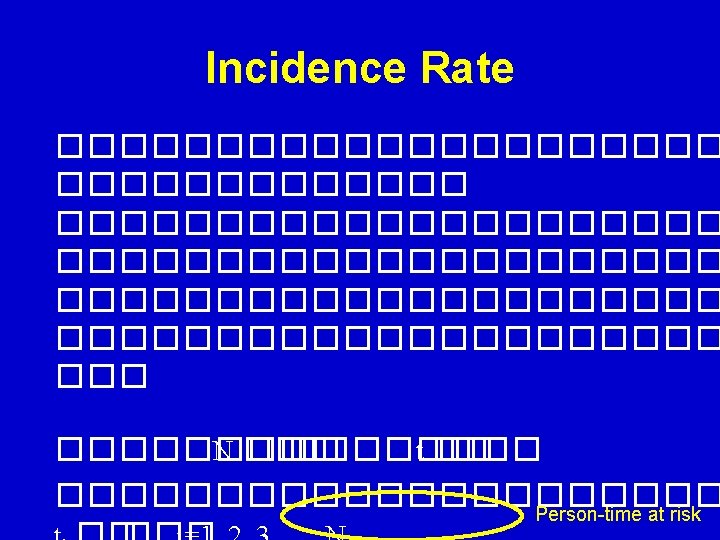

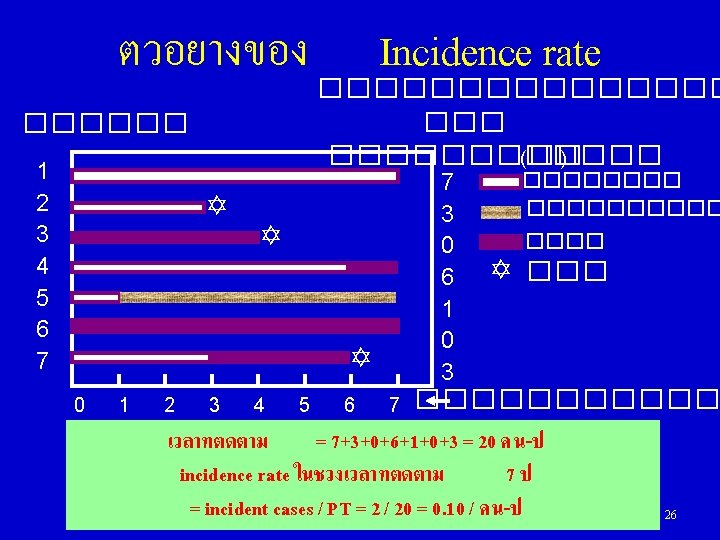
Interpretation of Incidence Rate • Describe how quickly disease occurs in a population • The occurrence of new cases from time zero to time t, per unit of time, relative to the size of the population at risk during that interval • Denominator for incidence rate is total person -time for the study period (the sum of persontime contributed to by each individual) 20

incidence proportion VS. Incidence Rate Property Incidence proportion Incidence Rate Smallest value 0 0 Greatest value 1 Infinity None Event per unit of time Probability Inverse of incidence time Units Interpretation 21

 Incidence/Prevalence – Incidence/prevalence among total population at")
Crude vs Specific Measures • Crude (overall) Incidence/Prevalence – Incidence/prevalence among total population at risk = # of cases/deaths among total pop. at risk # of total pop. at risk – Eg. National cancer incidence in 2009 • Specific Incidence/Prevalence – Incidence/prevalence among subpopulation = # of case/deaths among subpop. at risk/ # of that subpop. at risk – Eg. • Age-specific cancer incidence • Gender-specific DM prevalence • Food-specific attack rate Differences among specific incidence/prevalence are important for generating hypotheses! 27

Incidence VS Prevalence Incidence Prevalence Numerator Number of new cases of disease during a specified period of time Number of existing cases of disease at a given point of time Denominator Population at risk Focus Whether the event is a new case Time of onset of the disease Presence or absence of a disease Time period is arbitrary; rather a “snapshot” in time Uses • Expresses the risk or speed of becoming ill • The main measure of acute diseases or conditions, but also used for chronic diseases • More useful for studies of causation • Estimates the probability of the population being ill at the period of time being studied • Useful in the study of the burden of chronic diseases and implication for health services
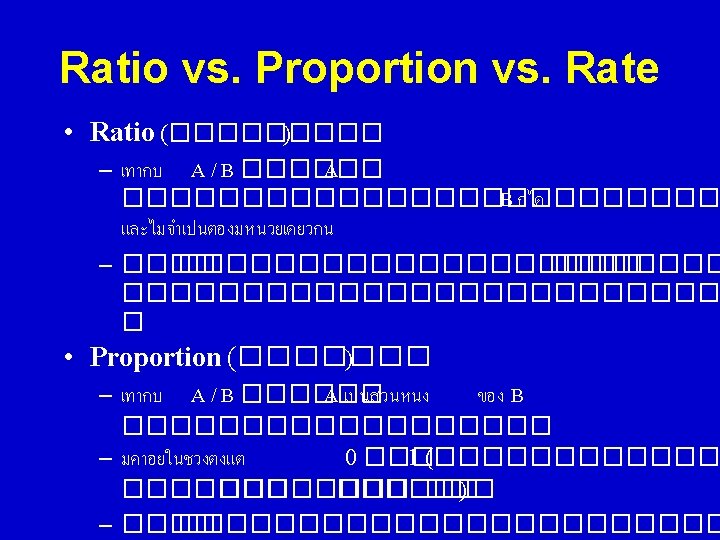
uses of “Rate” • อตราอบตการณ = Incidence rate อตราปวย (ระหวางการระบาด ) = Attack")
Common (Mis)uses of “Rate” • อตราอบตการณ = Incidence rate อตราปวย (ระหวางการระบาด ) = Attack rate = # of new cases / # of pop at risk at the beginning • อตราความชก = Prevalence rate = # of existing cases at a point of time / # of pop at risk at that point of time • อตราตาย = Mortality/Death rate = # of deaths / # of pop at the beginning • อตราปวยตาย = Case-fatality rate = # of deaths from a disease / # of cases of that diseases at the beginning

2. Measure of Association

Measures of Association ? Types of measure depend on types of variables and study designs 1. 2. 3. 4. 5. Risk ratio (RR) Incidence Rate ratio (IRR) Odds ratio (OR) Prevalence ratio (PR) Correlation coefficient (r) for continuous outcome and exposure variable
 • Risk ratio (RR) – A ratio of two incidence proportions")
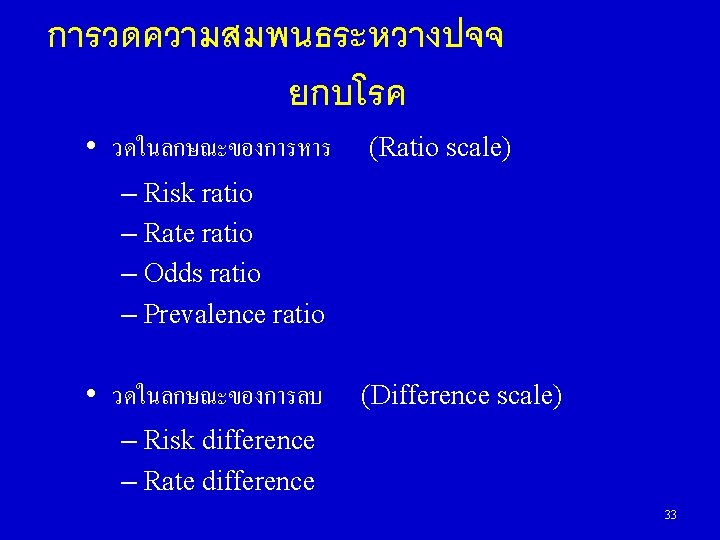
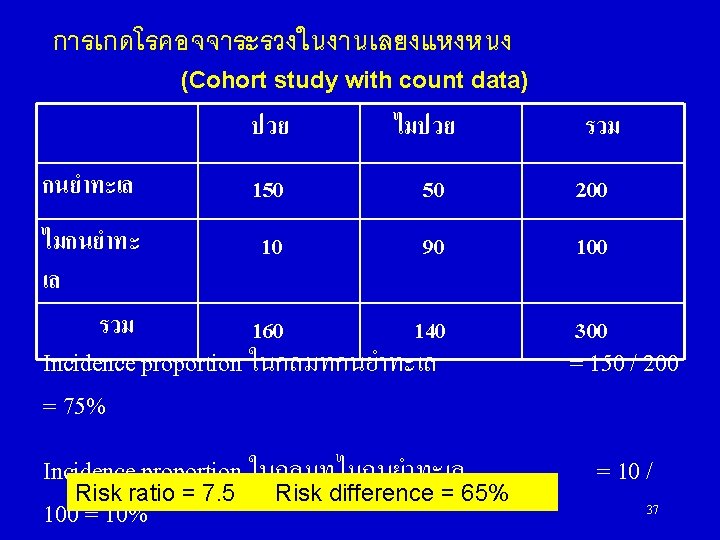
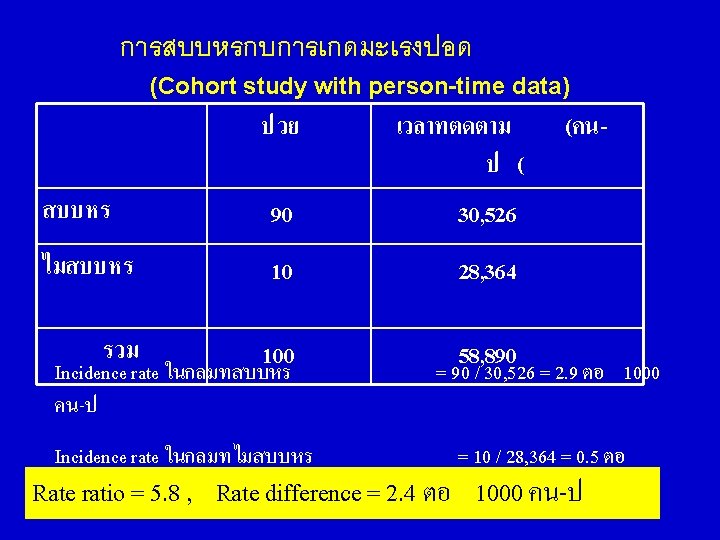
Ratio Scale (1) • Risk ratio (RR) – A ratio of two incidence proportions – E. g. incidence proportion of mumps in nonvaccinees/ incidence proportion of mumps in vaccinees – Used in Cohort study (with count data) • Rate ratio/ Incidence Ratio (IRR) – A ratio of two incidence rates – E. g. incidence rate of CA lung in smoker/ incidence rate of CA lung in nonsmoker – Used in Cohort study (with person-time data)
 • Odds ratio (OR) – A ratio of two odds –")
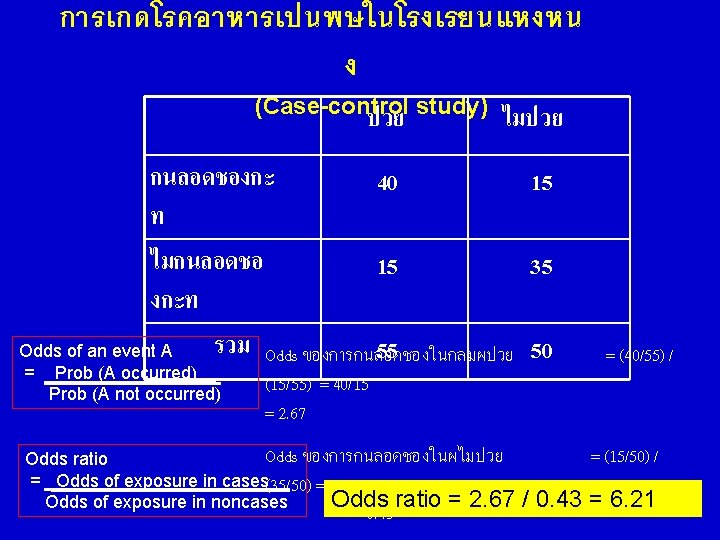
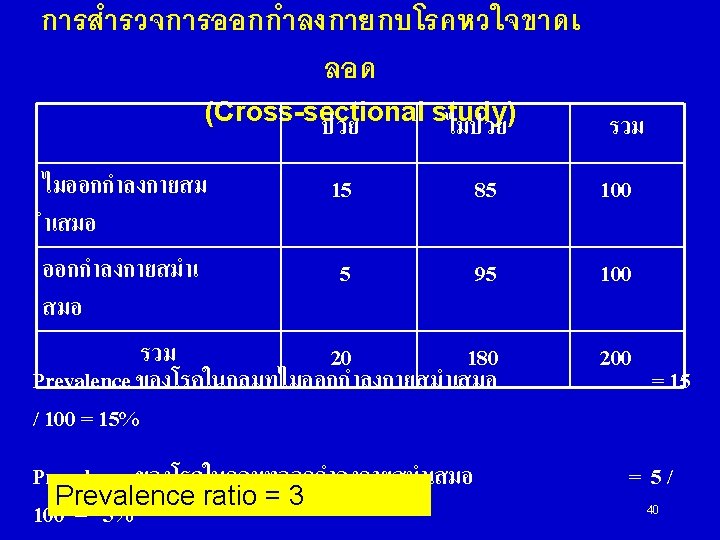
Ratio Scale (2) • Odds ratio (OR) – A ratio of two odds – Mostly used in case-control study but can be used in crosssectional study (called “prevalence odds ratio”), or cohort study with count data (called “risk odds ratio”) • Prevalence ratio (PR) – A ratio of two prevalence – Used in cross-sectional study
 – So called “Attributable risk” – A difference")
Difference Scale • Risk difference (RD) – So called “Attributable risk” – A difference of two incidence proportions – E. g. incidence proportion of mumps in nonvaccinees incidence proportion of mumps in vaccinees – Used in Cohort study (with count data) • Rate difference/ Incidence Rate difference (IRD) – A difference of two incidence rates – E. g. incidence rate of CA lung in smoker - incidence rate of CA lung in nonsmoker – Used in Cohort study (with person-time data)

The Null Value 1 0 Protective Effect stronger weaker Ratio Scale Difference Scale Causative Effect weaker The null value (no association) stronger 41

Applications • Ratio Scale Measures: RR, IRR, OR, PR – assess strength of association – Mostly use in explanatory studies (causal assessment) • Difference Scale Measures: RD, IRD, PD – assess amount of the cases/outcomes that may be associated with the exposure – E. g. RD represent excess risk among exposed group – Mostly use in predictive studies (public health impact assessment) • All measures that were calculated from incidence proportion should always be stated the period of observation 42 • All interpretations above assume that there is no bias

3. Measure of Impact

Measures of Impact Associated? Ratio scale Difference scale Measure of Association: guides causal relationships Measure of Impact: place the association found into meaningful public health context and decision How much an exposure contributes to the disease frequency in the population?

Concept of Impact Measurement Epidemiological measurements used for prediction the impact of an intervention (removal of exposure) on the disease occurrence in the population CAUSAUL RISK FACTORS • Causal risk factor (RR>1) • We estimate the excess number of cases that would not have occurred = Attributable number or excess number (AE) • Can be expressed in terms of = Attributable fraction (attributable risk percent) PROTECTIVE RISK FACTORS • Protective risk factor (RR<1) • We estimate the prevented number of cases that would occurred =Prevented number (AP) • Can be expressed as a proportion =Prevented fraction

Ex: Alcohol drinking and motorcycle accident
 AFe = IE RD = IE – IU")
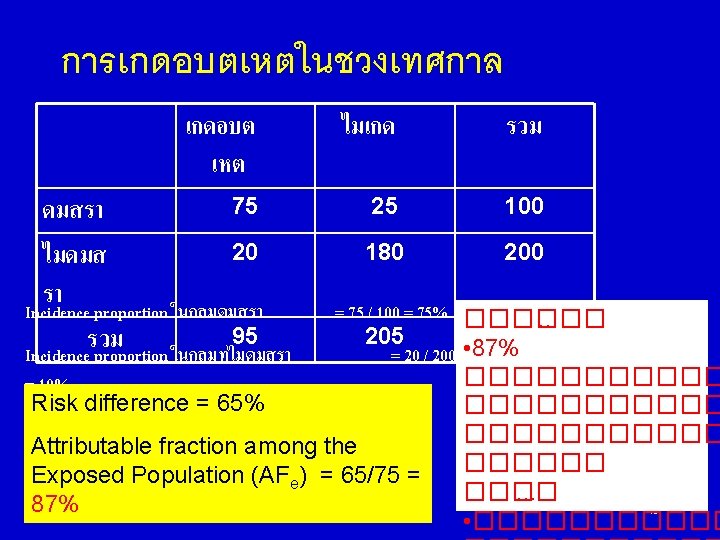
Attributable Fraction among the Exposed (AFe) AFe = IE RD = IE – IU IU RD IE = I E – IU IE = RR – 1 RR I = Incidence AFe = proportion of the risk of a disease among the exposed 47 group that is attributable to the exposure of interest
 AFp = Ip – Iu Ip AFp = proportion")
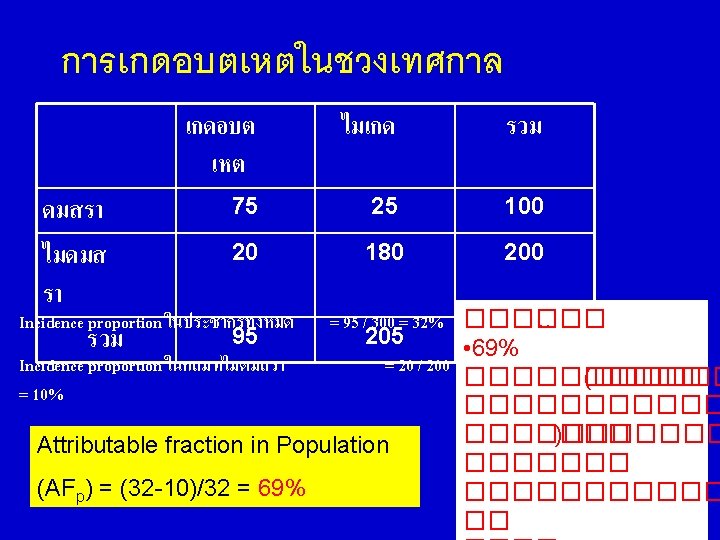
Attributable Fraction among Population (AFp) AFp = Ip – Iu Ip AFp = proportion of the risk of a disease among total population that is attributable to the exposure of interest

Ex: Mumps Vaccine
 PFe = Incidence Proportion IU (Potential cases) IU")
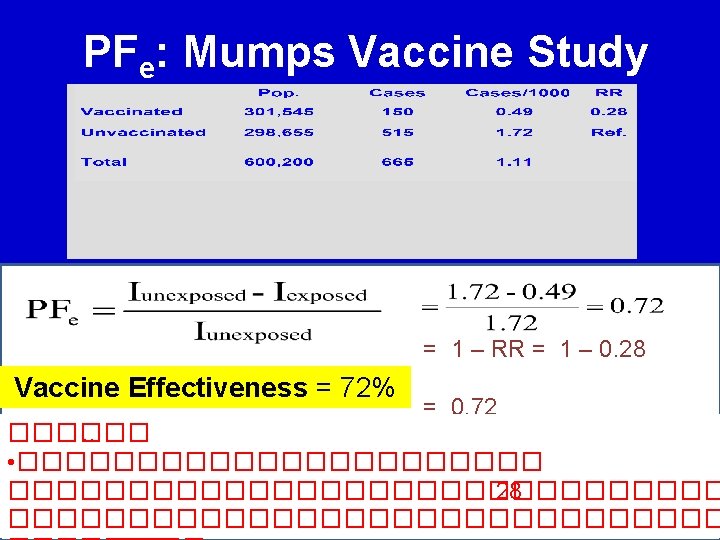
Prevented Fraction among the Exposed (PFe) PFe = Incidence Proportion IU (Potential cases) IU – I E I U – IE IU = 1 - RR (Prevented cases) IE Unexposed Exposed PFe = proportion of the potential cases among exposed group that has been prevented by the exposure of interest 52

PFe: Mumps Vaccine Study Expected number of cases among vaccinated if unvaccinated Observed number of cases = 150 Estimated number of cases prevented = 519 - 150 = 369 (or 72% of 519) 54
 PFp = IU (Potential cases) IU – I")
Prevented Fraction among the Population (PFp) PFp = IU (Potential cases) IU – I P (Prevented cases) I U – IP IU = Pe(1 -RR) Pe = prevalence of population that was exposed IP PFp = proportion of all potential cases in the total population that has been prevented by the exposure See Mumps vaccine study and try to calculate PFp by yourself! 55

Applications • All interpretations above assume that – there is no bias – All other risk factors of the diseases are constant • By understanding causal relationship, we can – estimate attributable/prevented numbers and fractions – predict potential efficacy/effectiveness of health intervention • For public health; – – Health risk assessment Policy analysis Program planning Outcome prediction 56

Prevalence Measures of Frequency Incidence Measures in Epidemiology Measures of Association Measures of Impact Point Prevalence Period Prevalence Incidence proportion Incidence Ratio scale RR, IRR, OR, PR Difference scale RD, IRD Causal factor AFe, AFp Protective factor PFe, PFp

Further Readings • Basic Epidemiology, 2 nd Ed. , R. Bonita et al. • Principles of Epidemiology in Public Health Practice, 3 rd Ed. , US CDC. • A Dictionary of Epidemiology, 5 th Ed. , M. Porta. • Modern Epidemiology, 3 rd Ed. , K. Rothman et al.

Thank you
- Slides: 60