How Good is this Cookie Briefly discuss with

How Good is this Cookie? Briefly discuss with your neighbor. http: //www. teachervision. fen. com/ teaching-methods-andmanagement/rubrics/4522. html

Texture Color 3 2 Chewy in middle, crisp on edges Golden brown 1 0 Texture either Texture resembles a crispy/crunchy or dog biscuit 50% uncooked Either dark brown Either light from overcooking or light from being 25% raw undercooking Burned Taste Home-baked taste Quality storebought taste Tasteless Store-bought flavor, preservative aftertaste – stale, hard, chalky Richness Rich, creamy, highfat flavor Medium fat contents Low-fat contents Nonfat contents

What affects a score?

Rubrics

What is a Rubric? �A rubric is a scoring guide. �Tool that distinguishes teaching and learning by clearly stating criteria and describing levels of quality. �A rubric is an authentic assessment tool used to measure students' work. �A rubric is a working guide for students and teachers, usually handed out before the assignment begins in order to get students to think about the criteria on which their work will be Stein, M, D. Kinder, J. Slibert, & D. W. Carnine, judged. 8 2006, “Designing Assessment for Mathematics, pg. 1”

Goal of a Rubric “The purpose of the rubric is not only to evaluate but also to help students increase their level of performance by outlining a vision of success. ” 9 (M. Stein, etc. , 2006, Designing Assessment for Mathematics)

“The rubric is the tool that binds assessment and student achievement by making students and parents aware of expectation from the onset. When this occurs, achievement at high level of performance is a natural outcome. There are no surprises for students during the evaluation process with the rubric. Rubrics also make grading easier and less messy for teachers. ” 10 (M. Stein, etc. , 2006, Designing Assessment for Mathematics)
 General Rubrics Specific Rubrics �Basic. Give ‘general’ �Specific to the")
Types of Rubrics (4) General Rubrics Specific Rubrics �Basic. Give ‘general’ �Specific to the task. view. �Can make assigning scores easier, faster, �“A teacher might use and more consistent. a general rubric to review a sample of papers for a task …” (Mathematics Assessment, 2005, pg. 120) 11

Types of Rubrics Cont. Analytic Rubrics � Teacher scores separate, individual parts of the product or performance first, then sums the individual scores to obtain a total score (Moskal, 2000; Nitko, 2001). � Uses multiple descriptors for each criterion evaluated. � Student has multiple opportunities to be evaluated within same rubric. � “A performance is assessed several times, using the lens of a separate criterion each time. ” (Mc. Tighe & Wiggins, 1999, p. 273) Holistic Rubrics � A holistic rubric requires the teacher to score the overall process or product as a whole, without judging the component parts separately (Nitko, 2001) � Has one performance expectation description at each numerical level. � The performance is evaluated as a whole and often given as a single score. � “A rubric used to obtain the overall impression of the quality of a performance or product. ” (Mc. Tighe & Wiggins, 1999, p. 277) Let’s look at some samples:

Remember: Rubrics Can Be • A Complete Chart • Description of Math Involved • List of Possible Techniques Involved • Scale • Other: _______ • THERE ARE MANY FORMATS FOR A 13 RUBRIC!

Analytic Rubric Ontario's Standards Pg. 16 -17

Holistic Rubric Holistic Scale pg. 2, 4, 6, 8, 21 DOROTHY IS RUNNING FOR PRESIDENT pg 11 -13

List

Authentic Tasks

Kid Friendly Analytic Rubric From Constructive Assessment in Mathematics: How to Get It Going in Your District (Anderson n. d.

Other Kid Friendly Rubrics

Self-Assessment Rubric

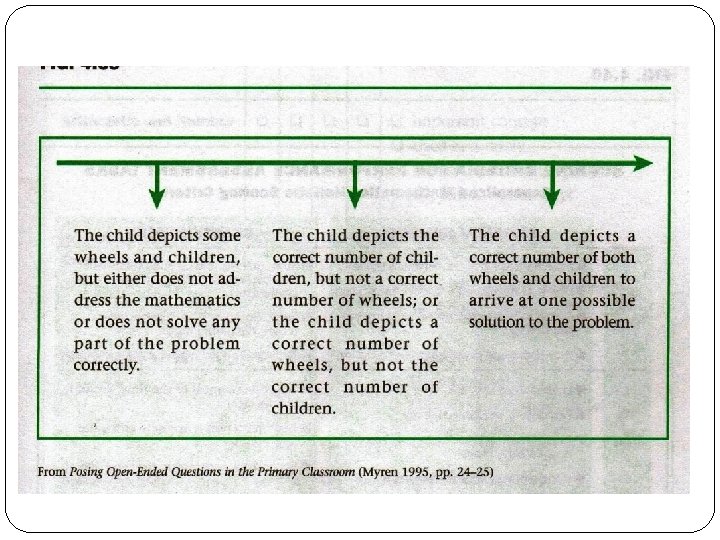
Scale 5 children went home in cars, 2 children rode home on bikes, 2 children walked. How many wheels took the children home? Draw or write to explain your answers.
 Annotated Holistic Rubric This is a holistic rubric,")
(Base-ten block task on decimals. ) Annotated Holistic Rubric This is a holistic rubric, but includes performance indicators for the task. This helps teachers justify why a certain score was given. Reys, Lindquist, Lambdin, & Smith, 2006 “Helping Children Learn Mathematics, ” pg. 77

Rubrics Can Be Used for Anything:
![Advantages to Using a Rubric �“[Rubrics] can assess thinking skills, student understanding, and students’](http://slidetodoc.com/presentation_image_h/7c06a6cf84b3f4e6e4c83f218492f462/image-27.jpg "Advantages to Using a Rubric �“[Rubrics] can assess thinking skills, student understanding, and students’")
Advantages to Using a Rubric �“[Rubrics] can assess thinking skills, student understanding, and students’ ability to apply their knowledge to mathematical tasks. ” (Designing Assessment for Mathematics, pg. 1) �Teachers can increase the quality of their direct in instruction by providing focus, emphasis, and attention to particular details as a model for students. �Students, parents, and teachers know expectations. This includes how much effort and quality is expected. 27 http: //www. teachervision. fen. com/te aching-methods-andmanagement/rubrics/4522. html

Advantages to Using a Rubric Cont. �Students can use rubrics as a tool to develop their abilities (self assessment & active involvement!). �“Rubrics can clarify for the students exactly what their strengths and weaknesses are and enable their selfassessment. ” (Charlesworth, 2005, Experiences in Math, pg. 46) �Teachers can reuse rubrics for various activities 28 (some). �Easy to adapt to different levels of learners.
 1. “Rubrics should be based developed based")
What to Include in a Rubric (3) 1. “Rubrics should be based developed based on what you are looking for in your class. ” (Charlesworth, 2005, Experiences in Math, pg. 46) 2. Take categories from key steps, items that should always be in a problem/graph, neatness, or CORE standards. 3. Levels of quality that are expected. 29 Students should be able to use the rubric to self assess their assignment prior to turning it in and get that score (or very close) when graded.

Levels of Success �Level 4—Above expectations, 31 outstanding. �Level 3—Meets expectations, acceptable. �Level 2—Needs revision or more work. �Level 1—Shows need for reteaching.

Keys to Using Rubrics � Determine what your goal is. Only have categories 32 for things you want to see. � Determine whether the rubric is formative or summative by how you use the data. (Will you reuse or is it specific to this time? ) � Determine the number of points on your rubric. Some say that it is important to have an even number of points possible, usually 4 or 6 because scorers are less discriminating with an even point system. (Stenmark, 1991; Danielson 1997) � “Anchor Papers. ” Have a good set of examples for each rubric level. � Share these examples with students! If these are not shared, the rubric loses its effectiveness.

“Anchor Papers” � It is crucial to show students examples of each rubric level. � Many performance-based activities will come with a rubric. Begin with that and adapt as needed. Many also come with different examples of each quality level to help the teacher know how to properly score. Share these with students. � Work with other grade level teachers to share samples. � Let students practice scoring samples. (Peer & Self. ) � You may need to get permission from students and parents to use their paper as a sample. You may want to remove the name. 33 “Dorothy” Anchor Papers pg. 14 -26
")
�Let’s take a look at this problem. (We will be scoring student samples. ) Molly needs some green paper for her art project. She can get 2 sheets for 4 cents or 4 sheets for 6 cents at another store. Which is a better price? Explain your thinking at each step. o w T 4 r o f s t n e c 35 4 Sheets for 6 cents is a better deal. (Mathematics Assessment, 2005, pg. 126 -128) Four for 6 cents

Before Beginning to Score a Rubric Indentify: �the essential mathematics �the possible correct answers �the practice implications of the problem (for example, in this problem the number of pieces of paper needed is known—students may or may not take this into account) �What specifics, if any, you would add to the rubric(s). 36

Idea for Scoring 37

Let’s Practice Scoring a Holistic Rubric Fully accomplishes the purpose of the task. Shows a good understanding and use of the main ideas of the problem. 4 Communicates thinking clearly, using writing, calculations, diagrams and charts, or other representations. Substantially accomplishes the purposes of the task. Shows a reasonable understanding and use of the main ideas of the 3 problems. Communicates thinking fairly well, but may use only one representation. Partially accomplishes the purpose of the task. Shows partial but limited grasp of the main mathematical ideas. 2 Recorded work may be incomplete, misdirected, or not clearly represented. Shows little or no progress in accomplishing the purpose of the task. 1 Shows little understanding of the main mathematical tasks. Work is almost or completely impossible to decipher. (Mathematics Assessment, 2005, pg. 120)
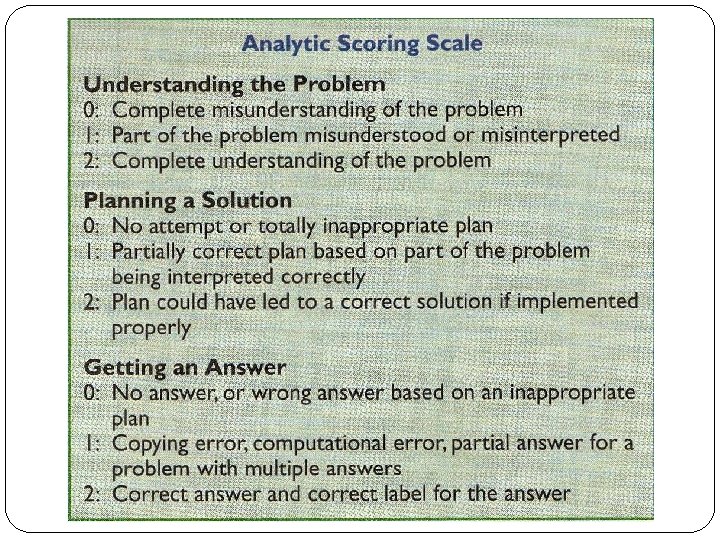
 0 Complete")
Let’s Practice Scoring an Analytic (Mathematics Assessment, 2005, Rubric pg. 121, adapted) 0 Complete misunderstanding of the problem. Understanding the Problem 3 Part of the problem misunderstood or misinterpreted. 6 Complete understanding of the problem. 0 No attempt or totally inappropriate plan. Planning a Solution 3 Partially correct plan based on part of the problem being interpreted correctly. 6 Plan could have led (or did lead) to a correct solution if implemented properly. 0 No answer or wrong answer based on inappropriate plan. Getting an Answer 1 Copying error; computational error; partial answer for a problem with multiple answers. 3 Correct answer and correct label for the answer.

Holistic Scores & Comments Analytic Score & Comments Jeanette 2—Substantially accomplishes the task, recognizes getting more for amount of money, communication missing. Understanding – 3 (no price comparing Planning— 0 (reasoning missing) Answer— 3 Martha 4—Fully accomplishes the task; shows a grasp of the concept, communication clear. Understanding— 6 Planning— 6 Correct Answer— 3 Michael 3—Partial understanding of purpose of task, understood central idea. (Michael includes extra info that 4 is more than 2, does not explain. ) Understanding— 3 Planning— 3 Answer— 3 Mashonna 1—Shows little or no Understanding— 0 progress, doesn’t seem to be Planning— 0 getting it. Needs reteaching. Answer— 3 (No reasoning given) Student (Mathematics Assessment, 2005, pg. 129, adapted)

Designing a Rubric Criteria Levels of Success 41 Use a variety of expectations already in place to create a rubric. Checklis t Rubri c Objectiv es

Criteria vs. Rubrics 42 Criteria Rubric �Describes intent of �More detailed. standard. �Similar to learning objective. �Tells levels of success. (MAIN DIFFERENCE!) �Easy to turn criteria into a rubric

43

Turning a Checklist into a Rubric If you have a checklist, you can easily make it into a rubric. For example, a graph should always have 1. A title. 2. Labels on both axis. 3. Be accurate. 4. Be neat and readable. 5. Other ______ This is your criteria! Next, determine levels of success. 46

TITLE LABELS ACCURAC NEATNESS Y 3 All parts of the The graph contains graph (units of a title that clearly measurement, tells what the data rows, etc. ) are shows. correctly labeled. All data is The graph is very accurately neat and easy to represented on the read. graph. 2 The graph contains Most parts of the a title that suggests graph are correctly what the data labeled. shows. Data representation contains minor errors. The graph is generally neat and readable. 1 The title does not reflect what the data shows. The graph is incorrectly labeled. The data is inaccurately represented and contains errors. The graph is sloppy and difficult to read. 0 The graph does not have a title The graph is not labeled. The data is missing. The graph cannot be read. 47

Keys to Design a Rubric 1. Decide the type of rubric. (chart, scale, list, etc. ) 2. Determine what you would like to see in the task. These will be your categories. 3. Next you need to determine the quality levels acceptable …. . How many levels? 48

Determining Levels of Success Identify the key mathematical elements that determine whether a paper is acceptable (4) or unacceptable (1). b) Identify specific differences between a paper that is barely unacceptable (2) and one that is clearly unacceptable (1). c) Give specific criteria for distinguishing between a paper that is acceptable, but just so-so (3), and one that clearly shows good understanding (4) in the task, correctly applies appropriate mathematical tools to the task, and uses clear mathematical reasoning to explain the solution process. a) (Huetink & Munshin, 2000, Teaching Mathematics for the 21 st Century: Methods and Activities for Grades 6 -12) 49

Rubric Websites �http: //rubistar. 4 teachers. org/i ndex. php? screen=Customiz e. Template&bank_rubric_id= 25§ion_id=7& �http: //www. teachnology. com/ web_tools/rubrics/homework/ �http: //www. rubrician. com/mat h. htm 50

Let’s Practice Developing Our Own Rubrics …. Take the remainder of the time (__ minutes) to discover some of these sites.

Step by Step Help in Designing a Rubric A step-by-step process for designing scoring rubrics for classroom use is presented below. Information for these procedures was compiled from various sources (Airasian, 2000 & 2001; Mertler, 2001; Montgomery, 2001; Nitko, 2001; Tombari & Borich, 1999). The steps will be summarized and discussed, followed by presentations of two sample scoring rubrics. Step 1: Re-examine the learning objectives to be addressed by the task. This allows you to match your scoring guide with your objectives and actual instruction. Step 2: Identify specific observable attributes that you want to see (as well as those you don’t want to see) your students demonstrate in their product, process, or performance. Specify the characteristics, skills, or behaviors that you will be looking for, as well as common mistakes you do not want to see. Step 3: Brainstorm characteristics that describe each attribute. Identify ways to describe above average, and below average performance for each observable attribute identified in Step 2. Step 4 a: 52 For holistic rubrics, write thorough narrative descriptions for excellent work and poor work incorporating each attribute into the description. Describe the highest and lowest levels of performance combining the descriptors for all attributes. http: //pareonline. net/getvn. asp? v=7&n=25

Step by Step Help in Designing a Rubric Cont. Step 4 b: For analytic rubrics, write thorough narrative descriptions for excellent work and poor work for each individual attribute. Describe the highest and lowest levels of performance using the descriptors for each attribute separately. Step 5 a: For holistic rubrics, complete the rubric by describing other levels on the continuum that ranges from excellent to poor work for the collective attributes. Write descriptions for all intermediate levels of performance. Step 5 b: For analytic rubrics, complete the rubric by describing other levels on the continuum that ranges from excellent to poor work for each attribute. Write descriptions for all intermediate levels of performance for each attribute separately. Step 6: Collect samples of student work that exemplify each level. These will help you score in the future by serving as benchmarks. Step 7: Revise the rubric, as necessary. Be prepared to reflect on the effectiveness of the rubric and revise it prior to its next implementation. 53 http: //pareonline. net/getvn. asp? v=7&n=25

Summary of Steps 54

Example Upper Elementary Math 55 Mr. Harris, a fourth-grade teacher, is planning a unit on the topic of data analysis, focusing primarily on the skills of estimation and interpretation of graphs. Specifically, at the end of this unit, he wants to be able to assess his students' mastery of the following instructional objectives: 1. Students will properly interpret a bar graph. 2. Students will accurately estimate values from within a bar graph. (step 1) Since the purpose of his performance task is summative in nature - the results will be incorporated into the students' grades, he decides to develop a holistic rubric. He identifies the following four attributes on which to focus his rubric: estimation, mathematical computation, conclusions, and communication of explanations (steps 2 & 3). Finally, he begins drafting descriptions of the various levels of performance for the observable attributes (steps 4 & 5). The final rubric for his task appears in Table 4.

Mr. Harris’s Rubric Table 4: Math Performance Task – Scoring Rubric Data Analysis Name _______________ Date ______ Score Description 4 Makes accurate estimations. Uses appropriate mathematical operations with no mistakes. Draws logical conclusions supported by graph. Sound explanations of thinking. 3 Makes good estimations. Uses appropriate mathematical operations with few mistakes. Draws logical conclusions supported by graph. Good explanations of thinking. 2 Attempts estimations, although many inaccurate. Uses inappropriate mathematical operations, but with no mistakes. Draws conclusions not supported by graph. Offers little explanation. 1 Makes inaccurate estimations. Uses inappropriate mathematical operations. Draws no conclusions related to graph. Offers no explanations of thinking. 0 No response/task not attempted. 56 http: //pareonline. net/getvn. asp? v=7&n=25
- Slides: 56