Analytical Epidemiologic Study Panithee Thammawijaya Bureau of Epidemiology

Analytical Epidemiologic Study Panithee Thammawijaya Bureau of Epidemiology 1

����� �� • Measure of Frequency: ����� – ������� Prevalence – ����� Incidence • Measure of Association: ���������� ���� – Risk Ratio, (Incidence) Rate Ratio ===> Cohort Study – Odds Ratio ===> Case – Control Study 3
 If you want to count… “State” Existing of… at a point")
From Last Time…(1) If you want to count… “State” Existing of… at a point of time Prevalence (=New + Old cases) E. g. • Number of all DM cases a village in Jan 2009 = 120 • Proportion of current smokers in company on Jan 1 st, 2010 = 15% of total employees “Event” Occurring of… during a period of time Incidence (=New cases) E. g. • Number of flu cases occurred in a village 2009 = 150 • Proportion of new smokers in a company during Jan to May 2010 = 2% of non-smoker on Dec 31 st, 2009
 Prevalence Point Prevalence = At time t 1 Period Prevalence =")
From Last Time…(2) Prevalence Point Prevalence = At time t 1 Period Prevalence = During time t 1 -t 2 = sick (old) = sick (new) = not sick
 Incidence Proportion (Risk; Cumulative Incidence ) = Incidence Rate = (Rate;")
From Last Time…(3) Incidence Proportion (Risk; Cumulative Incidence ) = Incidence Rate = (Rate; Incidence Density) During time t 1 -t 2 = person-time = sick (old) = sick (new) = not sick
 Disease Non disease Total")
2 x 2 Table and Measure of Association (Count Data) Disease Non disease Total Exposed A B A+B Unexposed C D C+D A+C B+D A+B+C+D Total Risk Ratio (RR) = [A/(A+B)] / [C/(C+D)] Odds Ratio (OR) = [A/C] / [B/D] = AD/BC Prevalence Ratio (PR) = [A/(A+B)] / [C/(C+D)] 7
 No. of Cases Person-Time")
2 x 2 Table and Measure of Association (Person-Time Data) No. of Cases Person-Time Exposed A TE Unexposed B TU A+B TE+TU Total Incidence Ratio (IRR) = [A/TE] / [B/TU ] 8

Ratio Scale Measures and Theirs Relationships 0 OR IRR 1 RR Protective Effect stronger weaker RR IRR ∞ OR Causative Effect weaker stronger The null value (no association) Protective Factor Risk Factor Causative Factor 9

How epidemiologists work? 1. Counting: Counts cases or health events, and describes them in terms of time, place, and person Descriptive Epidemiology 2. Dividing: Divides the number of cases by an appropriate denominator to calculate “rates” 3. Comparing: Compares these “rates” over time or for different groups of people * Rate, in this case, simply means division of one number by another Analytic Epidemiology
 Experimental Study (exposure given by researcher) ���������")
Classification epidemiological study Observational Study (natural exposure) Experimental Study (exposure given by researcher) ��������� Descriptive Study Analytic Study ���������� ) (������ ) Case report Case series From: Ram Rungsin, modified Cross – sectional Case control Cohort 11

������� Case report: a hypertension case in young adult Descriptive Case series: three hypertension cases in young adults Cross – sectional study: a hypertension survey Cross – sectional study: HT vs Salt consumption Case – control study: HT vs Salt consumption Cohort study: HT vs Salt consumption Clinical trial: Beta blocker vs Hypertension From: Ram Rungsin Analytic Experiment 12

������ ���������� Magnitude and severity Distribution: Time, Place, Person <<Hypothesis formulation>> 13

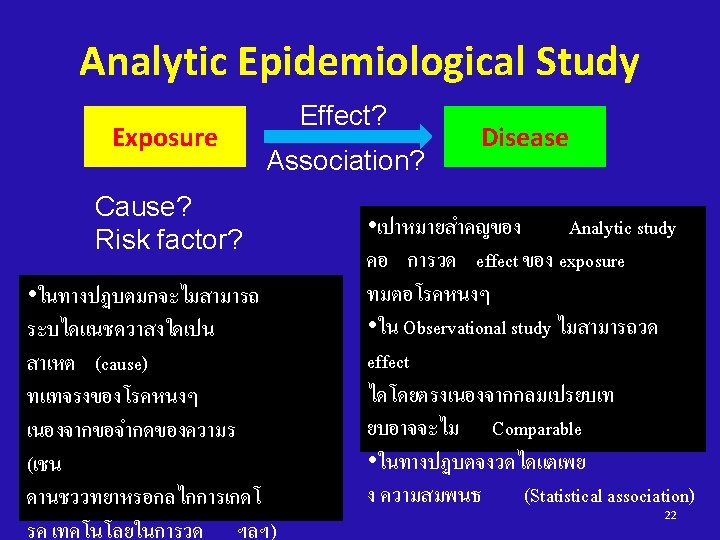
��������� ���� ������ A? ���� Association between Disease and Factor A <<Hypothesis testing>> 14
 Mr. A • 20 -yrs male,")
What Is the “Cause” of a Disease? (1) Mr. A • 20 -yrs male, Thai, farmer, etc. Counterfactual-not observed 1990 2010 Event actually occurred-observed Mr. A • 20 -yrs male, Thai, farmer, etc. Did pumpkin have an effect on the disease in Mr. A? Yes, causative effect.
 Mr. A • 20 -yrs male,")
What Is the “Cause” of a Disease? (2) Mr. A • 20 -yrs male, Thai, farmer, etc. Counterfactual-not observed 1990 2010 Event actually occurred-observed Mr. A • 20 -yrs male, Thai, farmer, etc. Did pumpkin have an effect on the disease in Mr. A? No. He is doomed.
 Mr. A • 20 -yrs male,")
What Is the “Cause” of a Disease? (3) Mr. A • 20 -yrs male, Thai, farmer, etc. Counterfactual-not observed 1990 2010 Event actually occurred-observed Mr. A • 20 -yrs male, Thai, farmer, etc. Did pumpkin have an effect on the disease in Mr. A? No. He is immune.
 Mr. A • 20 -yrs male,")
What Is the “Cause” of a Disease? (4) Mr. A • 20 -yrs male, Thai, farmer, etc. Counterfactual-not observed 1990 2010 Event actually occurred-observed Mr. A • 20 -yrs male, Thai, farmer, etc. Did pumpkin have an effect on the disease in Mr. A? Yes, protective effect.

What Is the “Cause” of a Disease? Unexposed group • age 15 -25 yrs 1990 ? 2010 Exposed group • age 15 -25 yrs ? Did pumpkin have an effect on the disease in population? Validity & Precision?

การศกษาเชงวเคราะห • Cross – sectional Study • Case – Control Study • Cohort Study 23

Cross-sectional study In a cross-sectional study, the measurements of exposure and effect are made at the same time 24
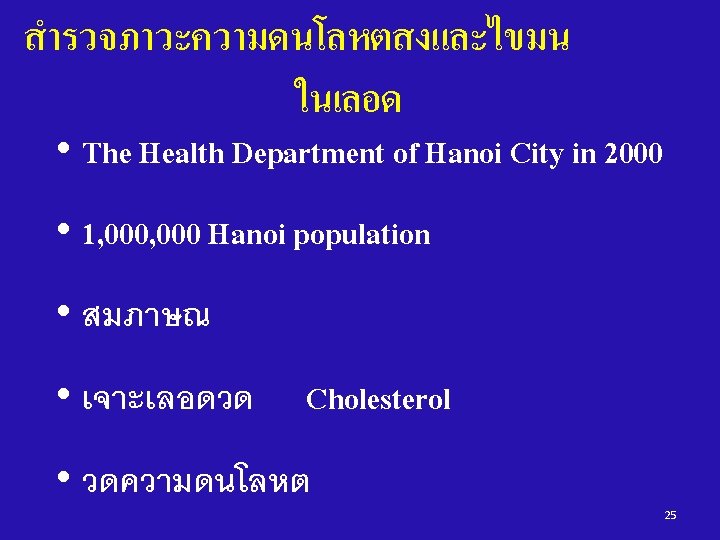

������� • 60, 000 = hypertension • 200, 000 = high blood cholesterol • Prevalence of HT = ? 6% = 60, 000/1, 000 “ �������� 26

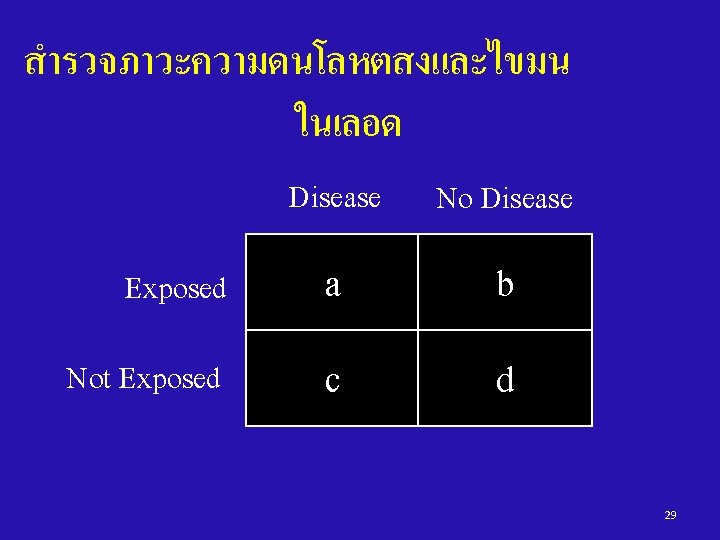
สำรวจภาวะความดนโลหตสงและไขมน ในเลอด Defined Population Gather Data on Exposure & Disease at the same time Exposed: Not Exposed: Have disease No disease 28

สำรวจภาวะความดนโลหตสงและไขมน ในเลอด HT No HT High Chol. 20, 000 180, 000200, 000 Normal Chol. 40, 000 760, 000800, 000 , 60, 000940, 0001, 000 30

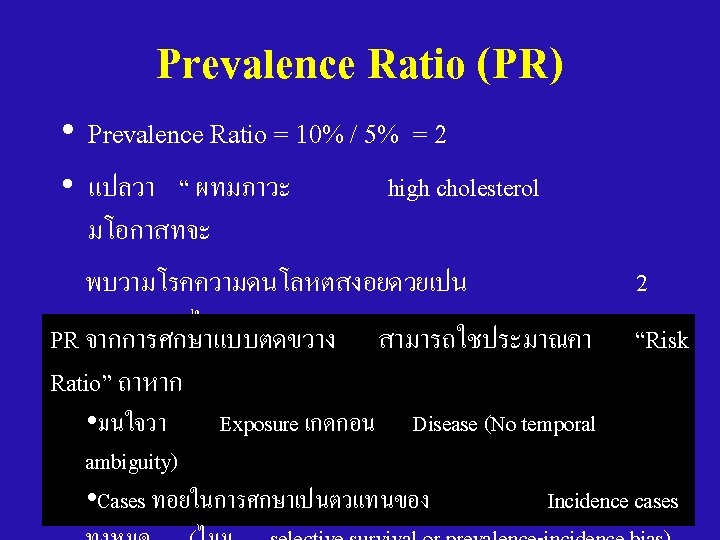
สำรวจภาวะความดนโลหตสงและไขมน ในเลอด • High Cholesterol : HT Prevalence Rate = 20, 000 / 200, 000 = 10% • Normal Cholesterol : HT Prevalence Rate = 40, 000 / 800, 000 = 5% • Prevalence Ratio (PR) = 10% / 5% = 2 31

Cross-sectional Studies • Advantages: – quick, inexpensive – Useful for health administration and hypothesis formulation • Disadvantages: – low prevalence due to • Low incidence (rare disease) • short duration – Uncertain temporal relationships – Selection Bias (Selective survival) – Information Bias (Recall bias) 33

Cohort study A study in which the incidence proportion/rate of disease in 2 or more cohorts is compared 34

A Roman Cohort = A unit of 300 -600 men in the ancient Roman army Two centuries made one maniple and three maniples made up one cohort. 35

“COHORT” in Epidemiology = A group of persons who are followed over time 36
 at start Exposed Not Exposed ������� ������ 39")
Person at-risk (without disease) at start Exposed Not Exposed ������� ������ 39

Persons without the disease !!!! 1970 Exposed Not Exposed Smoke #500 persons Not Smoke #500 persons Disease No Disease 2001 Disease No Disease Lung Cancer No Lung Cancer # 455 # 1 # 499 40

CA Lung No CA Smoke 45 455 500 Not smoke 1 499 500 • Incidence of Smoker who develop Lung Cancer = 45/500 • Incidence of Non -Smoker whodevelop Lung Cancer = 1/500 • Risk Ratio of smoking for Lung Cancer = 45 • ��������� 41

Risk Ratio CA Lung No CA Smoke A B A+B Not smoke C D C+D Risk Ratio = A/A+B C/C+D 42

Design 1: Prospective Cohort Study Time of Study Begin Cause Direction of inquiry Effect Disease Population Sampling? People without disease Exposed No disease Disease Unexposed No disease • If the study started before the disease occurred… 44 “Prospective cohort study”
")
Ex: A Study of Smoking and Lung Cancer (Prospective cohort study with person-time data) No. of Case F/U time (person-year) Smoking 90 30, 526 Non smoking 10 28, 364 Total 100 58, 890 Incidence rate in smokers = 90 / 30, 526 = 2. 9 per 1000 person-years Incidence rate in non-smokers = 10 / 28, 364 = 0. 5 per 1000 person-years Rate ratio = 2. 9/0. 5 = 5. 8 Rate of developing the disease in smokers is 5. 8 45 times of that in non-smokers

Design 2: Retrospective Cohort Study Time of Study Begin Cause Direction of inquiry Effect Disease Population Sampling? People without disease Exposed No disease Disease Unexposed No disease • If the study started after the disease occurred… 46 “Retrospective (Historical) cohort study”
 Ill")
Ex: An Diarrhea Outbreak in a Party (Retrospective Cohort study with count data) Ill Not ill Total Ate salad 150 50 200 Not eat 10 90 100 Total 160 140 300 Incidence proportion in exposed group = 150 / 200 = 75% Incidence proportion in non-exposed group = 10 / 100 = 10% Risk ratio = 75/10 = 7. 5 Risk of developing the disease in exposed group is 47 7. 5 times of that in non-exposed group

Cohort Studies - Advantages • Can measure disease incidence • Can study the natural history • Provides strong evidence of casual association between E and D (time order is known) • Multiple diseases can be examined • Good choice if exposure is rare (assemble special exposure cohort) • Generally less susceptible to bias 48

Cohort Studies - Disadvantages • Takes time, need large samples, expensive • Not useful for rare diseases/outcomes • With prolonged time period: – Exposures change during follow-up period • Selection Bias (loss-to-follow up in pros. cohort or selective survival in retro. cohort) • Information Bias (recall bias in retro. Cohort) 49
 and compares them")
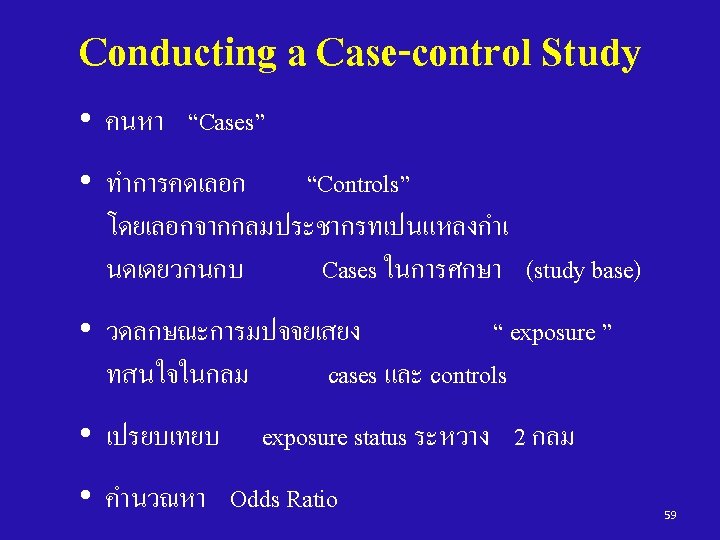
Case-control study Key: it begins with people with the disease (cases) and compares them to people without the disease (controls) 50

Case – control Study Non Cases Factor A 52

Design for a case – control Study Disease Exposed Not Exposed No Disease Exposed Not Exposed 53

Design of a case-control study Cause Exposed Not exposed Exposed Time of Study Begin Direction of inquiry Effect Case (People with disease) Case Population Controls (People without disease) Non-case Population Not exposed • Identify true case, and true non-case populations • Sampling fractions from case<>non-case • Determine exposure status by history 54

What is “Odds”? Odds of an event with an occurrence probability of p is the ratio of p to (1 -p) Odds = Probability of event Probability of non-event = p/(1 -p) Probability = odds/(1+odds) + D + E - a c b d Head-to-Head = 9 : 18 For case-control study: Odds of Exposure among cases = a/(a+c) = a/c c/(a+c) Odds of Exposure among noncases = b/(b+d) = b/d d/(b+d)
 = Ratio of two odds In case-control")
What is “Odds Ratio”? Odds Ratio (OR) = Ratio of two odds In case-control study, Exposure OR + D + E - a c b d = Odds of exposure among cases Oddsof exposure among noncases = a/c = ad/bc b/d For cohort study: Odds of disease among the exposed = a/(a+b) = a/b b/(a+b) Odds of disease among the unexposed = c/(c+d) = c/d d/(c+d) In cohort study, Disease OR = Odds of disease among the exposed Odds of disease among the unexposed = a/b = ad/bc c/d
 Disease Non disease Total")
2 x 2 Table and Measure of Association (Count Data) Disease Non disease Total Exposed A B A+B Unexposed C D C+D A+C B+D A+B+C+D Total Risk ratio (RR) = [A/(A+B)] / [C/(C+D)] Odds ratio (OR) = [A/C] / [B/D] = [A/B] / [C/D] If disease is rare, then OR ~ RR 57

Case-Control V. S. Cohort Cause Factors Effect Case – Control Cohort Disease 58
 • identify and enroll all incident cases")
Sources of Cases • Population-based (������� ) • identify and enroll all incident cases from a defined population • e. g. , disease registry, defined geographical area, vital records • Hospital-based (��������� ) – identify cases where you can find them • e. g. , hospitals, clinics. – But…… • issue of representativeness? • prevalent vs incident cases? 60

Sources of Controls • Population-based Controls • ideal, represents exposure distribution in the general population, e. g. , – driver’s license lists (16+) – Medicare recipients (65+) – Tax lists – Voting lists – Telephone RDD survey 61

Sources of Controls • Hospital-based Controls – Hospital-based case control studies used when population-based studies not feasible – More susceptible to bias – Advantages • similar to cases? (hospital use means similar SES, location) • more likely to participate (they are sick) • efficient (interview in hospital) – Disadvantages • they have disease? – Don’t select if risk factor for their disease is similar to the disease under study e. g. , COPD and Lung CA • are they representative of the study base? 62

Other Sources of Controls • Relatives, Neighbors, Friends of Cases – Advantages • similar to cases wrt SES/ education/ neighborhood • more willing to co-operate – Disadvantages • more time consuming • cases may not be willing to give information? • may have similar risk factors (e. g. , smoke, alcohol, golf) 63

Ex: Smoking and Lung Cancer Controls Cases Lung Cancer NO Lung Cancer #50 cases #200 controls Exposed Unexposed Smoke Not Smoke # 45 # 5 # 99 # 101 65
/(100/9900) =5 OR = (500/9500)/(100/9900) = 5. 2 Smoke Not")
Cohort Study RR = (500/10000)/(100/9900) =5 OR = (500/9500)/(100/9900) = 5. 2 Smoke Not smoke Case – Control Study OR = (50/10)/(95/99) = 5. 2 Smoke Not smoke CA Lung No CA 500 9, 500 10, 000 9, 900 10, 000 100 CA Lung No CA 50 95 10 99 • Do not have incidence in exposed & incidence in non exposed • Cannot calculate the RR directly 66
 (Case-control study) Case Control Ate ice")
Ex: A Food Poisoning in a School (1) (Case-control study) Case Control Ate ice cream 40 17 Not eat 15 38 55 55 Total Odds of eating ice cream in cases = (40/55) / (15/55) = 40/15 = 2. 67 Odds of eating ice cream in control = (17/55) / (38/55) = 17/38 = 0. 45 Odds ratio = 2. 67 / 0. 45 = 5. 9 67
 (Case-control study) How to interpret odds")
Ex: A Food Poisoning in a School (2) (Case-control study) How to interpret odds ratio of 5. 9 ? ? ? In conventional case-control study: case vs. non-case 1. Study cases represent cases in population 2. Study control represent non-case in population >>> OR of 5. 9 means “Odds of disease among the exposed is 5. 9 times of that among the unexposed” If 1. +2. + 3. Rare disease >>> OR ≈ RR In population-based case-control study: • With case-cohort sampling >>> OR = RR • >>> OR = IRR With density sampling 68
 – so ideal for outbreaks")
Case-control Study - Advantages • Quick and cheap (relatively) – so ideal for outbreaks • Can study rare diseases (or new) • Can evaluate multiple exposures 69
 • cannot estimate")
Case-control Study - Disadvantages • uncertain of Exposure-Disease relationship (esp. timing) • cannot estimate disease incidence • inefficient if exposures are rare • Selection Bias – Much worry about representativeness of controls – selective survival if not using incidence cases • Information Bias (recall bias) 70

71

Acknowledgement • • Dr. Chuleeporn Jiraphongsa Dr. Ram Rungsin Dr. Darin Areechokchai Dr. Mathew J. Reeves 72
- Slides: 72