Causal Diagrams for Epidemiological Research Eyal Shahar MD

- Slides: 50
Causal Diagrams for Epidemiological Research Eyal Shahar, MD, MPH Professor Division of Epidemiology & Biostatistics Mel and Enid Zuckerman College of Public Health The University of Arizona
What is it and why does it matter? A tool (method) that: • clarifies our wordy or vague causal thoughts about the research topic • helps us to decide which covariates should enter the statistical model—and which should not • unifies our understanding of confounding bias, selection bias, and information bias
What is the key question in a non-randomized study? When estimating the effect of E (“exposure”) on D (“disease”), what should we adjust for? or Confounder selection strategy
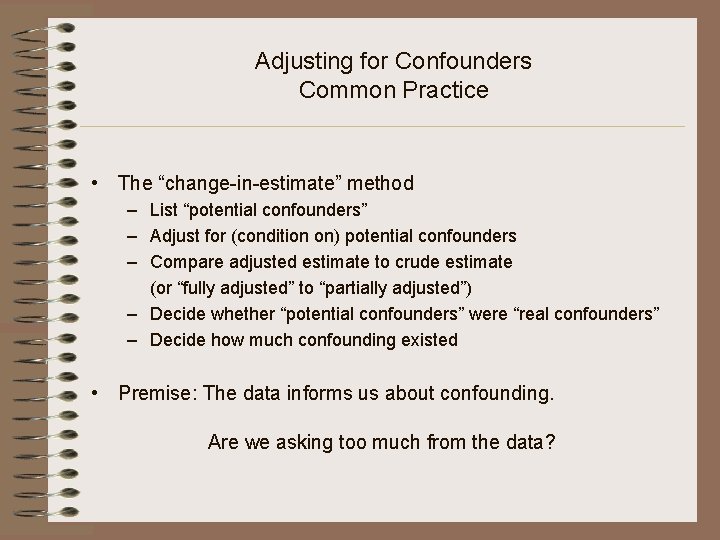
Adjusting for Confounders Common Practice • The “change-in-estimate” method – List “potential confounders” – Adjust for (condition on) potential confounders – Compare adjusted estimate to crude estimate (or “fully adjusted” to “partially adjusted”) – Decide whether “potential confounders” were “real confounders” – Decide how much confounding existed • Premise: The data informs us about confounding. Are we asking too much from the data?
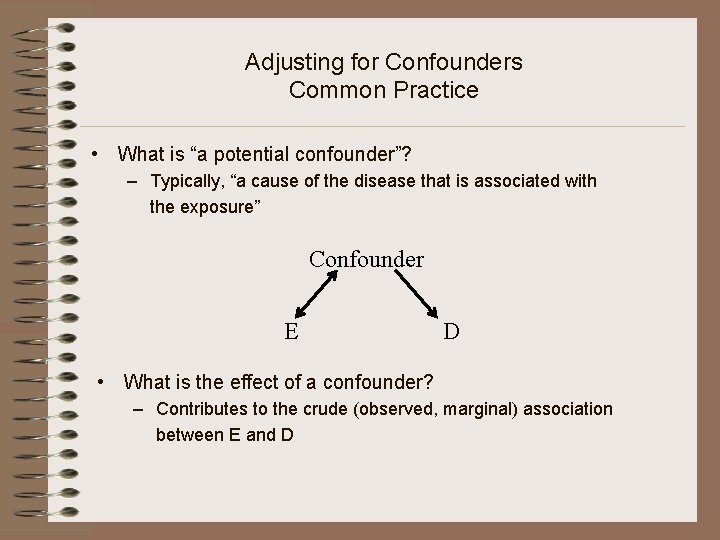
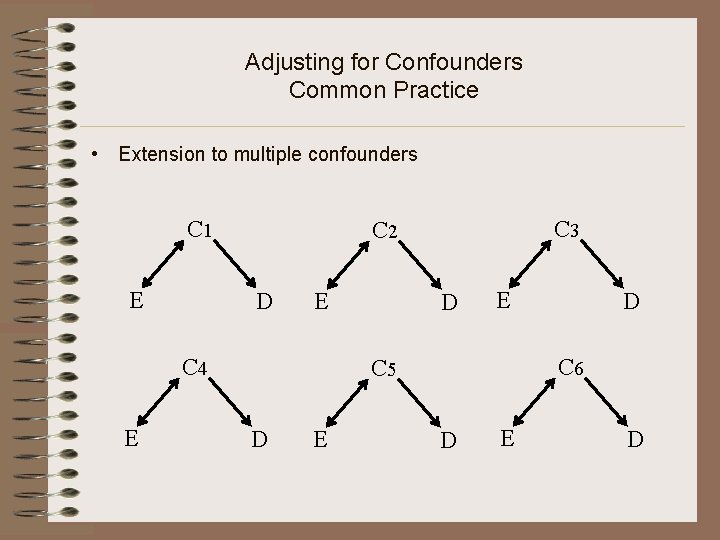
Adjusting for Confounders Common Practice • What is “a potential confounder”? – Typically, “a cause of the disease that is associated with the exposure” Confounder E D • What is the effect of a confounder? – Contributes to the crude (observed, marginal) association between E and D
Adjusting for Confounders Common Practice • Extension to multiple confounders C 1 E D E C 4 E C 3 C 2 D E C 6 C 5 D E D
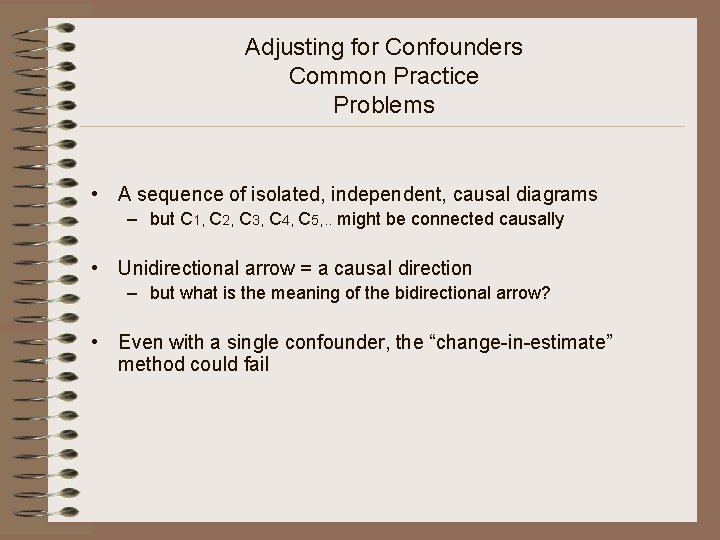
Adjusting for Confounders Common Practice Problems • A sequence of isolated, independent, causal diagrams – but C 1, C 2, C 3, C 4, C 5, . . might be connected causally • Unidirectional arrow = a causal direction – but what is the meaning of the bidirectional arrow? • Even with a single confounder, the “change-in-estimate” method could fail
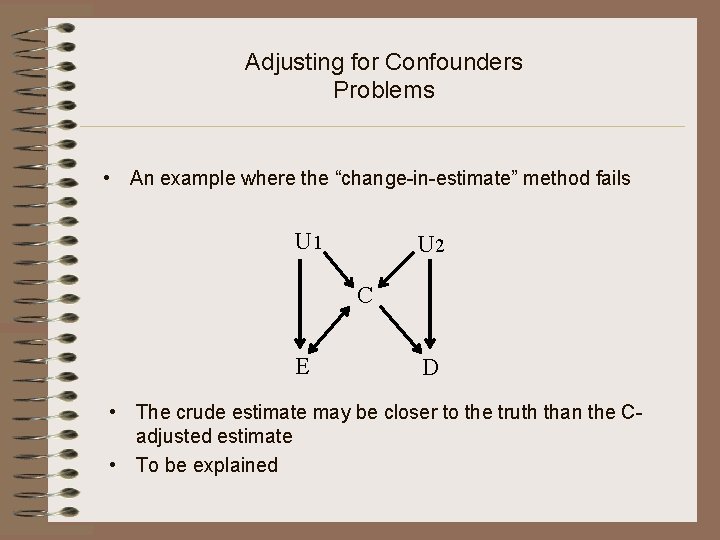
Adjusting for Confounders Problems • An example where the “change-in-estimate” method fails U 1 U 2 C E D • The crude estimate may be closer to the truth than the Cadjusted estimate • To be explained
Alternative A Causal Diagram • • A method for selecting covariates Extension of the confounder triangle Premises displayed in the diagram New terms: – Path – Collider on a path – Confounding path
Selected references • Pearl J. Causality: models, reasoning, and inference. 2000. Cambridge University Press • Greenland S et al. Causal diagrams for epidemiologic research. Epidemiology 1999; 10: 37 -48 • Robins JM. Data, design, and background knowledge in etiologic inference. Epidemiology 2001; 11: 313 -320 • Hernan MA et al. A structural approach to selection bias. Epidemiology 2004; 15: 615 -625 • Shahar E. Causal diagrams for encoding and evaluation of information bias. J Eval Clin Pract (forthcoming)
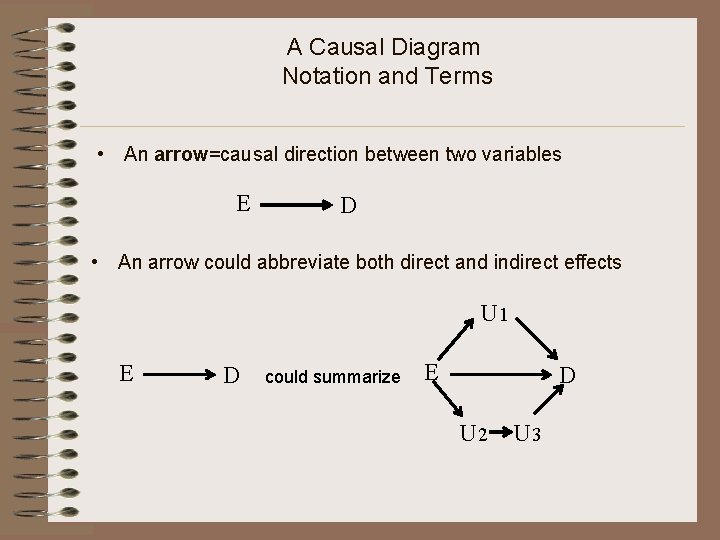
A Causal Diagram Notation and Terms • An arrow=causal direction between two variables E D • An arrow could abbreviate both direct and indirect effects U 1 E D could summarize E D U 2 U 3
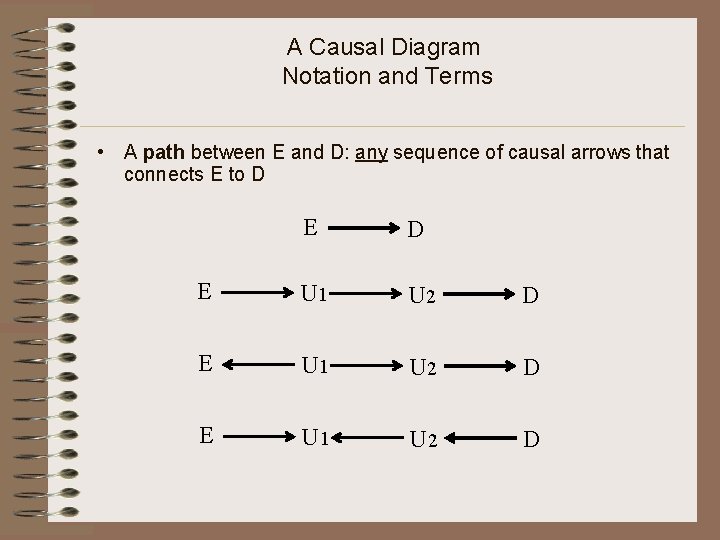
A Causal Diagram Notation and Terms • A path between E and D: any sequence of causal arrows that connects E to D E U 1 U 2 D
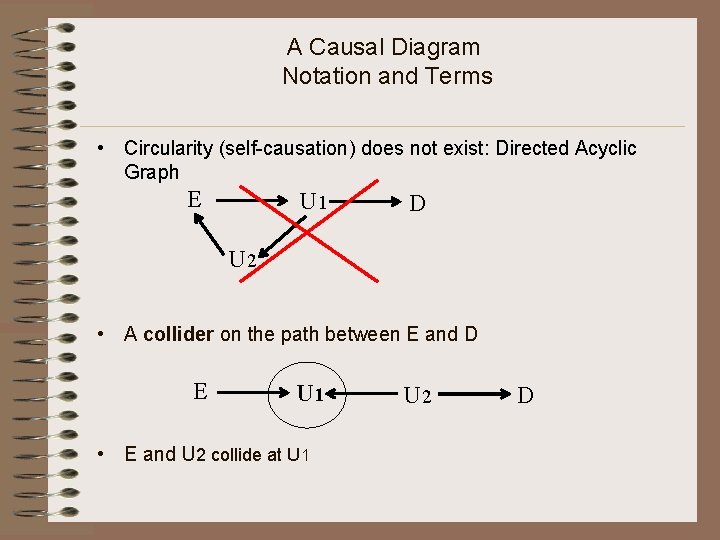
A Causal Diagram Notation and Terms • Circularity (self-causation) does not exist: Directed Acyclic Graph E U 1 D U 2 • A collider on the path between E and D E U 1 • E and U 2 collide at U 1 U 2 D
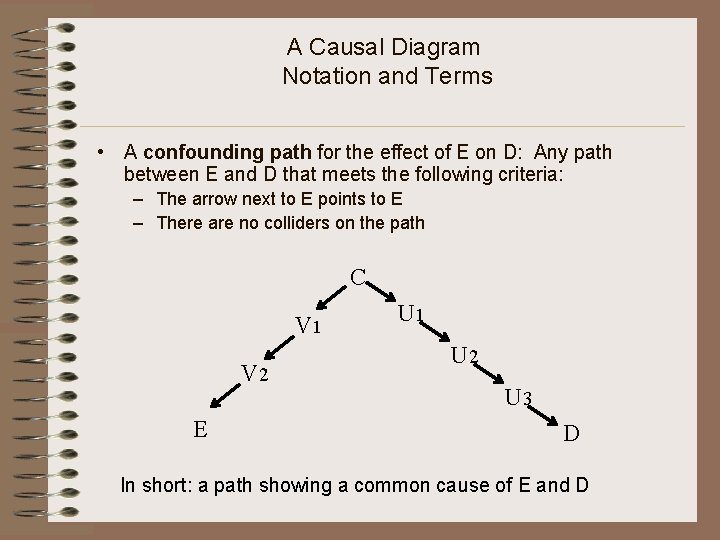
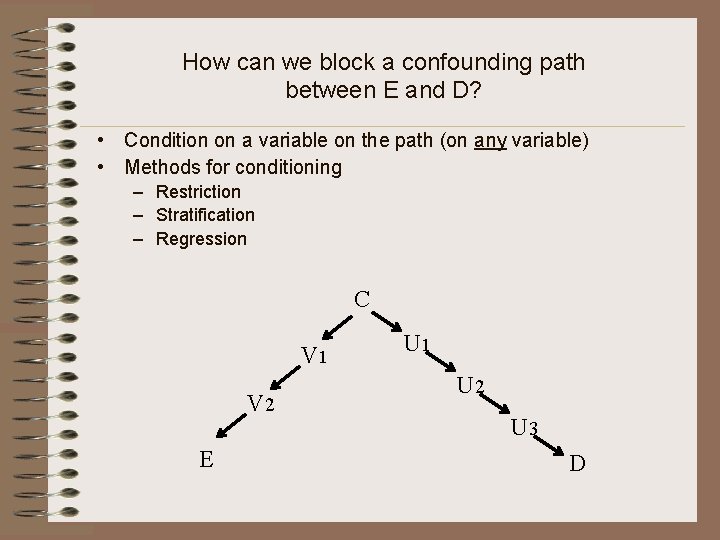
A Causal Diagram Notation and Terms • A confounding path for the effect of E on D: Any path between E and D that meets the following criteria: – The arrow next to E points to E – There are no colliders on the path C V 1 V 2 E U 1 U 2 U 3 D In short: a path showing a common cause of E and D
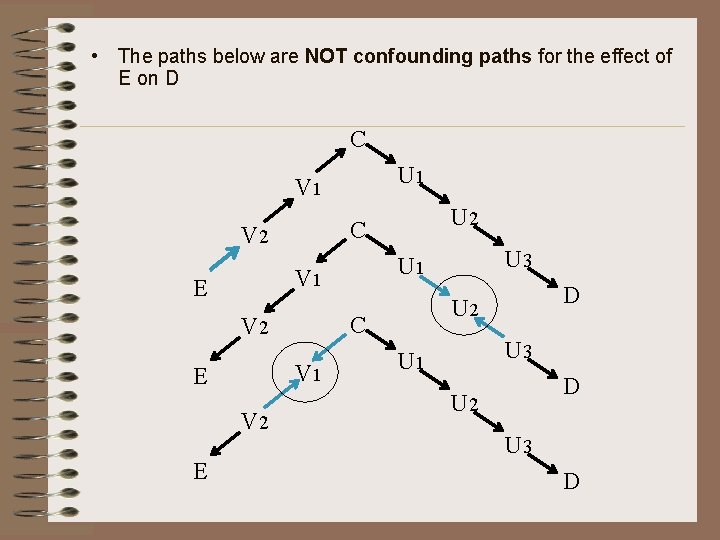
• The paths below are NOT confounding paths for the effect of E on D C U 1 V 2 V 1 E V 2 E D U 2 C V 2 U 3 U 1 V 1 E U 2 C U 3 U 1 D U 2 U 3 D
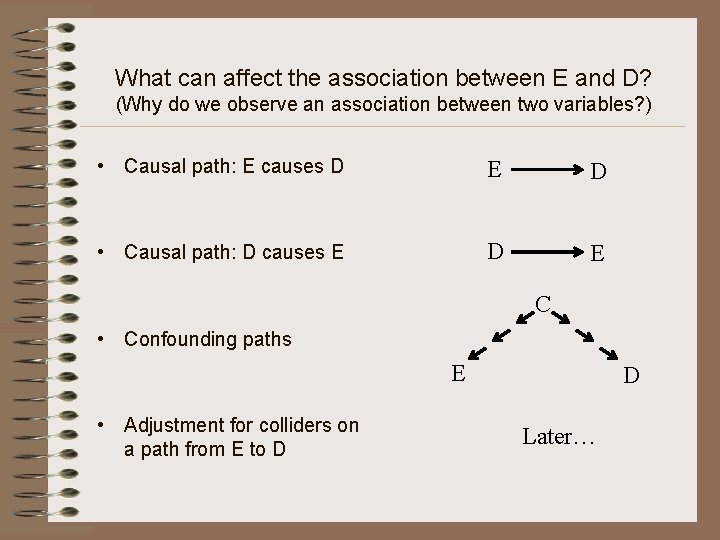
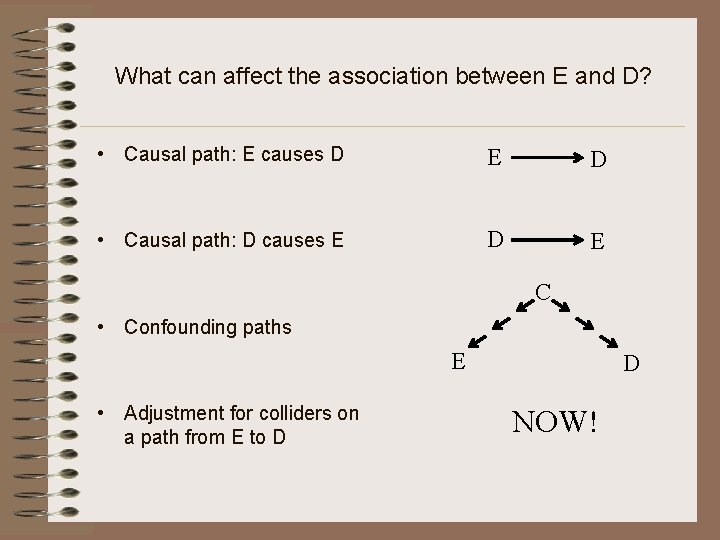
What can affect the association between E and D? (Why do we observe an association between two variables? ) • Causal path: E causes D E D • Causal path: D causes E D E C • Confounding paths E • Adjustment for colliders on a path from E to D D Later…
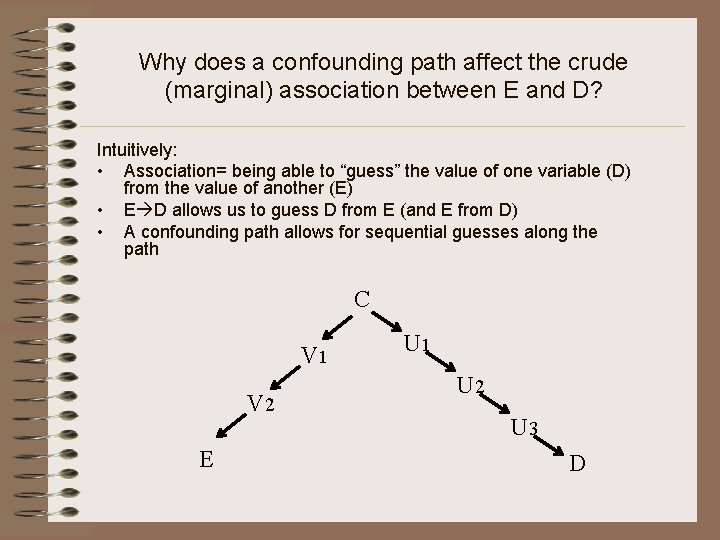
Why does a confounding path affect the crude (marginal) association between E and D? Intuitively: • Association= being able to “guess” the value of one variable (D) from the value of another (E) • E D allows us to guess D from E (and E from D) • A confounding path allows for sequential guesses along the path C V 1 V 2 E U 1 U 2 U 3 D
How can we block a confounding path between E and D? • Condition on a variable on the path (on any variable) • Methods for conditioning – Restriction – Stratification – Regression C V 1 V 2 E U 1 U 2 U 3 D
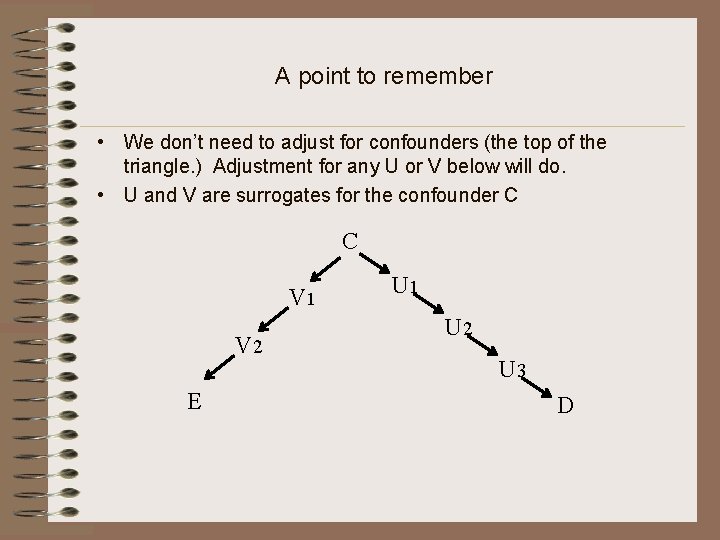
A point to remember • We don’t need to adjust for confounders (the top of the triangle. ) Adjustment for any U or V below will do. • U and V are surrogates for the confounder C C V 1 V 2 E U 1 U 2 U 3 D
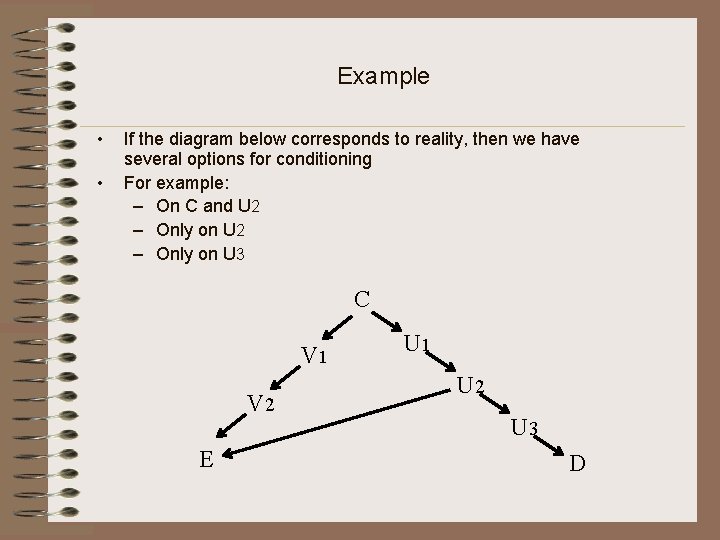
Example • • If the diagram below corresponds to reality, then we have several options for conditioning For example: – On C and U 2 – Only on U 3 C V 1 V 2 E U 1 U 2 U 3 D
What can affect the association between E and D? • Causal path: E causes D E D • Causal path: D causes E D E C • Confounding paths E • Adjustment for colliders on a path from E to D D NOW!
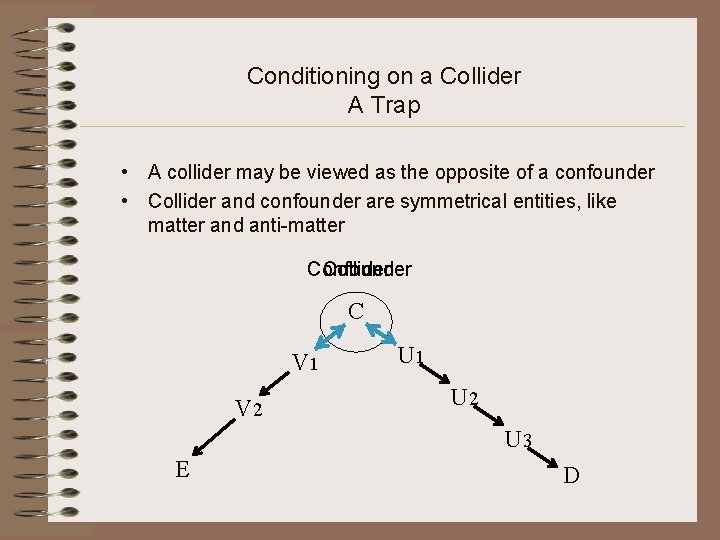
Conditioning on a Collider A Trap • A collider may be viewed as the opposite of a confounder • Collider and confounder are symmetrical entities, like matter and anti-matter Confounder Collider C V 1 V 2 U 1 U 2 U 3 E D
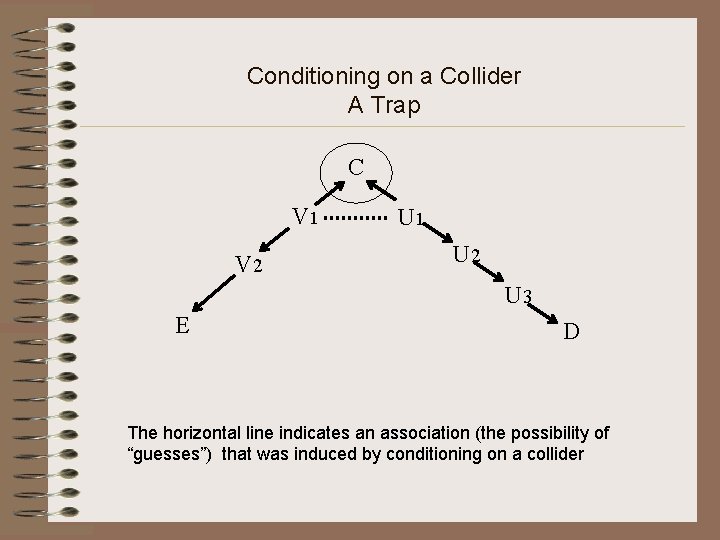
Conditioning on a Collider A Trap • A path from E to D that contains a collider is NOT a confounding path. There is no transfer of “guesses” across a collider. • A path from E to D that contains a collider does NOT generate an association between E and D • Conditioning on the collider, however, will turn that path into a confounding path. Why?
Conditioning on a Collider A Trap C V 1 V 2 U 1 U 2 U 3 E D The horizontal line indicates an association (the possibility of “guesses”) that was induced by conditioning on a collider
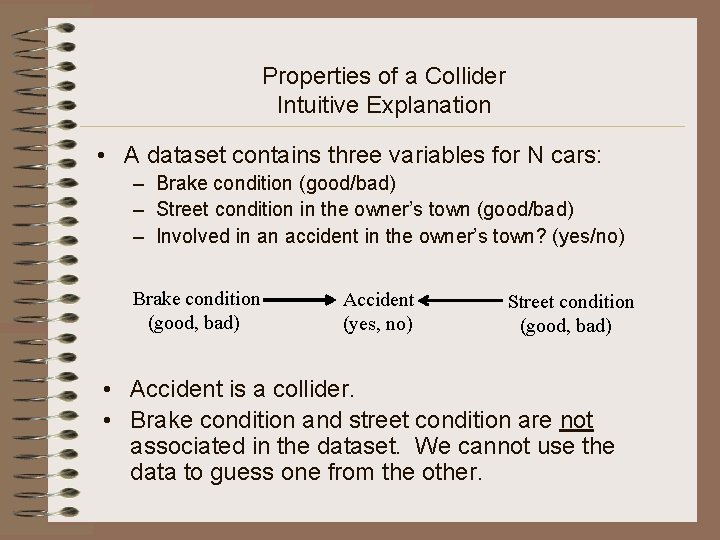
Properties of a Collider Intuitive Explanation • A dataset contains three variables for N cars: – Brake condition (good/bad) – Street condition in the owner’s town (good/bad) – Involved in an accident in the owner’s town? (yes/no) Brake condition (good, bad) Accident (yes, no) Street condition (good, bad) • Accident is a collider. • Brake condition and street condition are not associated in the dataset. We cannot use the data to guess one from the other.
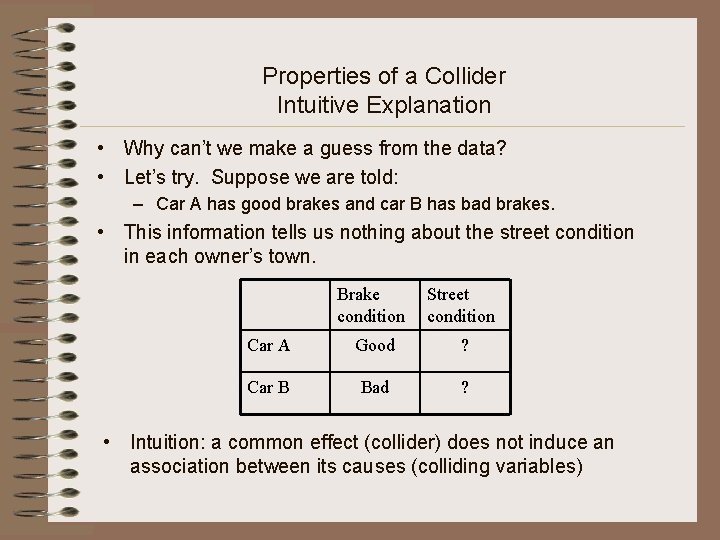
Properties of a Collider Intuitive Explanation • Why can’t we make a guess from the data? • Let’s try. Suppose we are told: – Car A has good brakes and car B has bad brakes. • This information tells us nothing about the street condition in each owner’s town. Brake condition Street condition Car A Good ? Car B Bad ? • Intuition: a common effect (collider) does not induce an association between its causes (colliding variables)
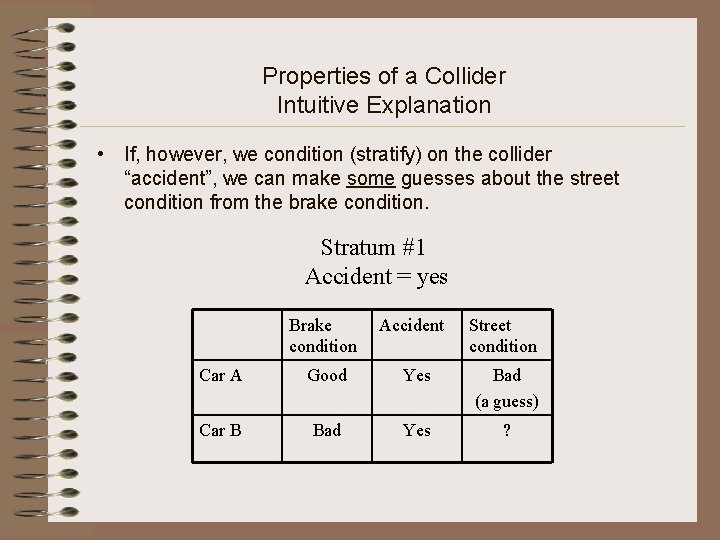
Properties of a Collider Intuitive Explanation • If, however, we condition (stratify) on the collider “accident”, we can make some guesses about the street condition from the brake condition. Stratum #1 Accident = yes Brake condition Accident Street condition Car A Good Yes Bad (a guess) Car B Bad Yes ?
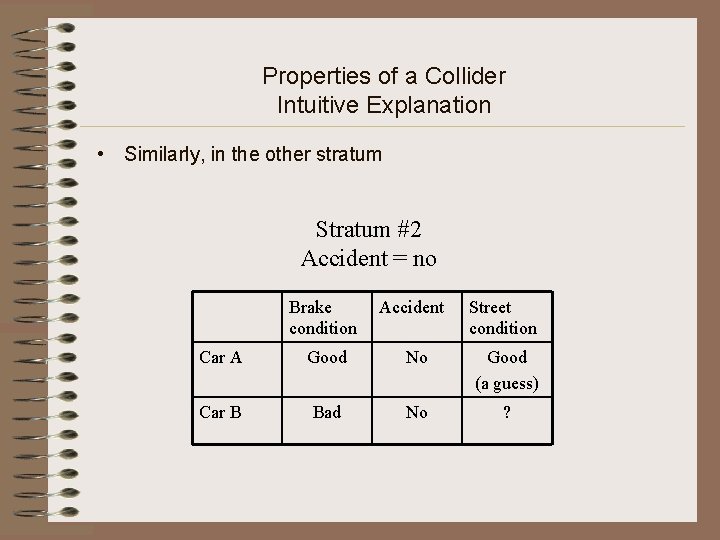
Properties of a Collider Intuitive Explanation • Similarly, in the other stratum Stratum #2 Accident = no Brake condition Accident Street condition Car A Good No Good (a guess) Car B Bad No ?
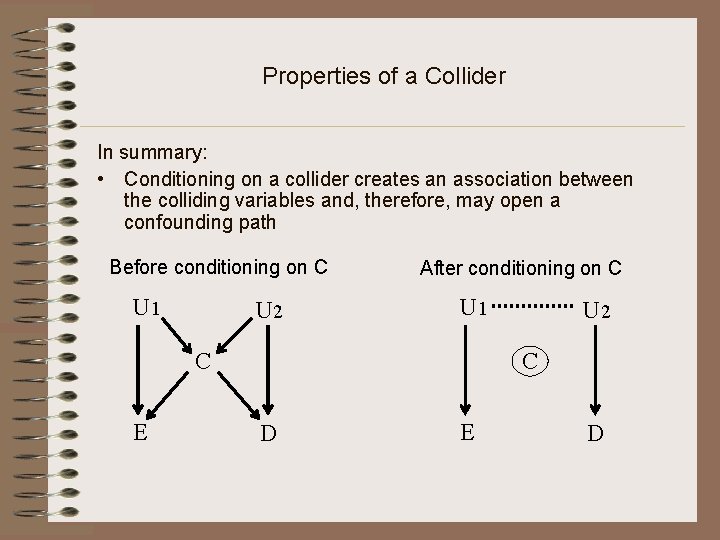
Properties of a Collider In summary: • Conditioning on a collider creates an association between the colliding variables and, therefore, may open a confounding path Before conditioning on C U 1 U 2 After conditioning on C U 1 C E U 2 C D E D
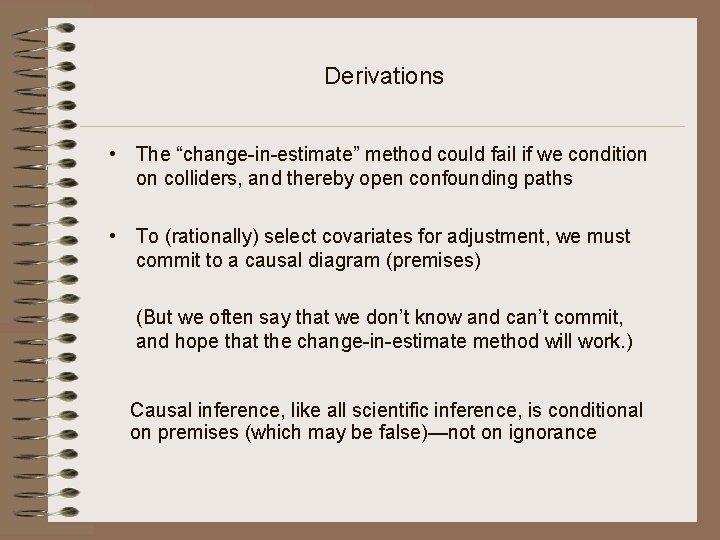
Derivations • The “change-in-estimate” method could fail if we condition on colliders, and thereby open confounding paths • To (rationally) select covariates for adjustment, we must commit to a causal diagram (premises) (But we often say that we don’t know and can’t commit, and hope that the change-in-estimate method will work. ) Causal inference, like all scientific inference, is conditional on premises (which may be false)—not on ignorance
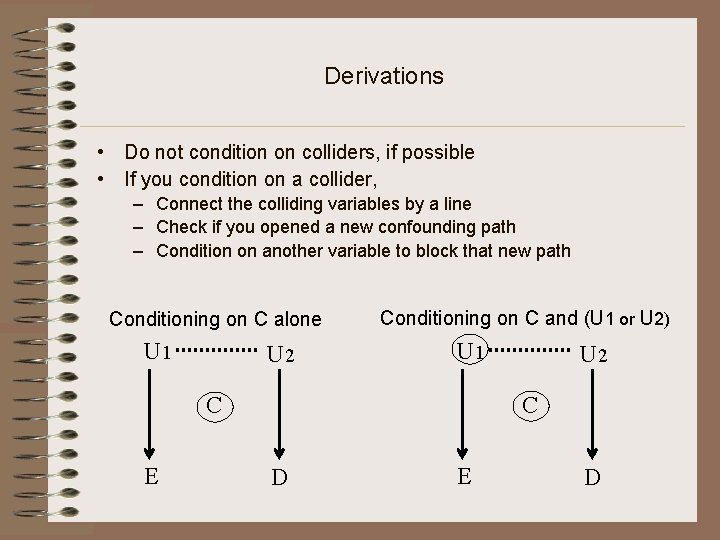
Derivations • Do not condition on colliders, if possible • If you condition on a collider, – Connect the colliding variables by a line – Check if you opened a new confounding path – Condition on another variable to block that new path Conditioning on C alone U 1 U 2 Conditioning on C and (U 1 or U 2) U 1 C E U 2 C D E D
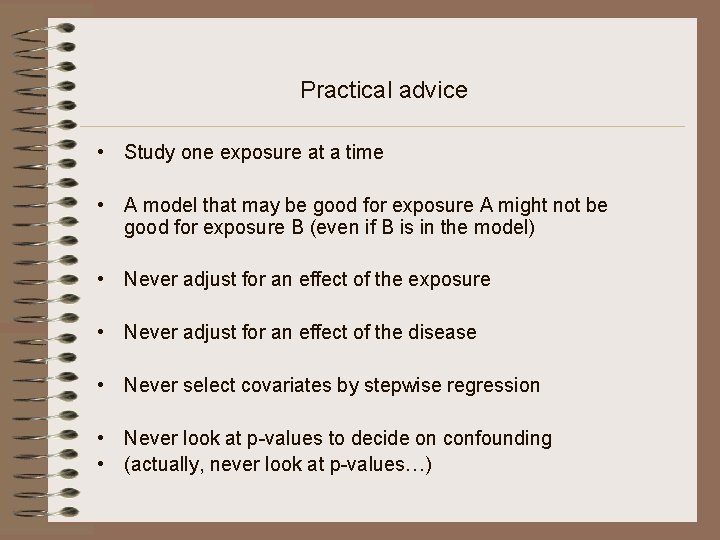
Practical advice • Study one exposure at a time • A model that may be good for exposure A might not be good for exposure B (even if B is in the model) • Never adjust for an effect of the exposure • Never adjust for an effect of the disease • Never select covariates by stepwise regression • Never look at p-values to decide on confounding • (actually, never look at p-values…)
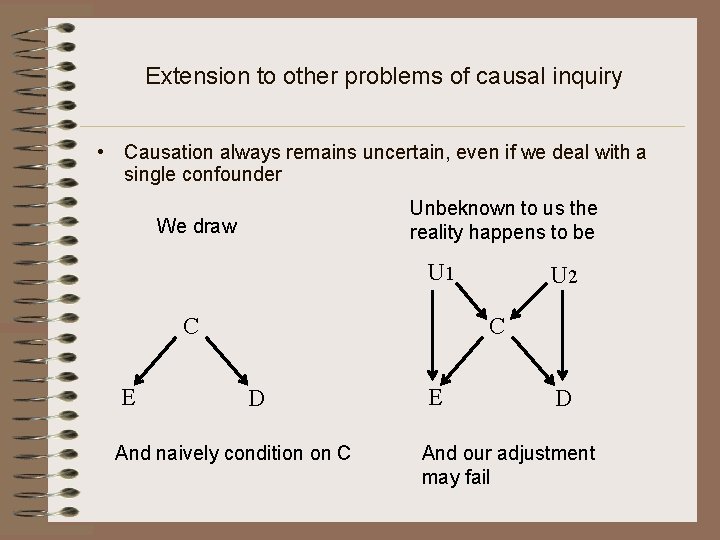
Extension to other problems of causal inquiry • Causation always remains uncertain, even if we deal with a single confounder Unbeknown to us the reality happens to be We draw U 1 C E U 2 C D And naively condition on C E D And our adjustment may fail
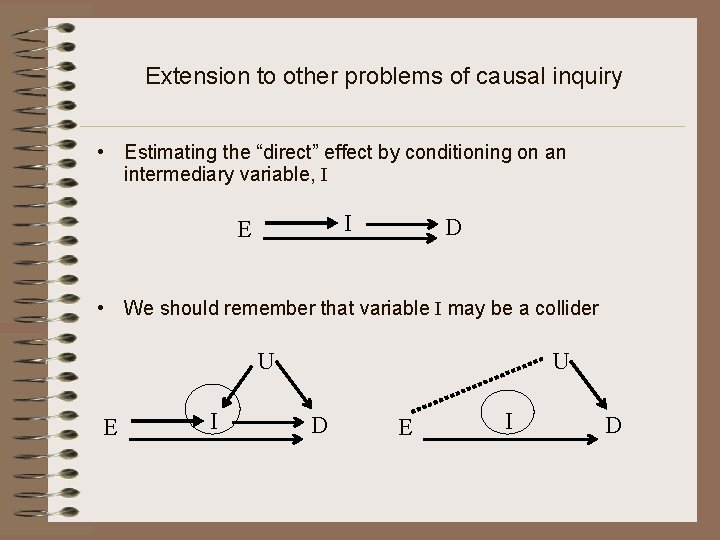
Extension to other problems of causal inquiry • Estimating the “direct” effect by conditioning on an intermediary variable, I I E D • We should remember that variable I may be a collider U E I U D E I D
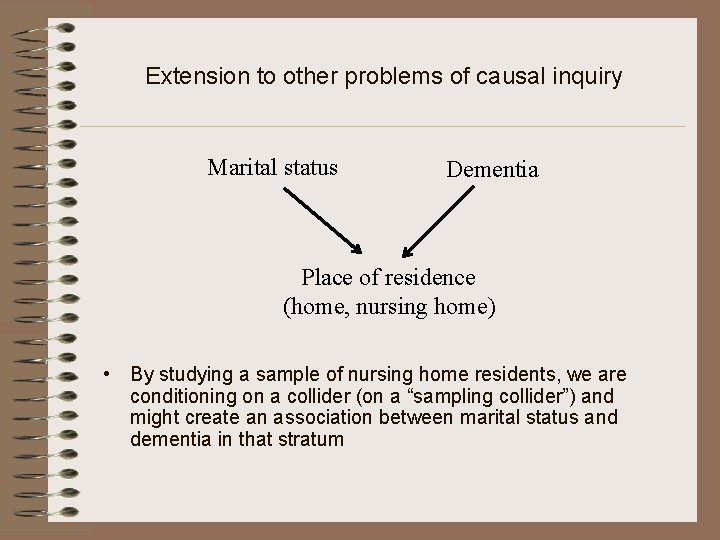
Extension to other problems of causal inquiry • Causal diagrams explain the mechanism of selection bias • Example: What happens if we estimate the effect of marital status on dementia in a sample of nursing home residents? Assume: no effect both variables affect “place of residence” (home, or nursing home)
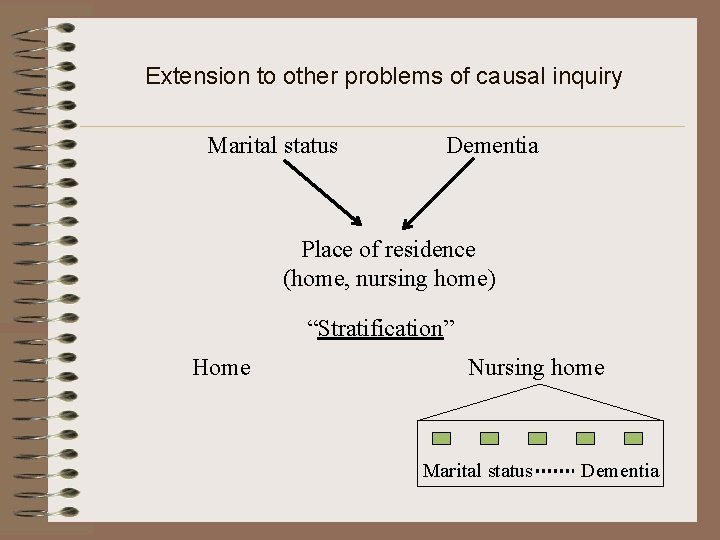
Extension to other problems of causal inquiry Marital status Dementia Place of residence (home, nursing home) • By studying a sample of nursing home residents, we are conditioning on a collider (on a “sampling collider”) and might create an association between marital status and dementia in that stratum
Extension to other problems of causal inquiry Marital status Dementia Place of residence (home, nursing home) “Stratification” Home Nursing home Marital status Dementia
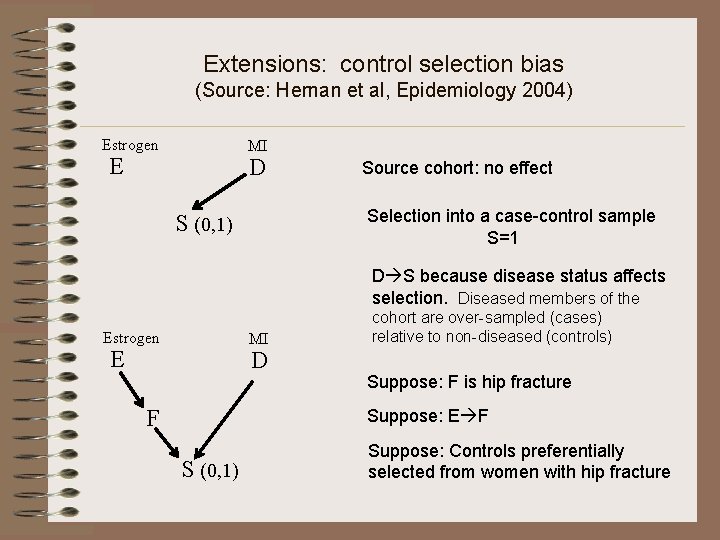
Extensions: control selection bias (Source: Hernan et al, Epidemiology 2004) Estrogen MI E D Source cohort: no effect Selection into a case-control sample S=1 S (0, 1) D S because disease status affects selection. Diseased members of the Estrogen MI E D F cohort are over-sampled (cases) relative to non-diseased (controls) Suppose: F is hip fracture Suppose: E F S (0, 1) Suppose: Controls preferentially selected from women with hip fracture
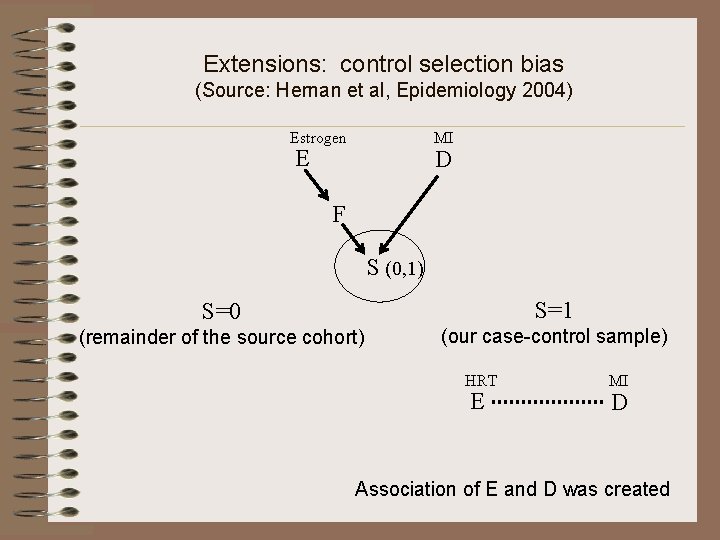
Extensions: control selection bias (Source: Hernan et al, Epidemiology 2004) Estrogen MI E D F S (0, 1) S=0 S=1 (remainder of the source cohort) (our case-control sample) HRT E MI D Association of E and D was created
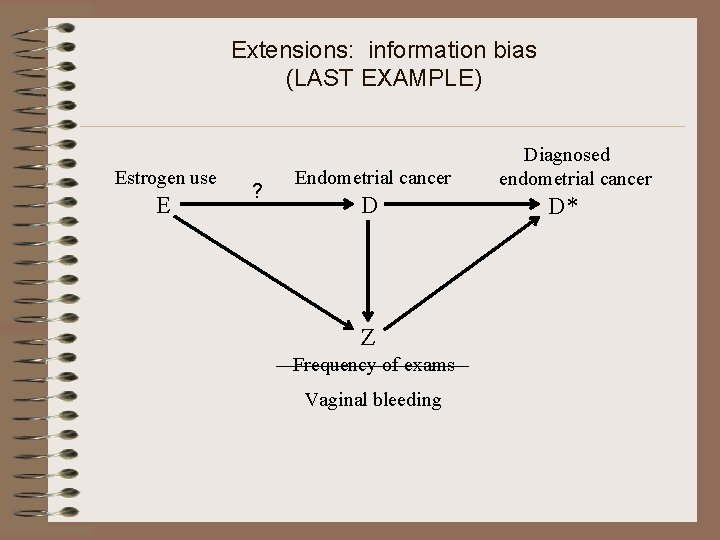
Extensions: information bias (LAST EXAMPLE) Estrogen use E ? Endometrial cancer D Z Frequency of exams Vaginal bleeding Diagnosed endometrial cancer D*
Summary Points • The “change-in-estimate” method could fail if we condition on colliders, and thereby open confounding paths • The theory of causal diagrams extends the idea of a confounder to the multi-confounder case • Unification of confounding bias, selection bias, and information bias under a single theoretical framework
• • “Back-door algorithm” Sufficient set for adjustment Minimally sufficient set Differential losses to follow-up Time-dependent confounders Interpretation of hazard ratios Conditioning on a common effect always induced an association between its causes, but this association could be restricted to some levels of the common effect
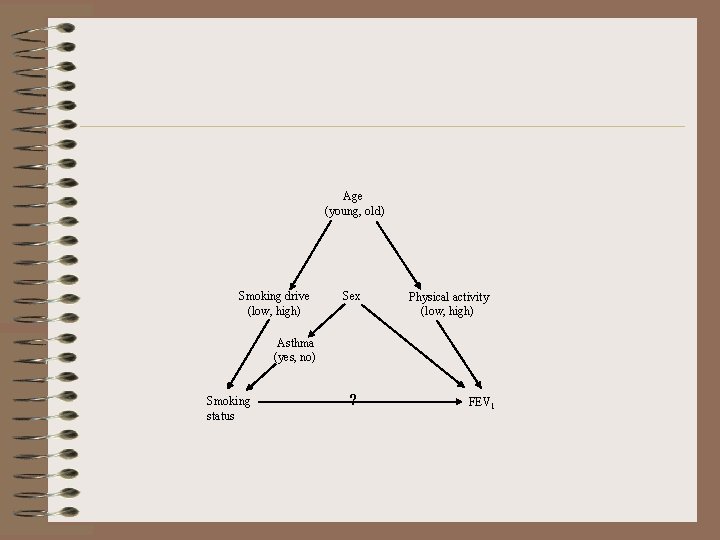
Age (young, old) Smoking drive (low, high) Sex Physical activity (low, high) Asthma (yes, no) Smoking status ? FEV 1
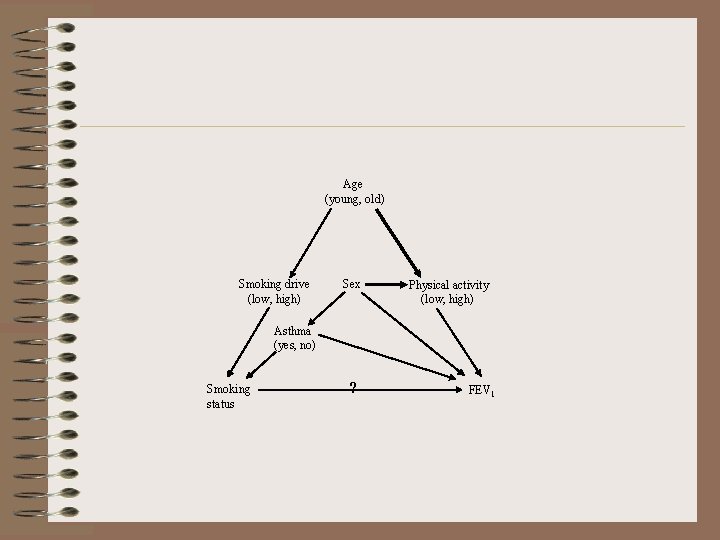
Age (young, old) Smoking drive (low, high) Sex Physical activity (low, high) Asthma (yes, no) Smoking status ? FEV 1
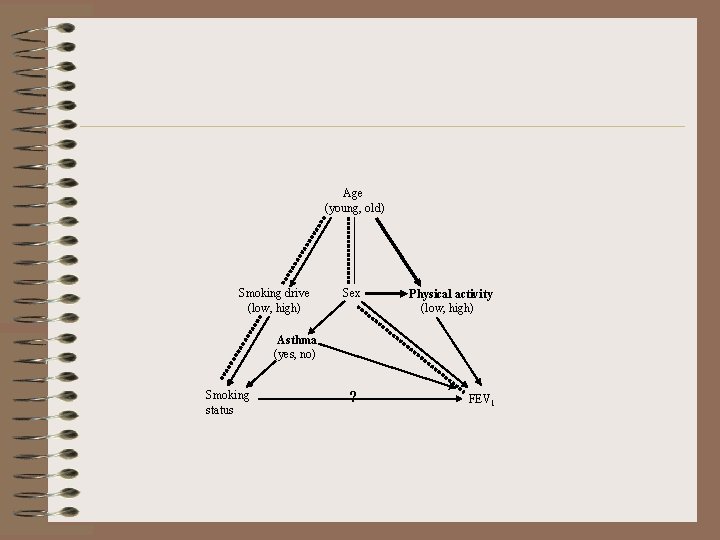
Age (young, old) Smoking drive (low, high) Sex Physical activity (low, high) Asthma (yes, no) Smoking status ? FEV 1
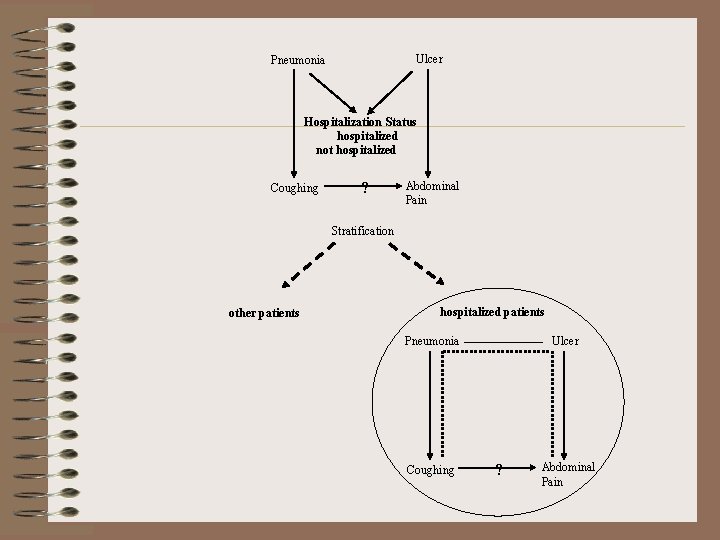
Ulcer Pneumonia Hospitalization Status hospitalized not hospitalized Coughing ? Abdominal Pain Stratification other patients hospitalized patients Ulcer Pneumonia Coughing ? Abdominal Pain
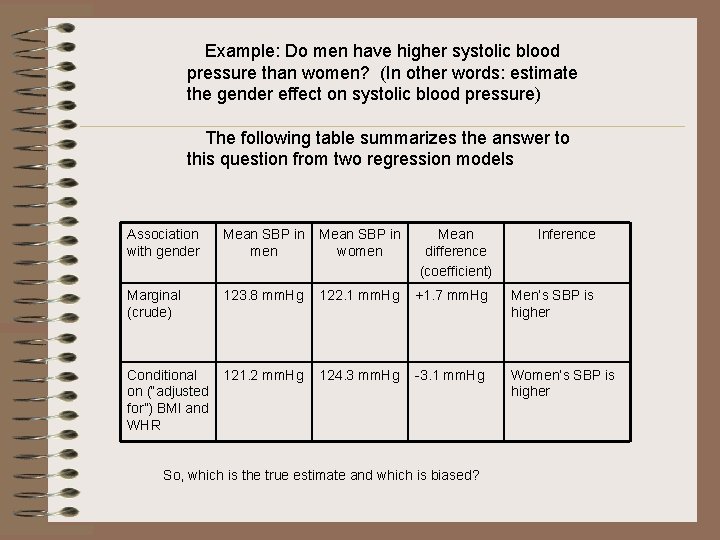
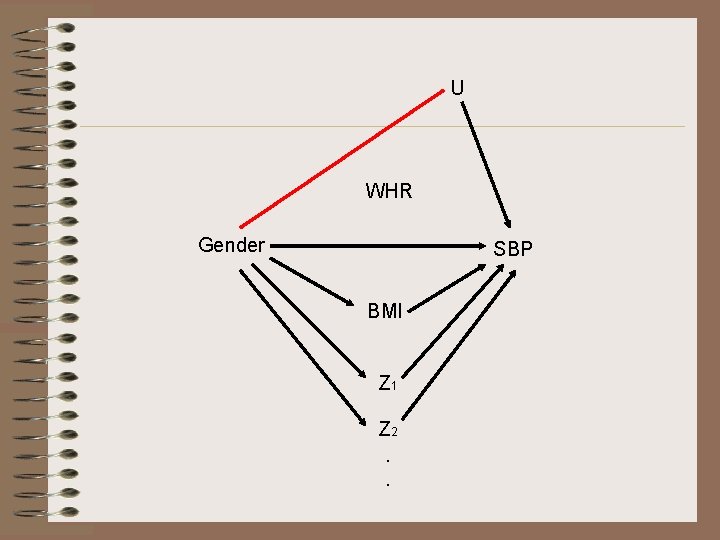
Example: Do men have higher systolic blood pressure than women? (In other words: estimate the gender effect on systolic blood pressure) The following table summarizes the answer to this question from two regression models Association with gender Mean SBP in men Mean SBP in women Mean difference (coefficient) Marginal (crude) 123. 8 mm. Hg 122. 1 mm. Hg +1. 7 mm. Hg Men’s SBP is higher Conditional on (“adjusted for”) BMI and WHR 121. 2 mm. Hg 124. 3 mm. Hg -3. 1 mm. Hg Women’s SBP is higher So, which is the true estimate and which is biased? Inference
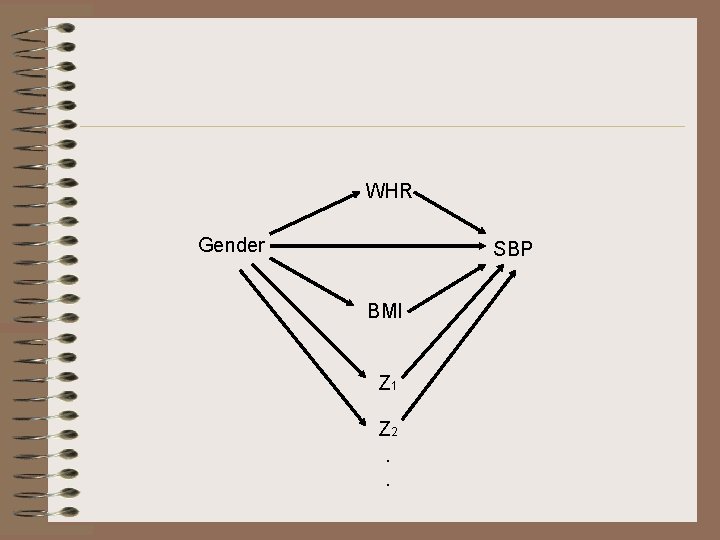
WHR Gender SBP BMI Z 1 Z 2. .
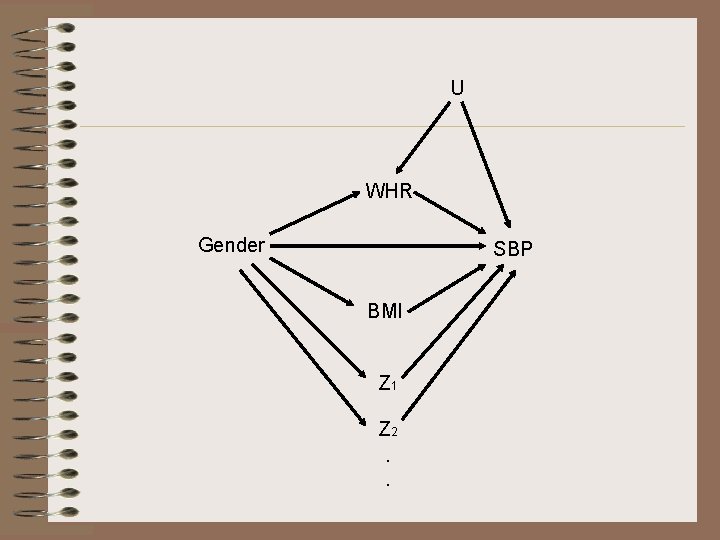
U WHR Gender SBP BMI Z 1 Z 2. .
U WHR Gender SBP BMI Z 1 Z 2. .