
Epidemiologic transition global burden of disease and emergence
Epidemiologic transition, global burden of disease, and emergence of NCDs Pascal Bovet, MD, MPH Institute of Social and Preventive Medicine (IUMSP), University of Lausanne 9 th WHO-IUMSP International Seminar on the Public Health Aspects of NCDs Lausanne, 4 - 8 May 2015
• The health transition: predicting disease in populations along socio economic development • The Global Burden of Disease: provides comparable information on disease burden, burden of diseases attributable to risk factors, and estimation of cost-effectiveness of interventions • Limitations of the models
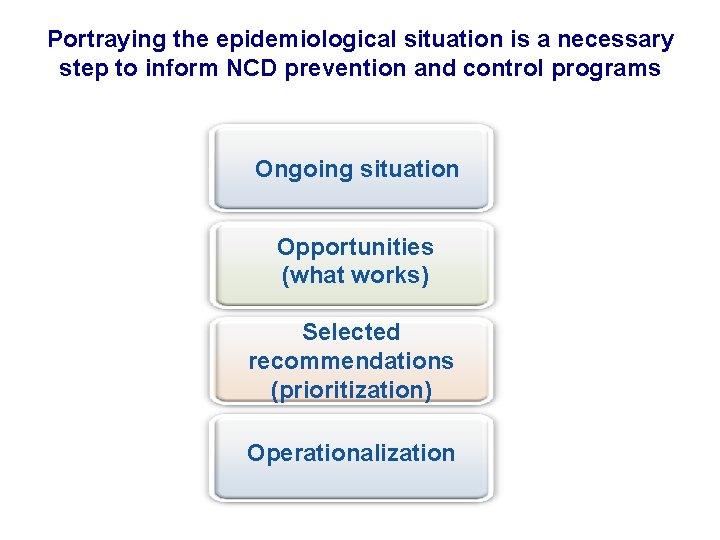
Portraying the epidemiological situation is a necessary step to inform NCD prevention and control programs Ongoing situation Opportunities (what works) Selected recommendations (prioritization) Operationalization
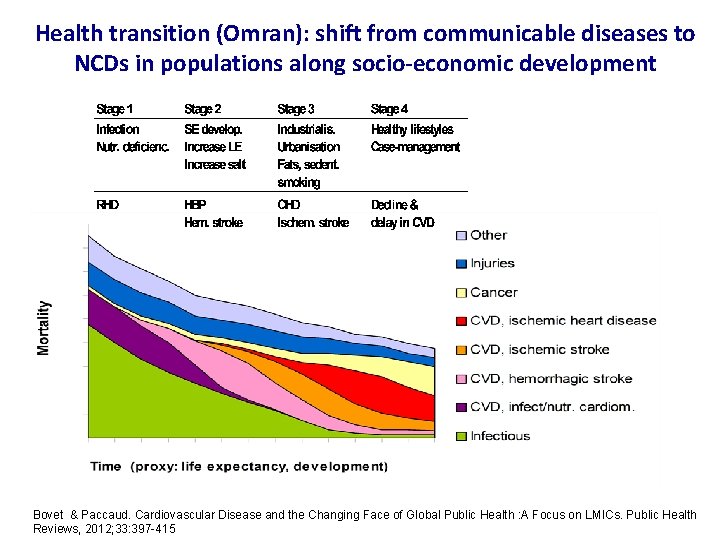
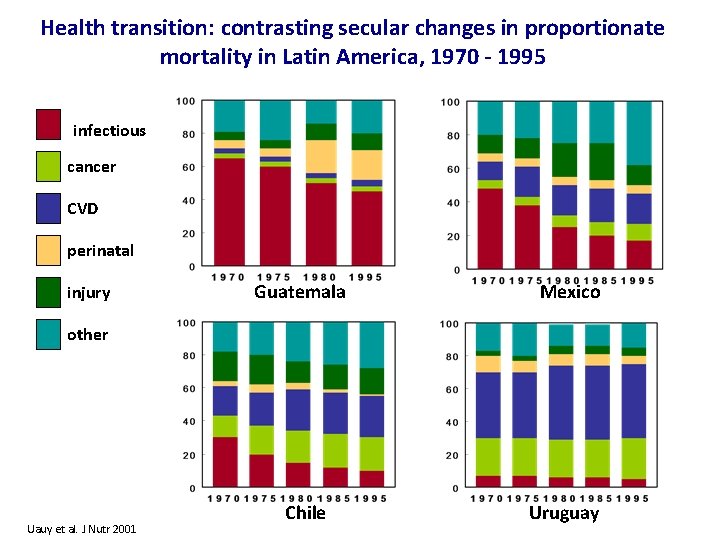
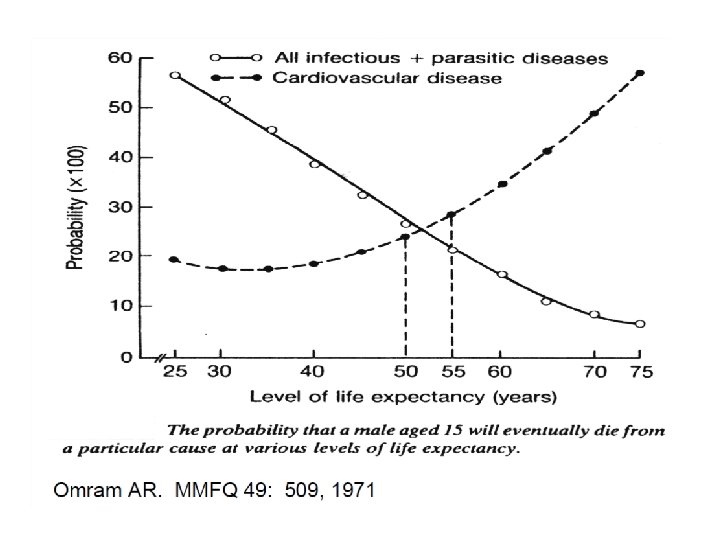
Health transition (Omran): shift from communicable diseases to NCDs in populations along socio-economic development Bovet & Paccaud. Cardiovascular Disease and the Changing Face of Global Public Health : A Focus on LMICs. Public Health Reviews, 2012; 33: 397 -415
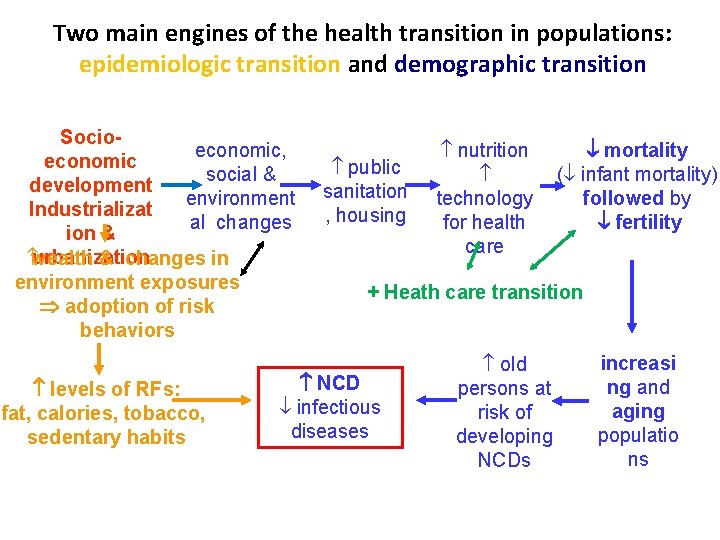
Two main engines of the health transition in populations: epidemiologic transition and demographic transition Socioeconomic, economic social & development environment Industrializat al changes ion & urbanization wealth & changes in environment exposures adoption of risk behaviors levels of RFs: fat, calories, tobacco, sedentary habits public sanitation , housing nutrition mortality ( infant mortality) technology followed by for health fertility care + Heath care transition NCD infectious diseases old persons at risk of developing NCDs increasi ng and aging populatio ns
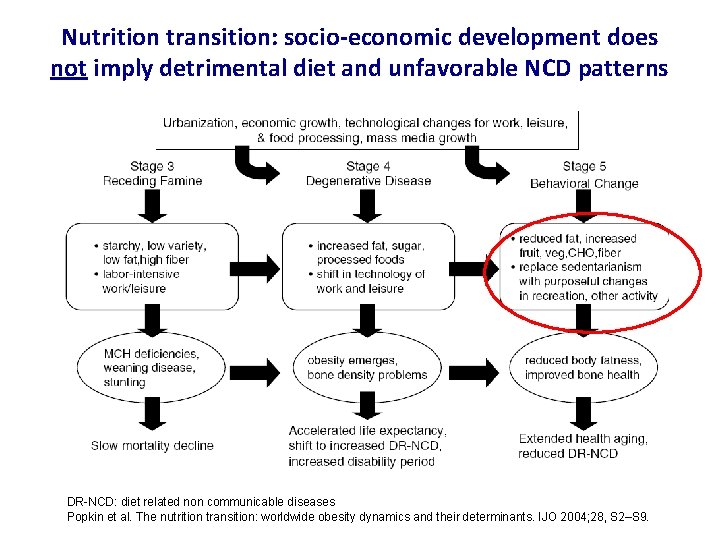
Nutrition transition: socio-economic development does not imply detrimental diet and unfavorable NCD patterns DR-NCD: diet related non communicable diseases Popkin et al. The nutrition transition: worldwide obesity dynamics and their determinants. IJO 2004; 28, S 2–S 9.
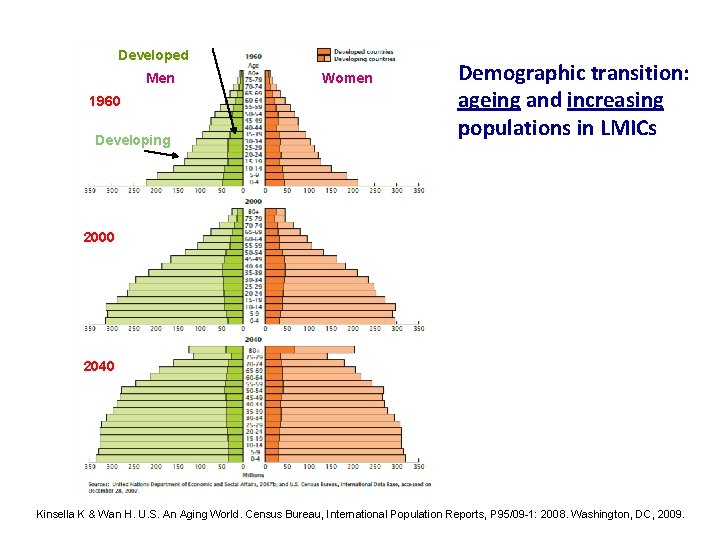
Developed Men 1960 Developing Women Demographic transition: ageing and increasing populations in LMICs 2000 2040 Kinsella K & Wan H. U. S. An Aging World. Census Bureau, International Population Reports, P 95/09 -1: 2008. Washington, DC, 2009.
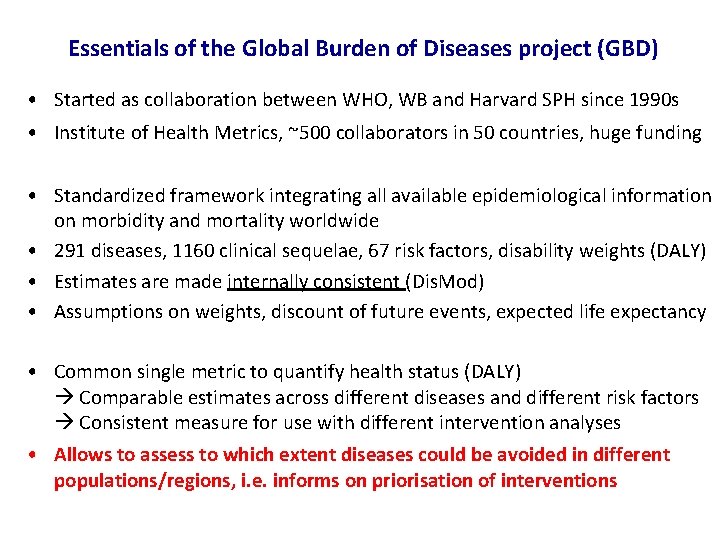
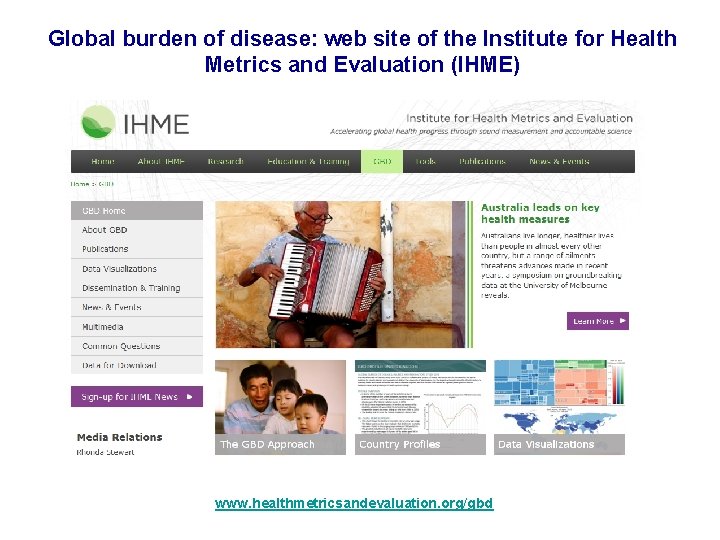
Essentials of the Global Burden of Diseases project (GBD) • Started as collaboration between WHO, WB and Harvard SPH since 1990 s • Institute of Health Metrics, ~500 collaborators in 50 countries, huge funding • Standardized framework integrating all available epidemiological information on morbidity and mortality worldwide • 291 diseases, 1160 clinical sequelae, 67 risk factors, disability weights (DALY) • Estimates are made internally consistent (Dis. Mod) • Assumptions on weights, discount of future events, expected life expectancy • Common single metric to quantify health status (DALY) Comparable estimates across different diseases and different risk factors Consistent measure for use with different intervention analyses • Allows to assess to which extent diseases could be avoided in different populations/regions, i. e. informs on priorisation of interventions
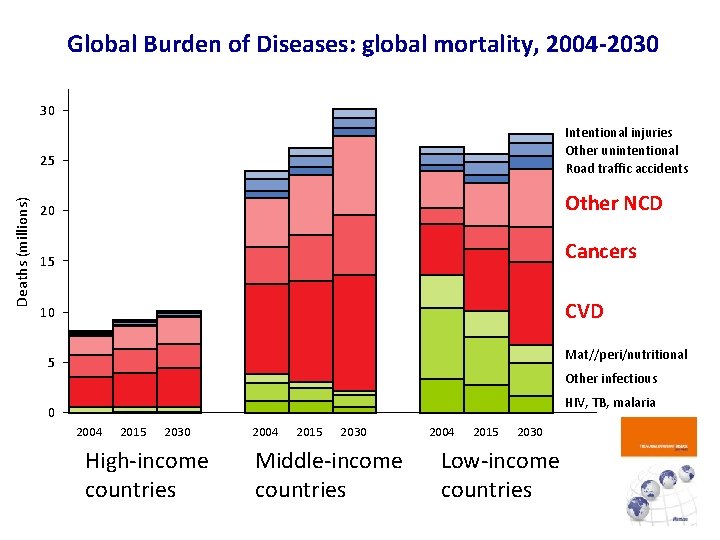
Global Burden of Diseases: global mortality, 2004 -2030 30 Intentional injuries Other unintentional Road traffic accidents Deaths (millions) 25 20 Other NCD 15 Cancers 10 CVD Mat//peri/nutritional 5 Other infectious HIV, TB, malaria 0 2004 2015 2030 High-income countries 2004 2015 2030 Middle-income countries 2004 2015 2030 Low-income countries
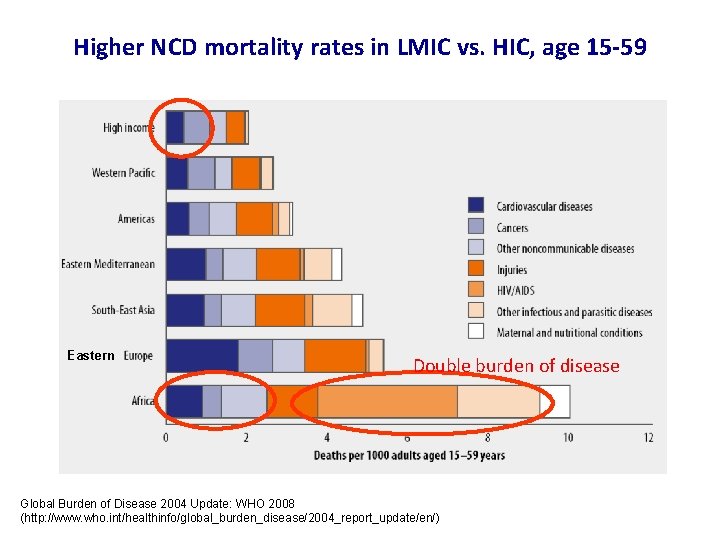
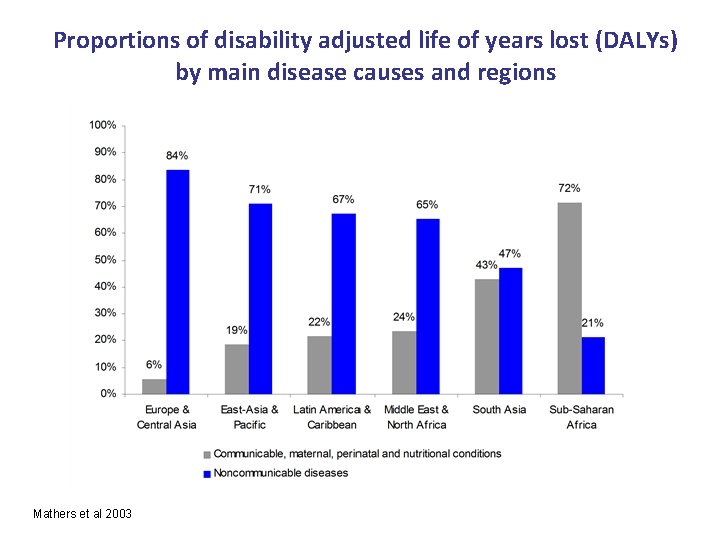
Higher NCD mortality rates in LMIC vs. HIC, age 15 -59 Eastern Double burden of disease Global Burden of Disease 2004 Update: WHO 2008 (http: //www. who. int/healthinfo/global_burden_disease/2004_report_update/en/)
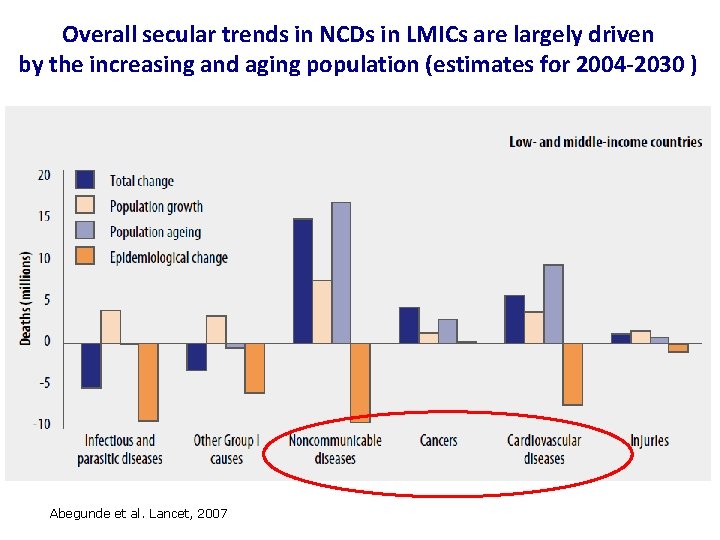
Overall secular trends in NCDs in LMICs are largely driven by the increasing and aging population (estimates for 2004 -2030 ) Abegunde et al. Lancet, 2007
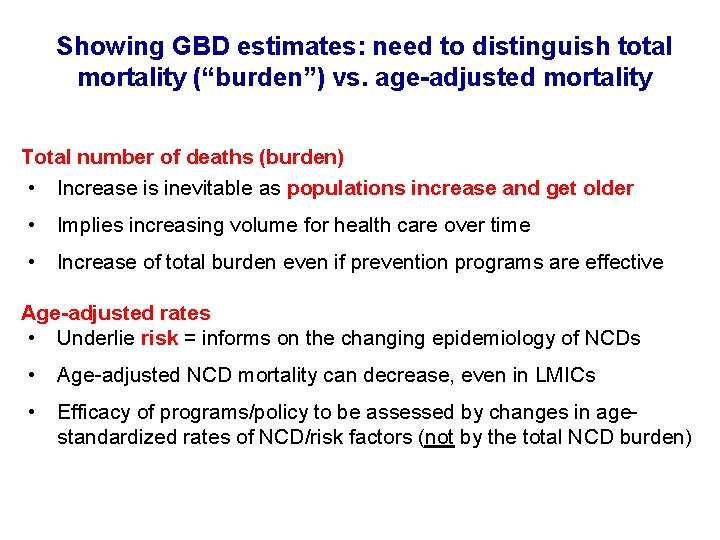
Showing GBD estimates: need to distinguish total mortality (“burden”) vs. age-adjusted mortality Total number of deaths (burden) • Increase is inevitable as populations increase and get older • Implies increasing volume for health care over time • Increase of total burden even if prevention programs are effective Age-adjusted rates • Underlie risk = informs on the changing epidemiology of NCDs • Age-adjusted NCD mortality can decrease, even in LMICs • Efficacy of programs/policy to be assessed by changes in agestandardized rates of NCD/risk factors (not by the total NCD burden)
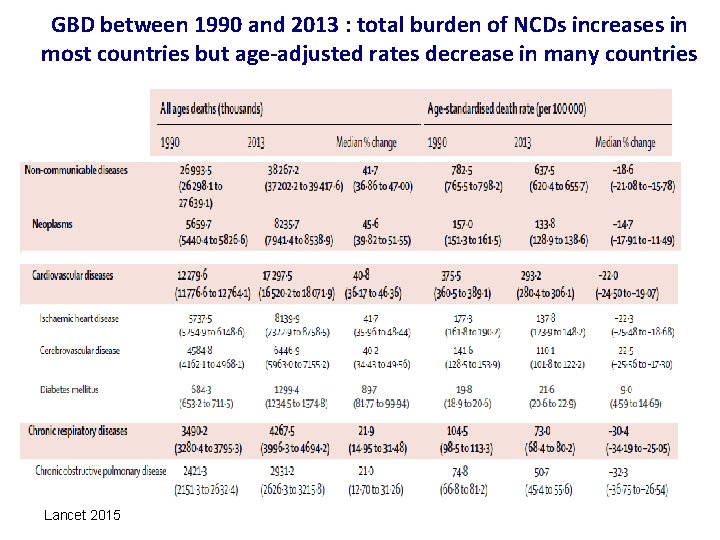
GBD between 1990 and 2013 : total burden of NCDs increases in most countries but age-adjusted rates decrease in many countries Lancet 2015
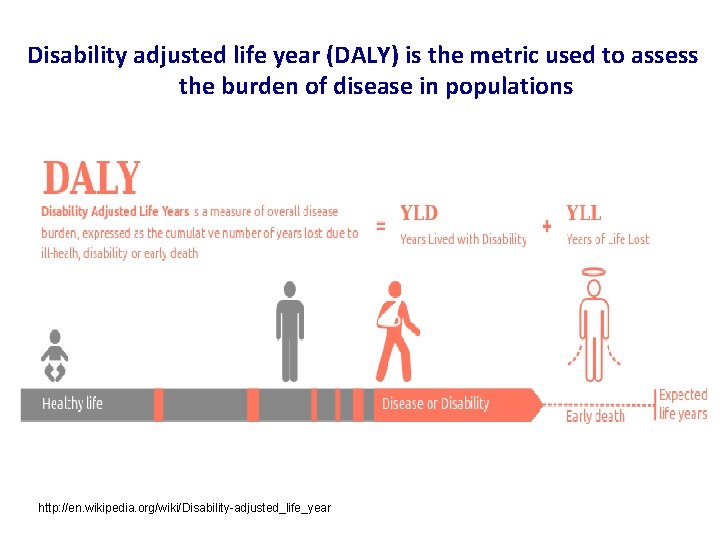
Disability adjusted life year (DALY) is the metric used to assess the burden of disease in populations http: //en. wikipedia. org/wiki/Disability-adjusted_life_year
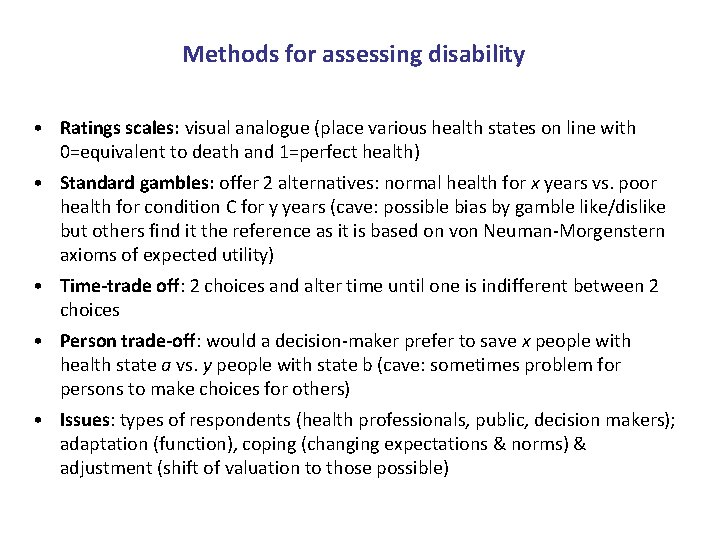
Methods for assessing disability • Ratings scales: visual analogue (place various health states on line with 0=equivalent to death and 1=perfect health) • Standard gambles: offer 2 alternatives: normal health for x years vs. poor health for condition C for y years (cave: possible bias by gamble like/dislike but others find it the reference as it is based on von Neuman-Morgenstern axioms of expected utility) • Time-trade off: 2 choices and alter time until one is indifferent between 2 choices • Person trade-off: would a decision-maker prefer to save x people with health state a vs. y people with state b (cave: sometimes problem for persons to make choices for others) • Issues: types of respondents (health professionals, public, decision makers); adaptation (function), coping (changing expectations & norms) & adjustment (shift of valuation to those possible)
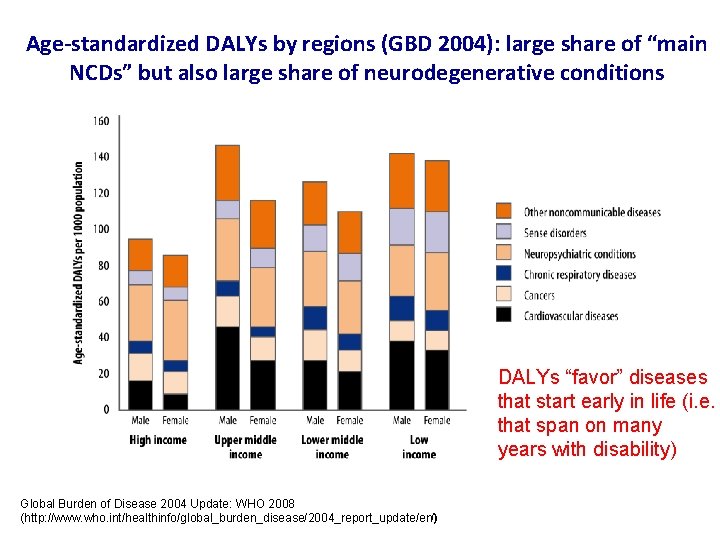
Age-standardized DALYs by regions (GBD 2004): large share of “main NCDs” but also large share of neurodegenerative conditions DALYs “favor” diseases that start early in life (i. e. that span on many years with disability) Global Burden of Disease 2004 Update: WHO 2008 (http: //www. who. int/healthinfo/global_burden_disease/2004_report_update/en/)
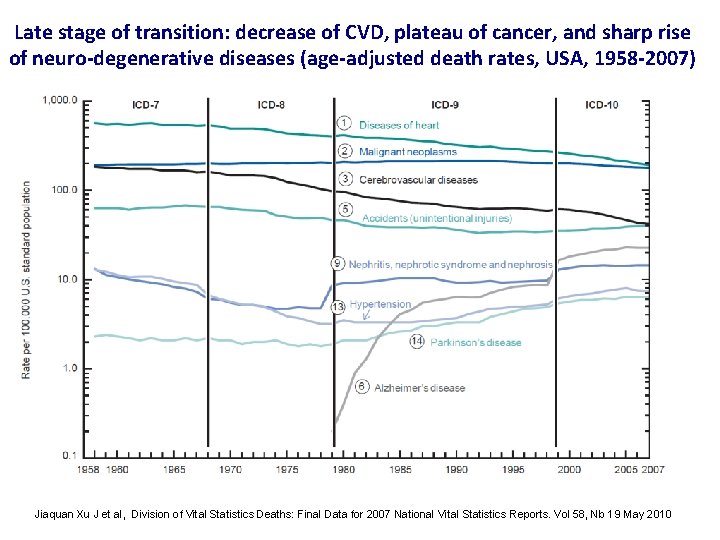
Late stage of transition: decrease of CVD, plateau of cancer, and sharp rise of neuro-degenerative diseases (age-adjusted death rates, USA, 1958 -2007) Jiaquan Xu J et al, Division of Vital Statistics Deaths: Final Data for 2007 National Vital Statistics Reports. Vol 58, Nb 19 May 2010
A most important contribution of GBD: Relating disease burden to risks • An alternative way of looking at ill health is to consider risks for disease, rather than diseases themselves • A single risk factor may underlie several diseases; e. g. tobacco for CVD, cancer and prenatal conditions • Information on risk is crucial to inform which health interventions could curb diseases (while information on diseases does not tell explicitly what to do to tackle these diseases) • “Risk factor levels of today are diseases of tomorrow”
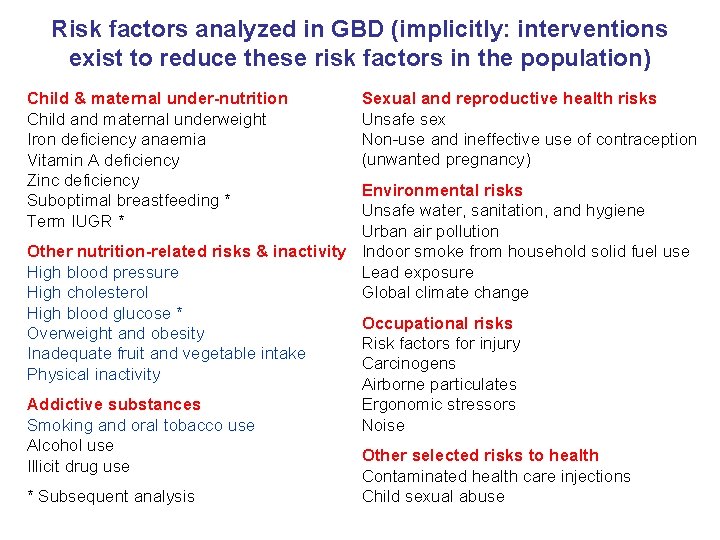
Risk factors analyzed in GBD (implicitly: interventions exist to reduce these risk factors in the population) Child & maternal under-nutrition Child and maternal underweight Iron deficiency anaemia Vitamin A deficiency Zinc deficiency Suboptimal breastfeeding * Term IUGR * Sexual and reproductive health risks Unsafe sex Non-use and ineffective use of contraception (unwanted pregnancy) Environmental risks Unsafe water, sanitation, and hygiene Urban air pollution Other nutrition-related risks & inactivity Indoor smoke from household solid fuel use Lead exposure High blood pressure Global climate change High cholesterol High blood glucose * Occupational risks Overweight and obesity Risk factors for injury Inadequate fruit and vegetable intake Carcinogens Physical inactivity Airborne particulates Ergonomic stressors Addictive substances Noise Smoking and oral tobacco use Alcohol use Other selected risks to health Illicit drug use Contaminated health care injections Child sexual abuse * Subsequent analysis
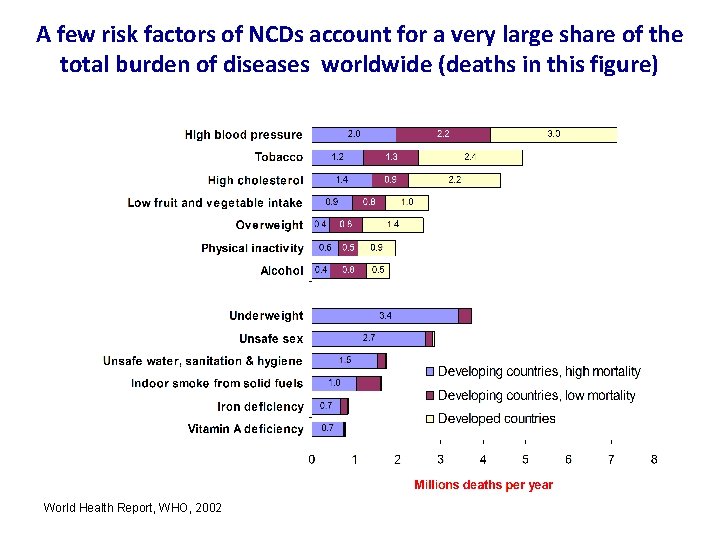
A few risk factors of NCDs account for a very large share of the total burden of diseases worldwide (deaths in this figure) World Health Report, WHO, 2002
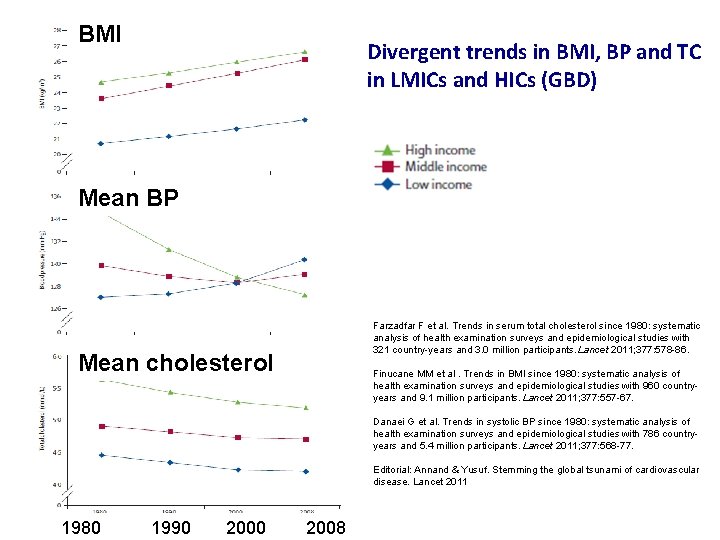
BMI Divergent trends in BMI, BP and TC in LMICs and HICs (GBD) Mean BP Mean cholesterol Farzadfar F et al. Trends in serum total cholesterol since 1980: systematic analysis of health examination surveys and epidemiological studies with 321 country-years and 3. 0 million participants. Lancet 2011; 377: 578 -86. Finucane MM et al. Trends in BMI since 1980: systematic analysis of health examination surveys and epidemiological studies with 960 countryyears and 9. 1 million participants. Lancet 2011; 377: 557 -67. Danaei G et al. Trends in systolic BP since 1980: systematic analysis of health examination surveys and epidemiological studies with 786 countryyears and 5. 4 million participants. Lancet 2011; 377: 568 -77. Editorial: Annand & Yusuf. Stemming the global tsunami of cardiovascular disease. Lancet 2011 1980 1990 2008
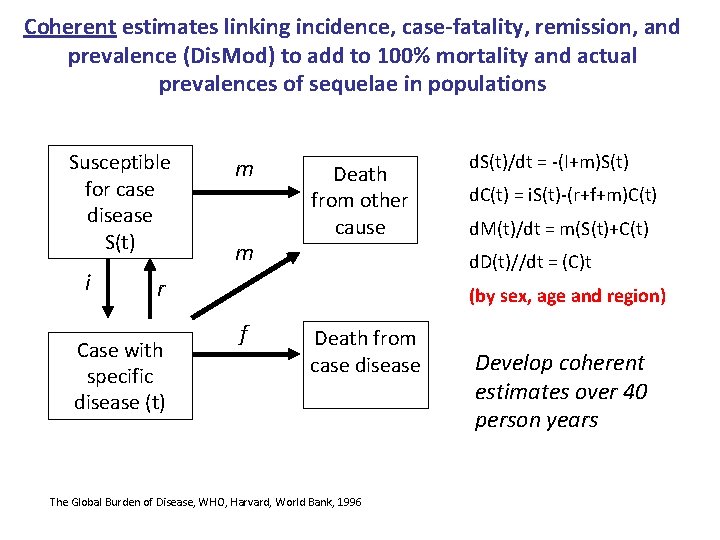
Coherent estimates linking incidence, case-fatality, remission, and prevalence (Dis. Mod) to add to 100% mortality and actual prevalences of sequelae in populations Susceptible for case disease S(t) i m m Death from other cause d. C(t) = i. S(t)-(r+f+m)C(t) d. M(t)/dt = m(S(t)+C(t) d. D(t)//dt = (C)t r Case with specific disease (t) d. S(t)/dt = -(I+m)S(t) (by sex, age and region) f Death from case disease The Global Burden of Disease, WHO, Harvard, World Bank, 1996 Develop coherent estimates over 40 person years
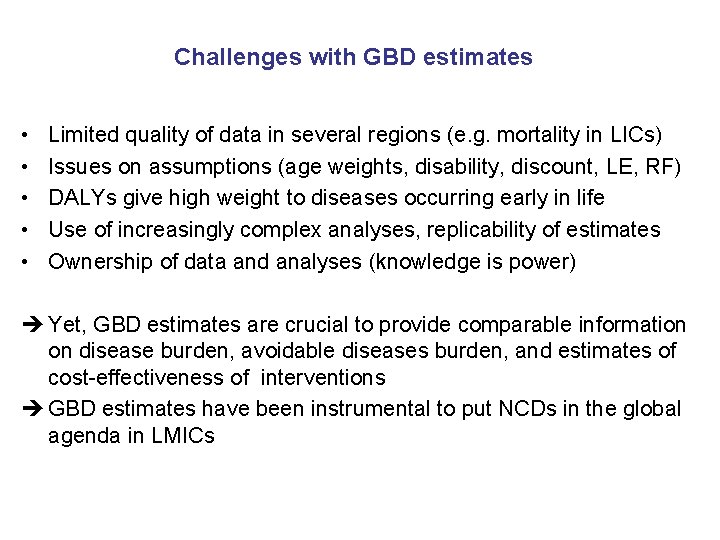
Challenges with GBD estimates • • • Limited quality of data in several regions (e. g. mortality in LICs) Issues on assumptions (age weights, disability, discount, LE, RF) DALYs give high weight to diseases occurring early in life Use of increasingly complex analyses, replicability of estimates Ownership of data and analyses (knowledge is power) è Yet, GBD estimates are crucial to provide comparable information on disease burden, avoidable diseases burden, and estimates of cost-effectiveness of interventions è GBD estimates have been instrumental to put NCDs in the global agenda in LMICs
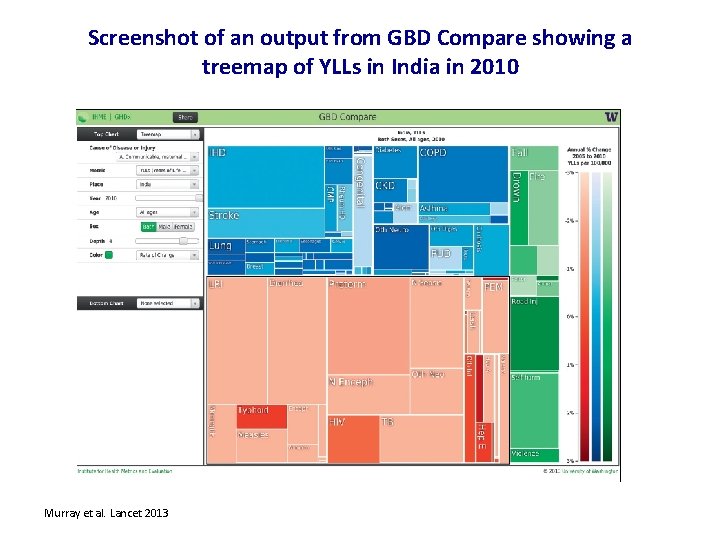
Screenshot of an output from GBD Compare showing a treemap of YLLs in India in 2010 Murray et al. Lancet 2013
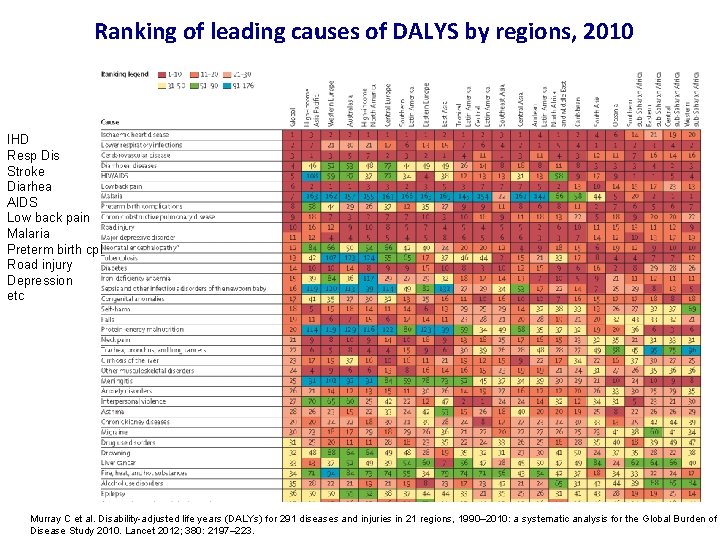
Ranking of leading causes of DALYS by regions, 2010 IHD Resp Dis Stroke Diarhea AIDS Low back pain Malaria Preterm birth cpl Road injury Depression etc Murray C et al. Disability-adjusted life years (DALYs) for 291 diseases and injuries in 21 regions, 1990– 2010: a systematic analysis for the Global Burden of Disease Study 2010. Lancet 2012; 380: 2197– 223.
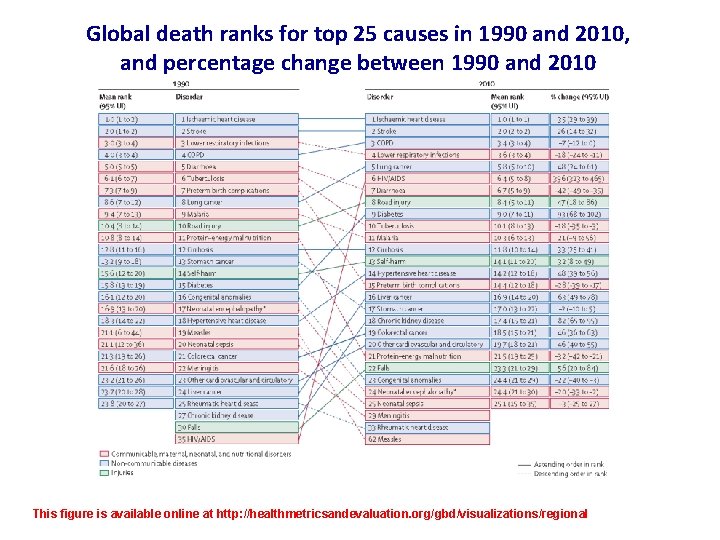
Global death ranks for top 25 causes in 1990 and 2010, and percentage change between 1990 and 2010 This figure is available online at http: //healthmetricsandevaluation. org/gbd/visualizations/regional
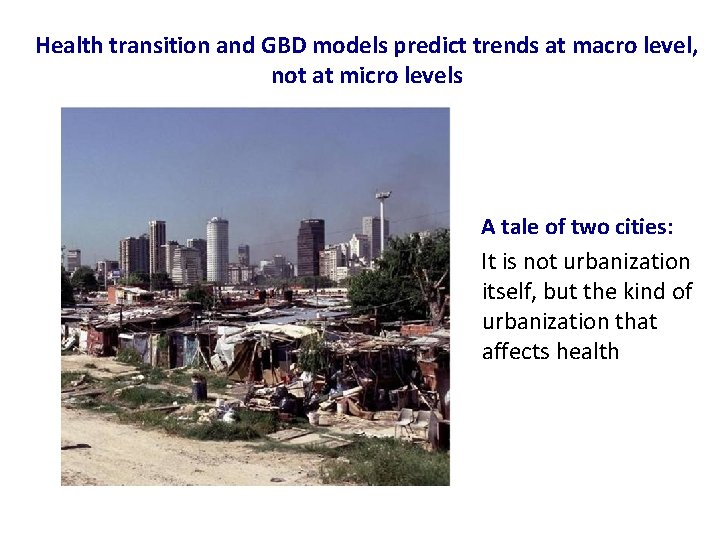
Health transition and GBD models predict trends at macro level, not at micro levels A tale of two cities: It is not urbanization itself, but the kind of urbanization that affects health

Health transition and GBD trends estimates are great tools to predict health situation in populations and planning response I skate where the puck will be Wayne Gretsky « Greatest hockey player of all time »
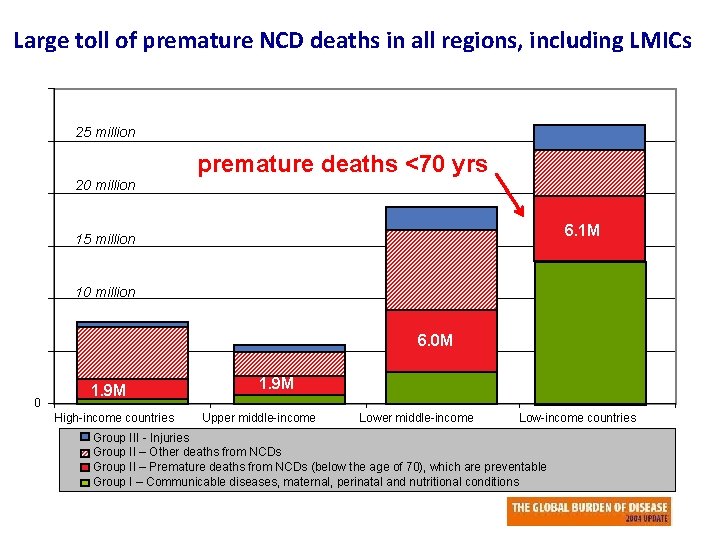
Large toll of premature NCD deaths in all regions, including LMICs 25 million 20 million premature deaths <70 yrs 6. 1 M 15 million 10 million 6. 0 M 0 1. 9 M High-income countries 1. 9 M Upper middle-income Lower middle-income Low-income countries Group III - Injuries Low-income countries Group II – Other deaths from NCDs Group II – Premature deaths from NCDs (below the age of 70), which are preventable Group I – Communicable diseases, maternal, perinatal and nutritional conditions
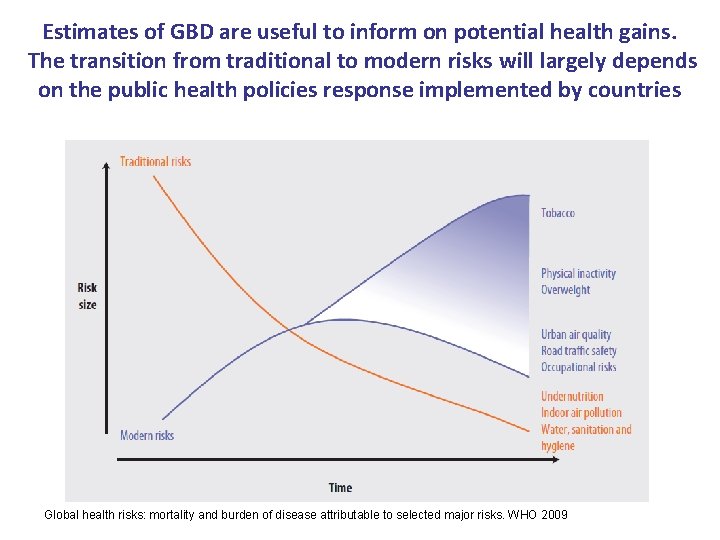
Estimates of GBD are useful to inform on potential health gains. The transition from traditional to modern risks will largely depends on the public health policies response implemented by countries Global health risks: mortality and burden of disease attributable to selected major risks. WHO 2009
Conclusions • GBD is an innovative method to assess the burden of disease worldwide in a comprehensive, comparable and consistent manner • As life expectancy rises, mortality rates are not sufficiently informative, particularly for NCDs: need to include non-fatal health outcomes in policy debates (DALYs) • DALY is a single metric integrating mortality & morbidity allowing direct comparison of global BOD (priority areas, cost-effective interventions, etc) • Several challenges: lack of data in several regions, assumptions (DALYs) • Continuous attempt to improve methods/results (eg updates in 2004/2010) • Emphasis on both diseases (“risk factors of yesterday”) and risk factors (“disease of tomorrow”) to guide policy and interventions • GBD helped put NCDs on agenda as NCDs rank high in all regions and NCD can be prevented • Implications for NCD (global NCD agenda) described in lecture on prevention of NCDs

Changing socio-economic structures underlie changes in behaviors (epidemiological transition, nutrition transition) • Shift from a preindustrial agrarian economy to industrialization – Less physical activity – Higher availability of cheap processed foods (fat, sugar) – But also more varied foods available to all in modern societies • Profound changes in household technology (less PA) – Food availability: canning, refrigeration, freezing, radiation, packaging – Food preparation: fossil fuels, electricity, appliances (cooker, mixers) • Shift in leisure activities – Time spent for viewing television leads to sedentary habits – Marketing of processed foods alters consumption patterns – But also more time for leisure PA in modern societies Adapted from Popkin B. The nutrition transition and obesity in the developing world. Nutr J 1991; 131: 871 -73
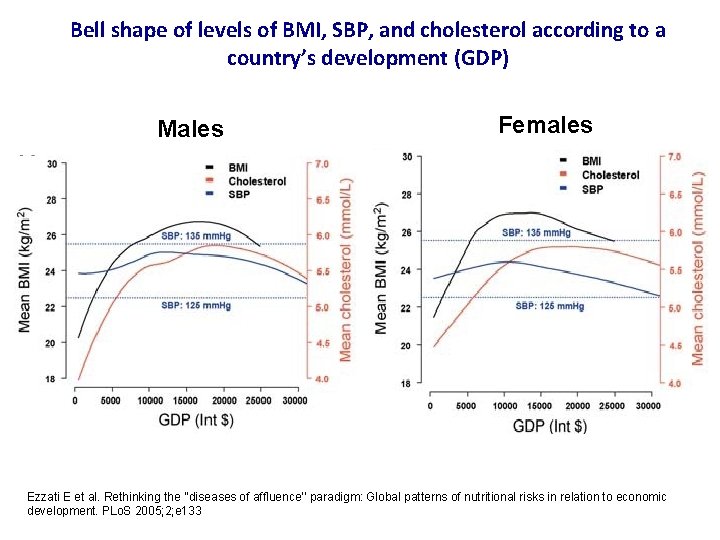
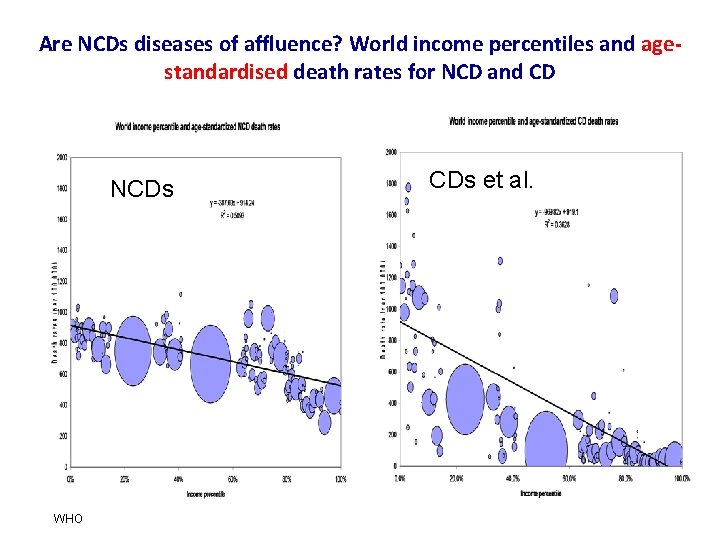
Bell shape of levels of BMI, SBP, and cholesterol according to a country’s development (GDP) Males Females Ezzati E et al. Rethinking the ‘‘diseases of affluence’’ paradigm: Global patterns of nutritional risks in relation to economic development. PLo. S 2005; 2; e 133
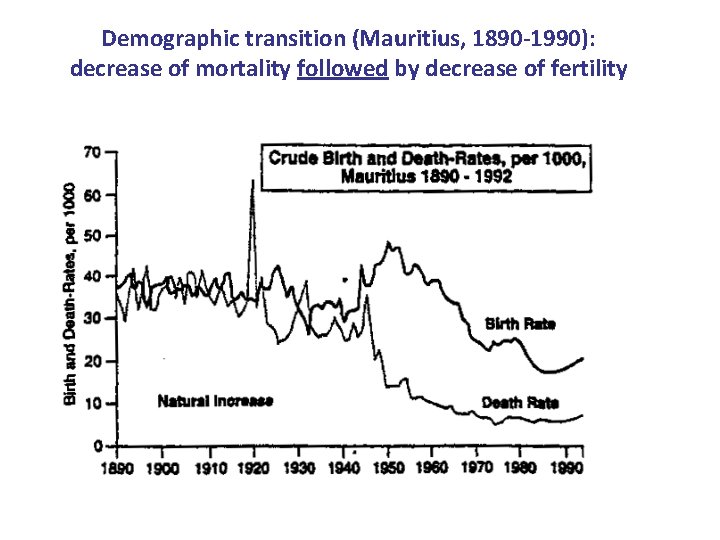
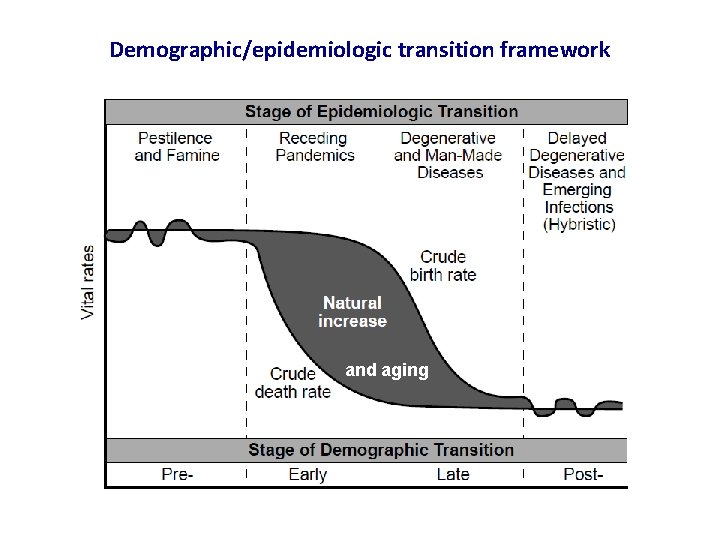
Main engines of the health transition • Demographic transition: lower mortality (esp. from infectious diseases, large gains in youth) leads to increase in life expectancy and larger proportions of older adults in the population • Epidemiologic transition: shift from infectious and nutritional disorders to chronic lifestyle-related disorders as dominant health problems • Social gradient: larger NCD burden shifts from initially affluent urban populations (early adopters of new lifestyles) to poorer population segments (lower education, low purchasing power favoring intake of cheaper energy dense foods, lower access to health services) • Transition in health services (differential access to, and use of, preventive and curative health services)
The health transition and GBD: some conclusions • • Link between social changes, demographic changes and disease patterns Patterns vary between region and country Transition to NCDs results from success in controlling infectious diseases Increasing NCD burden is inevitable when populations are aging Double burden of disease (infectious and NCDs) in many LMICs Patterns of NCD evolve over time (from CD -> CVD -> Cancer -> Neurodegen. ) Need to reduce risk factors (& of NCDs) faster than increasing aging of populations to contain (hopefully reduce) the total numbers of NCD deaths • Transition model provides rationale for prospective planning, also when epidemiological data are not available locally or NCDs are not yet predominant • Good news : later transition stages predicts reduced rates of the “big four” lifestyle-related NCDs (conditional to appropriate policy/health care response)

Outline • The health transition • The driving engines • Demographic transition • Epidemiological transition • Global burden • Methods • Trends of diseases • Fractions of burden attributable to avoidable risk factors • Conclusions • (Implications on global NCD agenda to be seen in lecture on NCD prevention)
Objectives • Describe the principles and different stages of the epidemiological transition, underlying driving engines, and implications for health policy • Describe the underlying overall methods and selected global results of the global burden of disease project What the participant will have achieved as a result of participating in the session • Be able to describe the main engines driving the epidemiological transition • Be able to articulate the overall methods used in GBD and some findings of the global burden of disease, particularly in terms of non communicable diseases (both in terms of burden attributable to diseases and to risk factors)
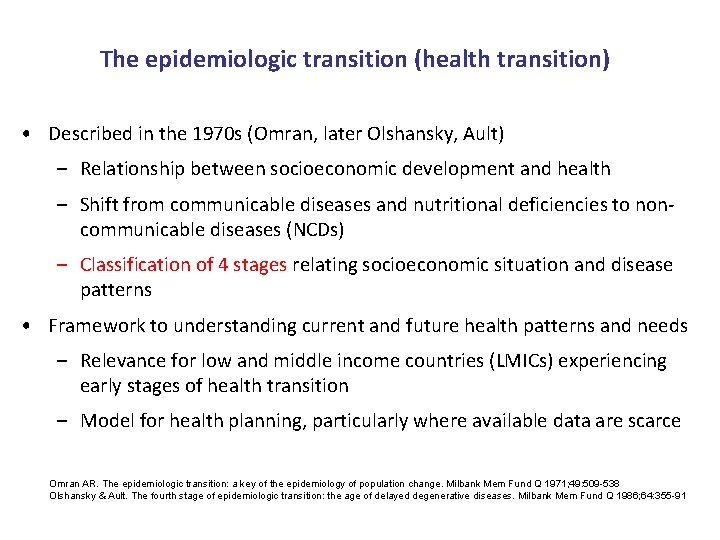
The epidemiologic transition (health transition) • Described in the 1970 s (Omran, later Olshansky, Ault) – Relationship between socioeconomic development and health – Shift from communicable diseases and nutritional deficiencies to noncommunicable diseases (NCDs) – Classification of 4 stages relating socioeconomic situation and disease patterns • Framework to understanding current and future health patterns and needs – Relevance for low and middle income countries (LMICs) experiencing early stages of health transition – Model for health planning, particularly where available data are scarce Omran AR. The epidemiologic transition: a key of the epidemiology of population change. Milbank Mem Fund Q 1971; 49: 509 -538 Olshansky & Ault. The fourth stage of epidemiologic transition: the age of delayed degenerative diseases. Milbank Mem Fund Q 1986; 64: 355 -91
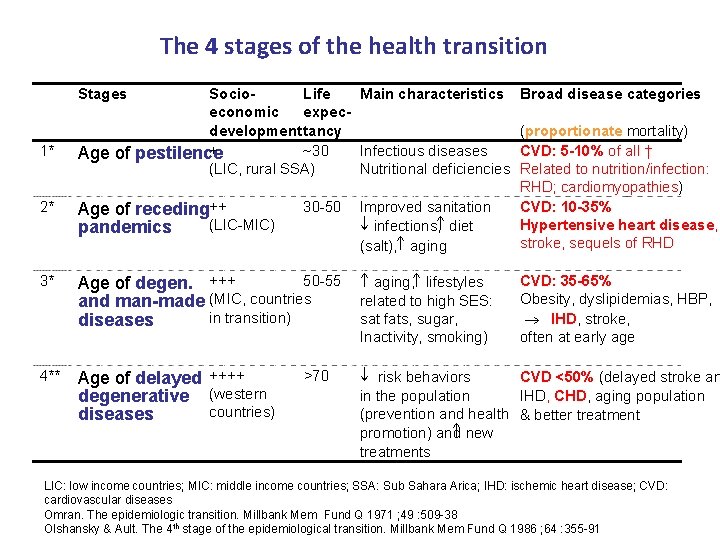
The 4 stages of the health transition Stages Socio. Life Main characteristics economic expecdevelopment tancy + ~30 Infectious diseases Age of pestilence (LIC, rural SSA) Nutritional deficiencies Broad disease categories 2* Age of receding++ (LIC-MIC) pandemics 30 -50 Improved sanitation : infections, diet (salt), aging (proportionate mortality) CVD: 5 -10% of all † Related to nutrition/infection: RHD; cardiomyopathies) CVD: 10 -35% Hypertensive heart disease, stroke, sequels of RHD 3* 50 -55 Age of degen. +++ and man-made (MIC, countries in transition) diseases aging, lifestyles related to high SES: sat fats, sugar, Inactivity, smoking) CVD: 35 -65% Obesity, dyslipidemias, HBP, ® IHD, stroke, often at early age 4** Age of delayed ++++ degenerative (western countries) diseases risk behaviors CVD <50% (delayed stroke an in the population IHD, CHD, aging population (prevention and health & better treatment new promotion) and treatments 1* >70 LIC: low income countries; MIC: middle income countries; SSA: Sub Sahara Arica; IHD: ischemic heart disease; CVD: cardiovascular diseases Omran. The epidemiologic transition. Millbank Mem Fund Q 1971 ; 49 : 509 -38 Olshansky & Ault. The 4 th stage of the epidemiological transition. Millbank Mem Fund Q 1986 ; 64 : 355 -91
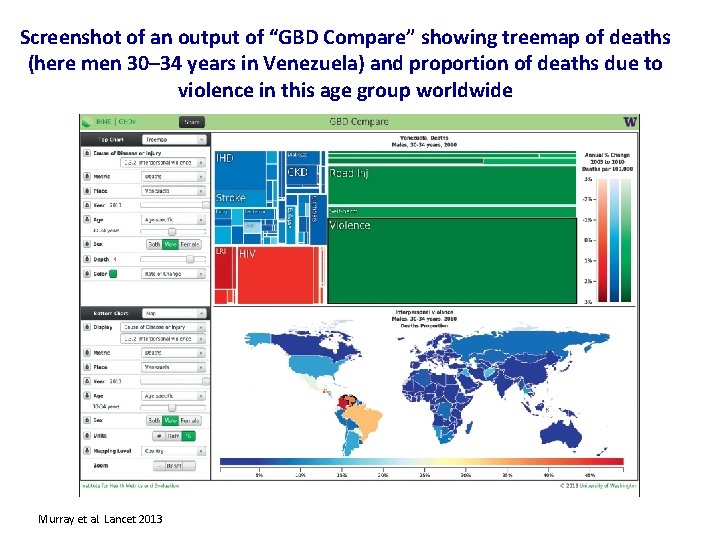
Screenshot of an output of “GBD Compare” showing treemap of deaths (here men 30– 34 years in Venezuela) and proportion of deaths due to violence in this age group worldwide Murray et al. Lancet 2013
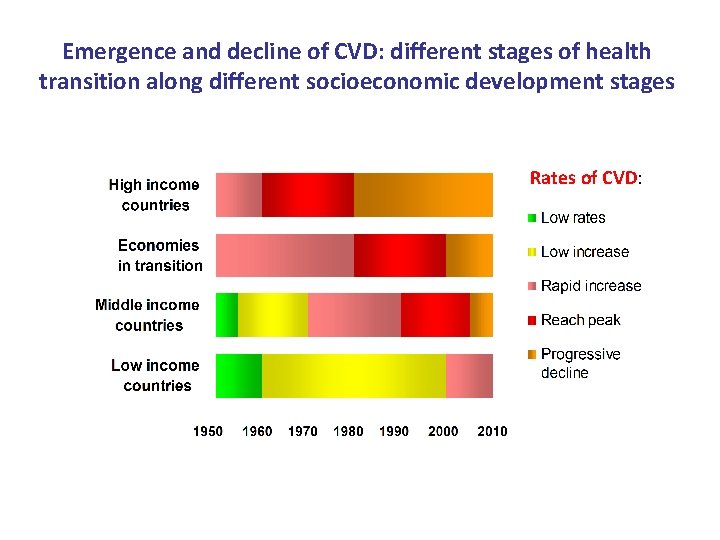
Emergence and decline of CVD: different stages of health transition along different socioeconomic development stages Rates of CVD:
Health transition: contrasting secular changes in proportionate mortality in Latin America, 1970 - 1995 infectious cancer CVD perinatal injury Guatemala Mexico other Uauy et al. J Nutr 2001 Chile Uruguay
Proportions of disability adjusted life of years lost (DALYs) by main disease causes and regions Mathers et al 2003
Are NCDs diseases of affluence? World income percentiles and agestandardised death rates for NCD and CD NCDs WHO CDs et al.
Demographic transition (Mauritius, 1890 -1990): decrease of mortality followed by decrease of fertility
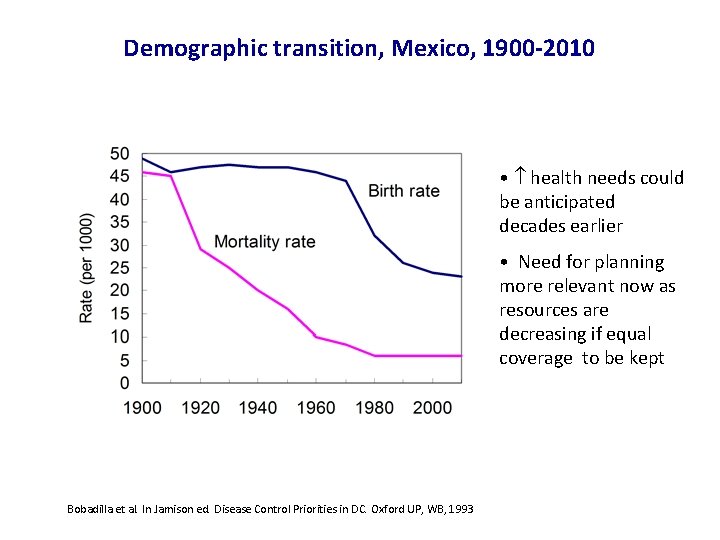
Demographic transition, Mexico, 1900 -2010 • health needs could be anticipated decades earlier • Need for planning more relevant now as resources are decreasing if equal coverage to be kept Bobadilla et al. In Jamison ed. Disease Control Priorities in DC. Oxford UP, WB, 1993
Demographic/epidemiologic transition framework and aging
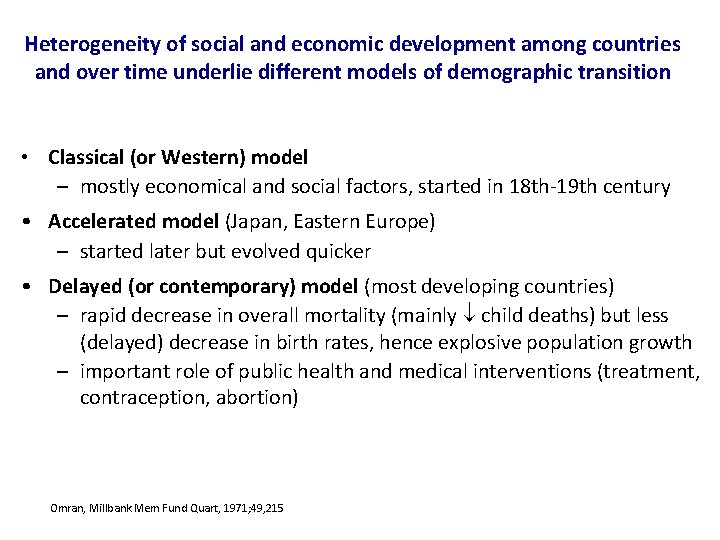
Heterogeneity of social and economic development among countries and over time underlie different models of demographic transition • Classical (or Western) model – mostly economical and social factors, started in 18 th-19 th century • Accelerated model (Japan, Eastern Europe) – started later but evolved quicker • Delayed (or contemporary) model (most developing countries) – rapid decrease in overall mortality (mainly child deaths) but less (delayed) decrease in birth rates, hence explosive population growth – important role of public health and medical interventions (treatment, contraception, abortion) Omran, Millbank Mem Fund Quart, 1971; 49, 215
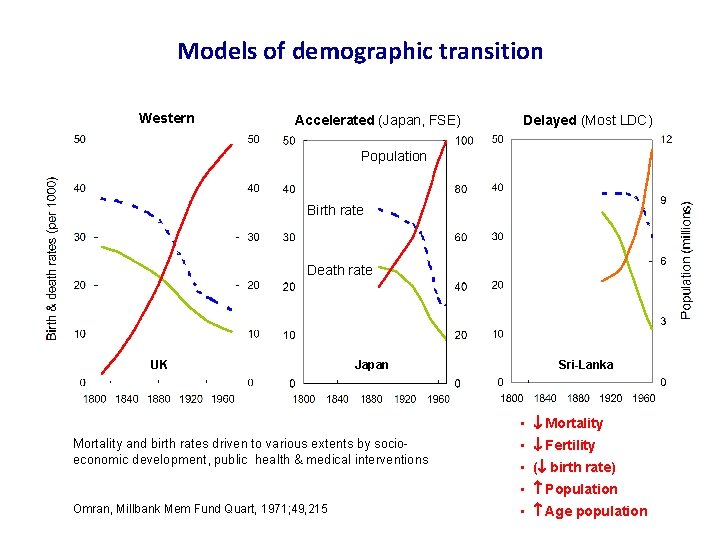
Models of demographic transition Western Accelerated (Japan, FSE) Delayed (Most LDC) Population Birth rate Death rate UK Japan Sri-Lanka • Mortality and birth rates driven to various extents by socioeconomic development, public health & medical interventions • Fertility • ( birth rate) • Population Omran, Millbank Mem Fund Quart, 1971; 49, 215 • Age population
Globalization favors lifestyle transition (good & bad changes) • Trade liberalization (of world markets) and urbanization – Nutrition transition: fats, sugar (‘coca-colanisation’), ↓ complex carbohydrates – Supply larger than demand fuels competition & promotion (large portions, “all you can eat”, etc), reduces cost of $/calorie (fats, sugars): favors consumption – tobacco (marketing, low cost) – But also allows for more varied foods (last stage of health transition) • Information & communication technologies – Global advertising & promotion of unhealthy lifestyles – But also allows promotion of potentially healthy behaviors and healthy products • Urbanization and accelerated migration of populations – Acculturation facilitates adoption of both unhealthy & healthy lifestyles
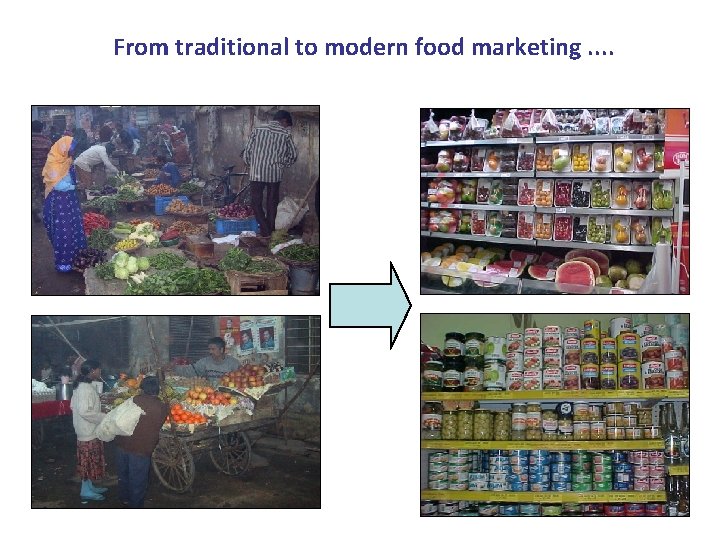
From traditional to modern food marketing. .
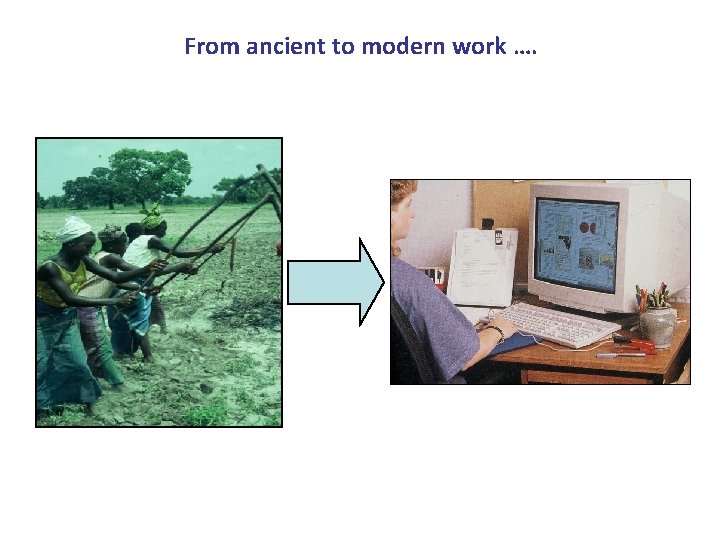
From ancient to modern work ….
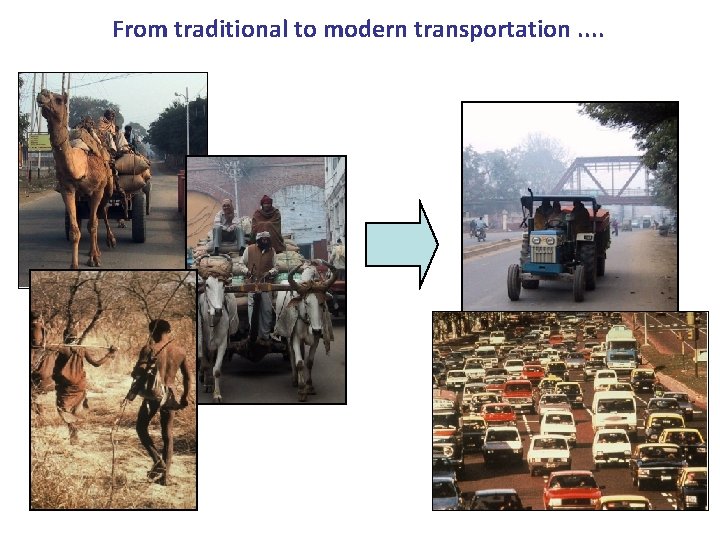
From traditional to modern transportation. .

Source: Die Zeit. Nr. 15, 1. April 2004, S. 44
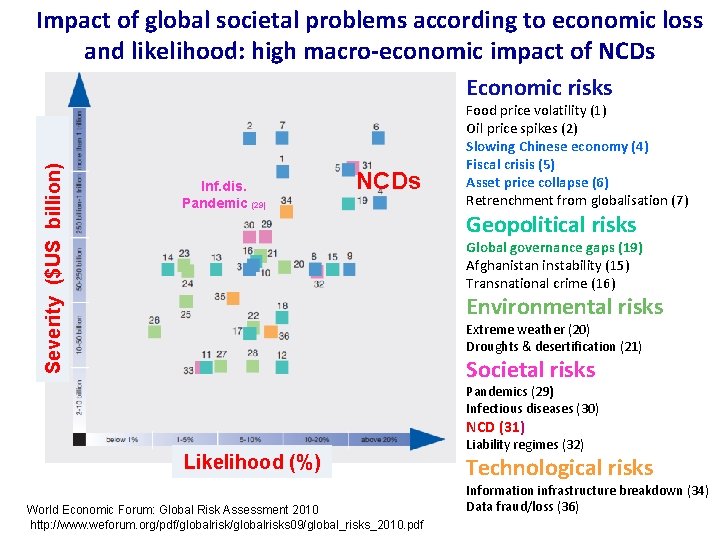
Impact of global societal problems according to economic loss and likelihood: high macro-economic impact of NCDs Severity ($US billion) Economic risks Inf. dis. Pandemic (29) NCDs Food price volatility (1) Oil price spikes (2) Slowing Chinese economy (4) Fiscal crisis (5) Asset price collapse (6) Retrenchment from globalisation (7) Geopolitical risks Global governance gaps (19) Afghanistan instability (15) Transnational crime (16) Environmental risks Extreme weather (20) Droughts & desertification (21) Societal risks Pandemics (29) Infectious diseases (30) NCD (31) Likelihood (%) World Economic Forum: Global Risk Assessment 2010 http: //www. weforum. org/pdf/globalrisks 09/global_risks_2010. pdf Liability regimes (32) Technological risks Information infrastructure breakdown (34) Data fraud/loss (36)
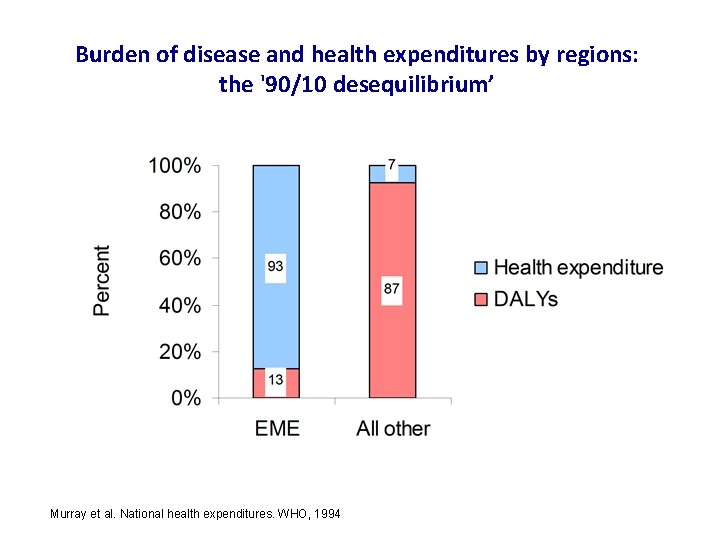
Burden of disease and health expenditures by regions: the '90/10 desequilibrium’ Murray et al. National health expenditures. WHO, 1994
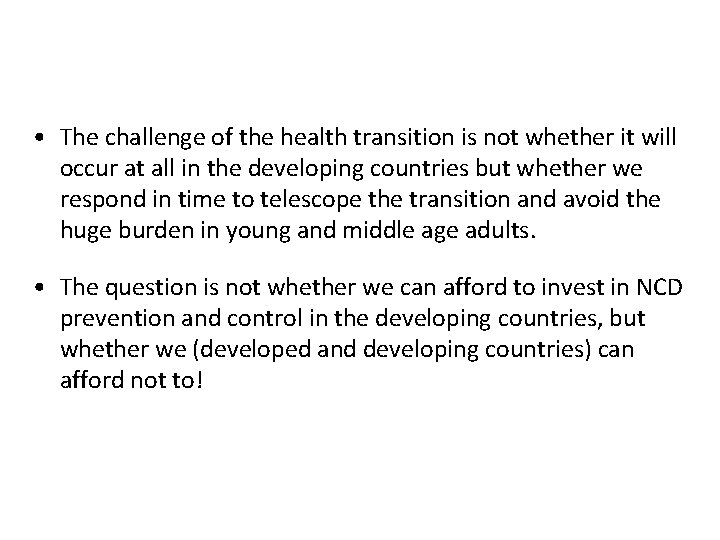
• The challenge of the health transition is not whether it will occur at all in the developing countries but whether we respond in time to telescope the transition and avoid the huge burden in young and middle age adults. • The question is not whether we can afford to invest in NCD prevention and control in the developing countries, but whether we (developed and developing countries) can afford not to!
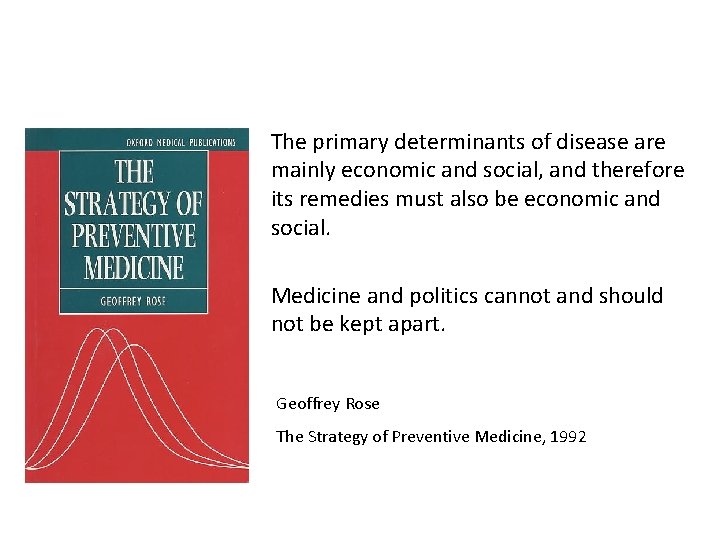
The primary determinants of disease are mainly economic and social, and therefore its remedies must also be economic and social. Medicine and politics cannot and should not be kept apart. Geoffrey Rose The Strategy of Preventive Medicine, 1992
Global Burden of Disease
Global burden of disease: web site of the Institute for Health Metrics and Evaluation (IHME) www. healthmetricsandevaluation. org/gbd
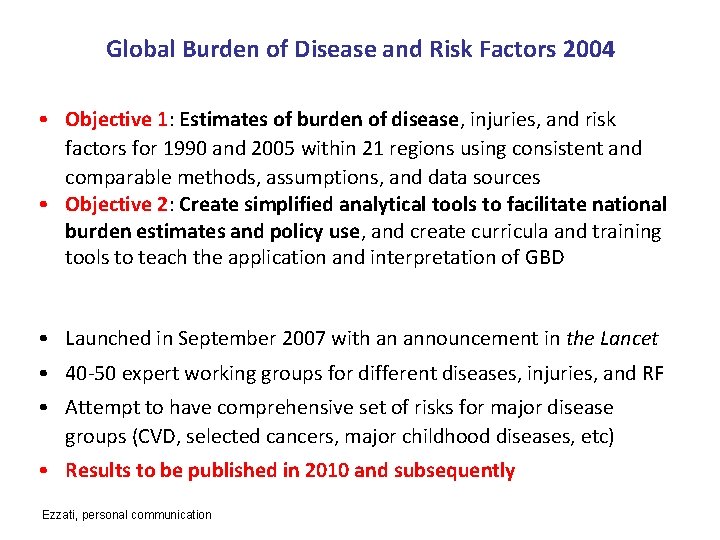
Global Burden of Disease and Risk Factors 2004 • Objective 1: Estimates of burden of disease, injuries, and risk factors for 1990 and 2005 within 21 regions using consistent and comparable methods, assumptions, and data sources • Objective 2: Create simplified analytical tools to facilitate national burden estimates and policy use, and create curricula and training tools to teach the application and interpretation of GBD • Launched in September 2007 with an announcement in the Lancet • 40 -50 expert working groups for different diseases, injuries, and RF • Attempt to have comprehensive set of risks for major disease groups (CVD, selected cancers, major childhood diseases, etc) • Results to be published in 2010 and subsequently Ezzati, personal communication
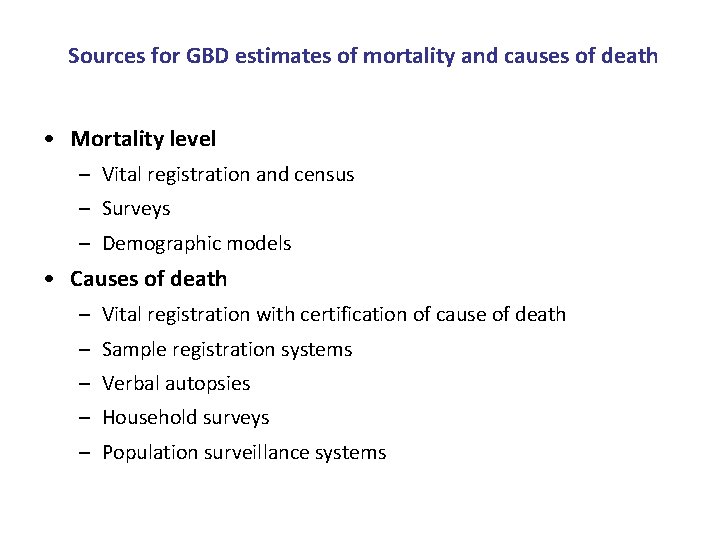
Sources for GBD estimates of mortality and causes of death • Mortality level – Vital registration and census – Surveys – Demographic models • Causes of death – Vital registration with certification of cause of death – Sample registration systems – Verbal autopsies – Household surveys – Population surveillance systems
Assessing cause of death: principles of ICD coding • • Coarsest level: ICD divided in 17 chapters = mixture of 1) etiologies (infection, neoplasm), 2) organ system (digestive) and 3) injuries Changes over versions (stroke: disease of CNS -> Circulatory System) ‘Final’, ‘underlying’ and ‘related’ causes of death (e. g. death from liver cancer caused by HBV, MI in patient with hypertension and diabetes) Rule for selection: «the disease or injury which initiated the sequence of events which led to death» Often ‘underlying cause’ unless ‘senility’, ‘ill-defined conditions’, ‘trivial conditions’, ‘linked conditions’, ‘early and late stages of disease’, ‘late effects’, ‘old pneumonia, influenza & maternal conditions’, and ‘errors and accident of medical care’ In reality, each ICD version is a political document reflecting the political power of different groups to manipulate the coding of particular causes (eg, ICD 10: maternal causes & HIV) ‘Ill defined causes’ changed much lately: potential for bias in trends (1980 s, Mexico: 30% CVD deaths attributed to ‘ventricular dysrythmias’) Harvard Center for Population and Development Studies
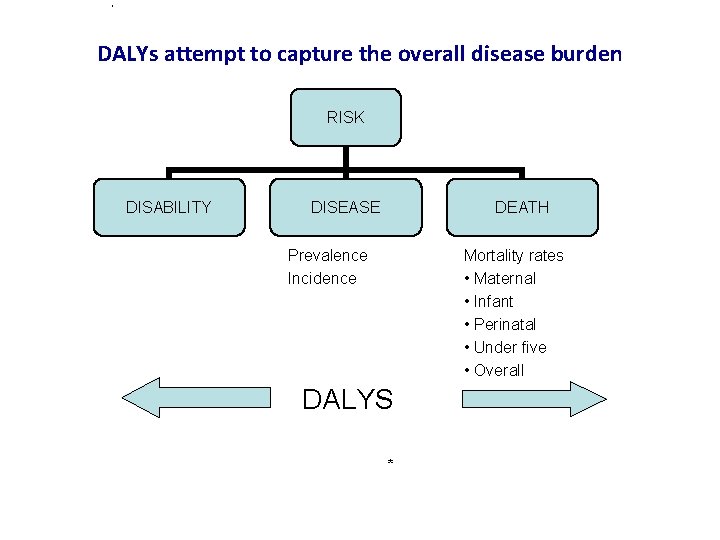
n t r o d u c t i o n 1 DALYs attempt to capture the overall disease burden DISABILITY RISK DISEASE DEATH Prevalence Incidence Mortality rates • Maternal • Infant • Perinatal • Under five • Overall DALYS *
Composante «incapacité» : Identifier un nombre limité de séquelles majeures, leur épidémiologie et leur taux d’incapacité • 483 séquelles identifiées pour 107 conditions • par exemple, 5 complications du diabète: diabète per se, rétinopathie, neuropathie, pied diabétique, amputation • Déterminer la survenue, durée, incidence, prévalence, et taux de décès pour chaque séquelle (par âge, sexe, région) • Estimer les taux d’incapacité résultant de ces séquelles: estimer un facteur de pondération entre 0 (santé parfaite) et 1 (même gravité que décès) Murray & Peto, Lancet 1997
Assessment of disability • Before GBD, no method to compare disability in different diseases • Weight from 0 (disability ~death) and 1 (perfect health) • Different ‘trade-off ’ methods (expert panels, e. g. with analog scales, ranks, time trade-off , etc) • Large consensus between 8 panels in different panels (r >0. 9) Lancet, 1997; 349: 1350
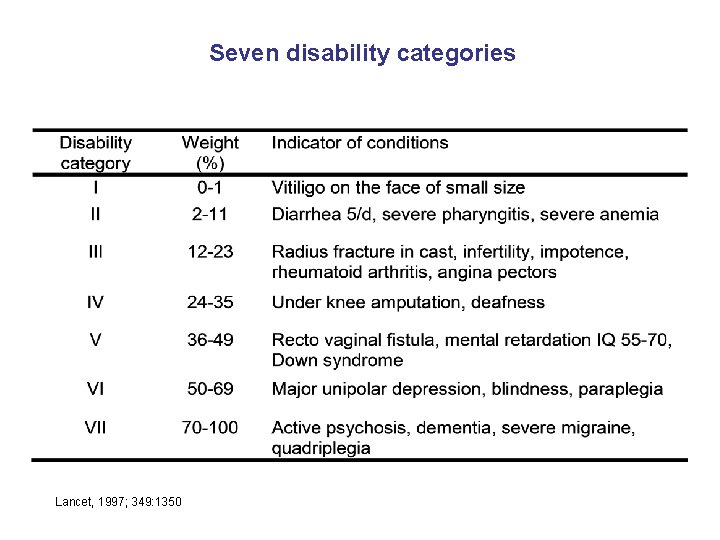
Seven disability categories Lancet, 1997; 349: 1350
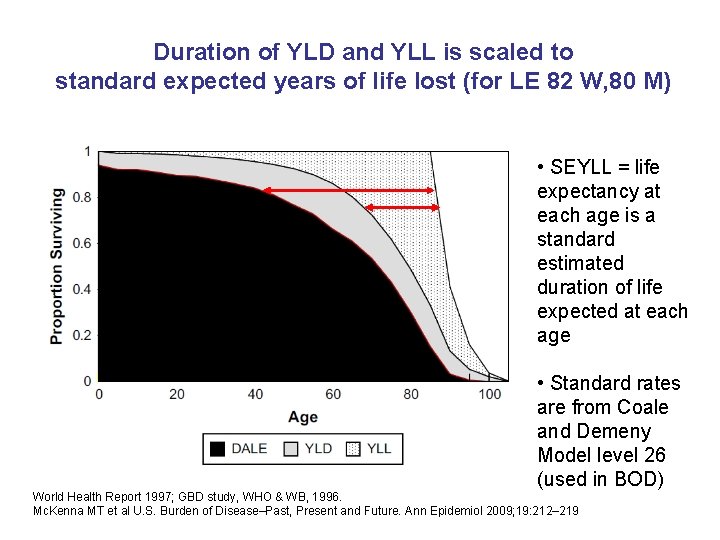
Duration of YLD and YLL is scaled to standard expected years of life lost (for LE 82 W, 80 M) • SEYLL = life expectancy at each age is a standard estimated duration of life expected at each age • Standard rates are from Coale and Demeny Model level 26 (used in BOD) World Health Report 1997; GBD study, WHO & WB, 1996. Mc. Kenna MT et al U. S. Burden of Disease–Past, Present and Future. Ann Epidemiol 2009; 19: 212– 219
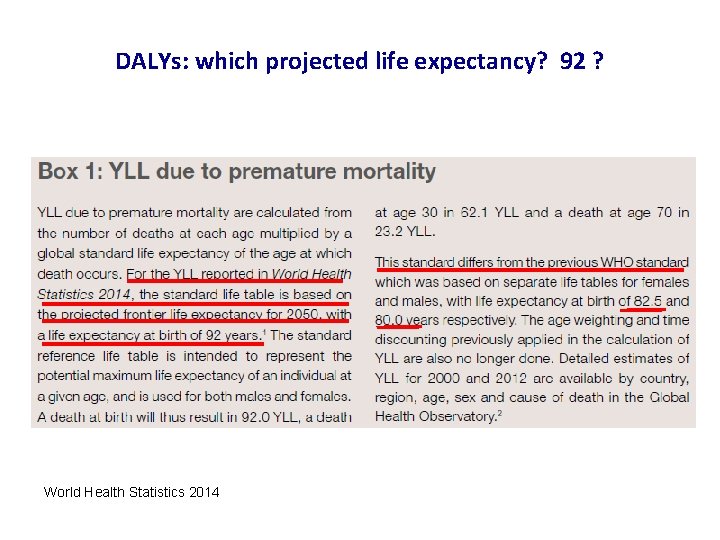
DALYs: which projected life expectancy? 92 ? World Health Statistics 2014
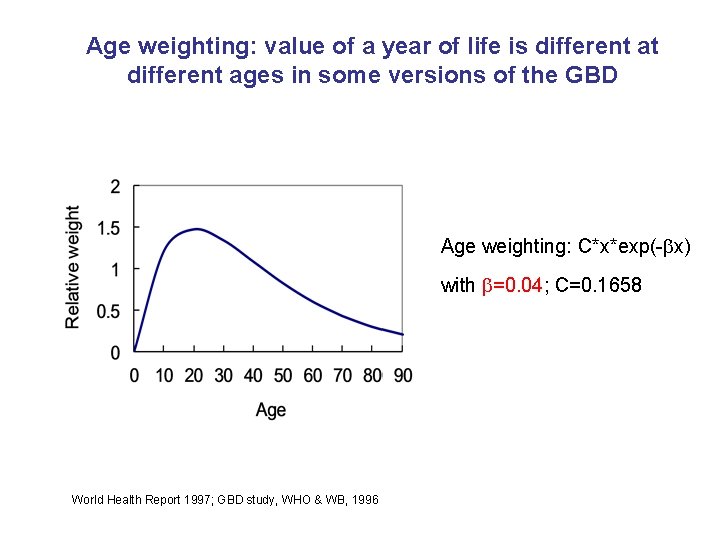
Age weighting: value of a year of life is different at different ages in some versions of the GBD Age weighting: C*x*exp(- x) with =0. 04; C=0. 1658 World Health Report 1997; GBD study, WHO & WB, 1996
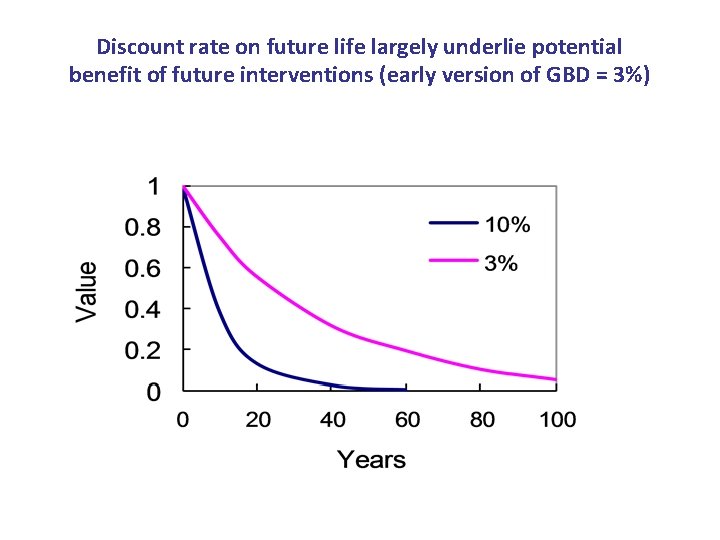
Discount rate on future life largely underlie potential benefit of future interventions (early version of GBD = 3%)
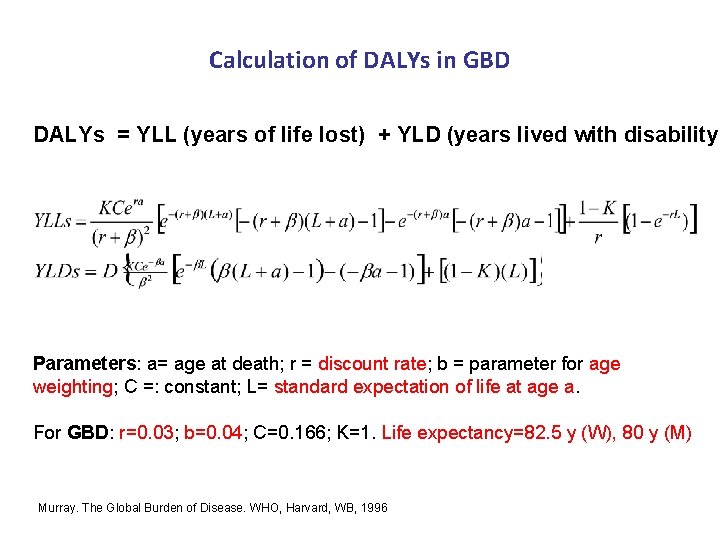
Calculation of DALYs in GBD DALYs = YLL (years of life lost) + YLD (years lived with disability) Parameters: a= age at death; r = discount rate; b = parameter for age weighting; C =: constant; L= standard expectation of life at age a. For GBD: r=0. 03; b=0. 04; C=0. 166; K=1. Life expectancy=82. 5 y (W), 80 y (M) Murray. The Global Burden of Disease. WHO, Harvard, WB, 1996
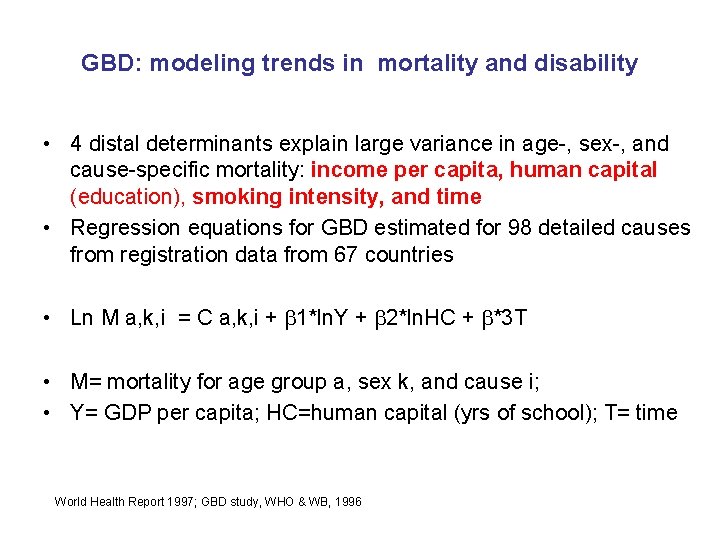
GBD: modeling trends in mortality and disability • 4 distal determinants explain large variance in age-, sex-, and cause-specific mortality: income per capita, human capital (education), smoking intensity, and time • Regression equations for GBD estimated for 98 detailed causes from registration data from 67 countries • Ln M a, k, i = C a, k, i + 1*ln. Y + 2*ln. HC + *3 T • M= mortality for age group a, sex k, and cause i; • Y= GDP per capita; HC=human capital (yrs of school); T= time World Health Report 1997; GBD study, WHO & WB, 1996
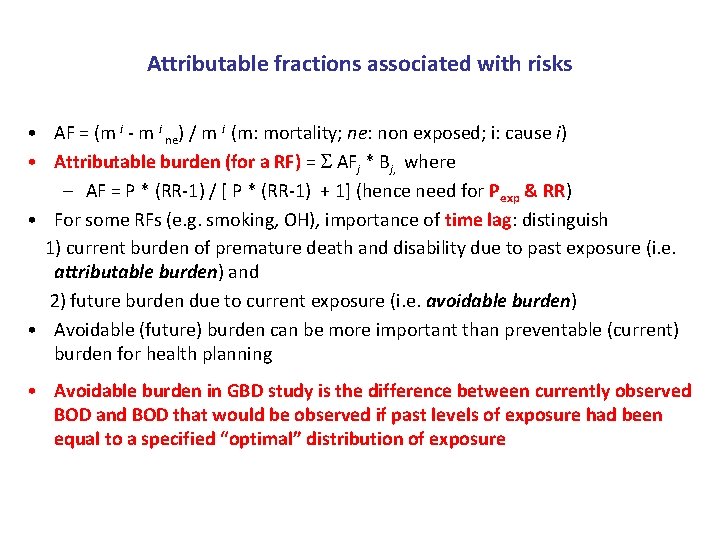
Attributable fractions associated with risks • AF = (m i - m i ne) / m i (m: mortality; ne: non exposed; i: cause i) • Attributable burden (for a RF) = AFj * Bj, where – AF = P * (RR-1) / [ P * (RR-1) + 1] (hence need for Pexp & RR) • For some RFs (e. g. smoking, OH), importance of time lag: distinguish 1) current burden of premature death and disability due to past exposure (i. e. attributable burden) and 2) future burden due to current exposure (i. e. avoidable burden) • Avoidable (future) burden can be more important than preventable (current) burden for health planning • Avoidable burden in GBD study is the difference between currently observed BOD and BOD that would be observed if past levels of exposure had been equal to a specified “optimal” distribution of exposure
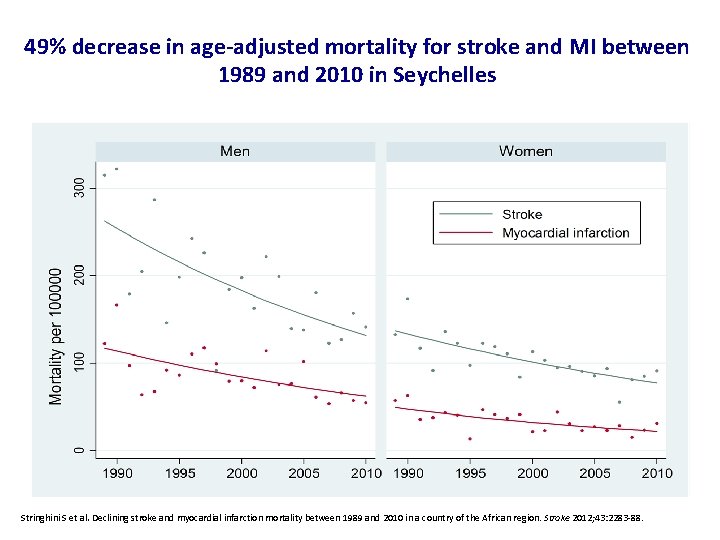
49% decrease in age-adjusted mortality for stroke and MI between 1989 and 2010 in Seychelles Stringhini S et al. Declining stroke and myocardial infarction mortality between 1989 and 2010 in a country of the African region. Stroke 2012; 43: 2283 -88.
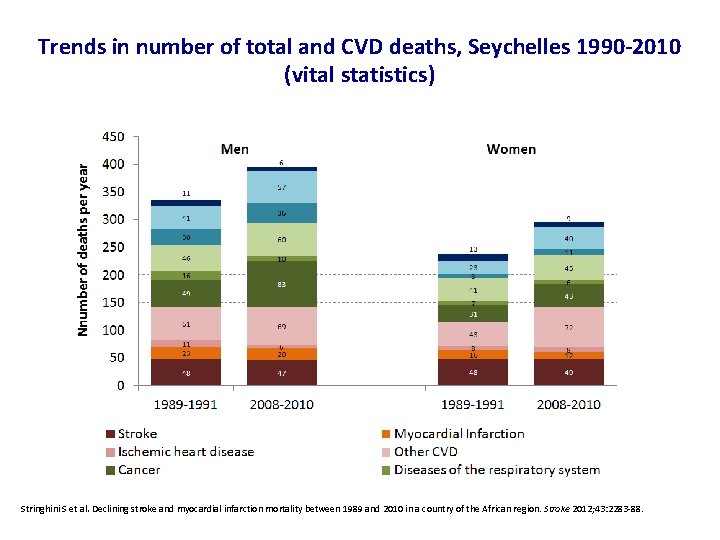
Trends in number of total and CVD deaths, Seychelles 1990 -2010 (vital statistics) Stringhini S et al. Declining stroke and myocardial infarction mortality between 1989 and 2010 in a country of the African region. Stroke 2012; 43: 2283 -88.
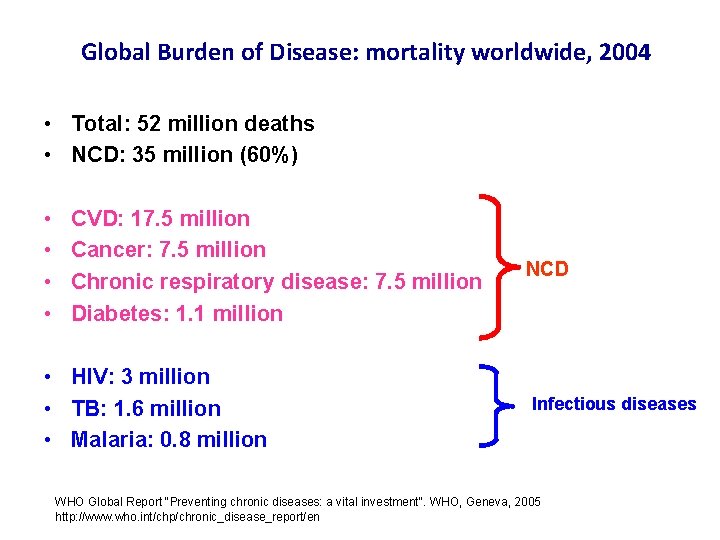
Global Burden of Disease: mortality worldwide, 2004 • Total: 52 million deaths • NCD: 35 million (60%) • • CVD: 17. 5 million Cancer: 7. 5 million Chronic respiratory disease: 7. 5 million Diabetes: 1. 1 million • HIV: 3 million • TB: 1. 6 million • Malaria: 0. 8 million NCD Infectious diseases WHO Global Report "Preventing chronic diseases: a vital investment". WHO, Geneva, 2005 http: //www. who. int/chp/chronic_disease_report/en
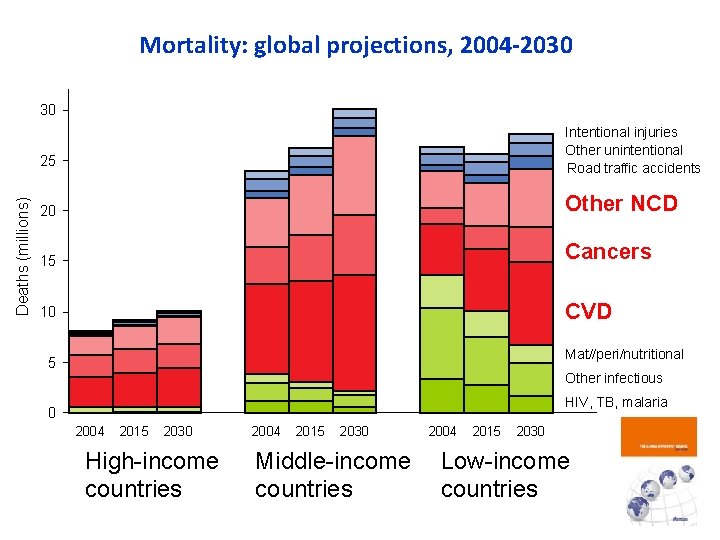
Mortality: global projections, 2004 -2030 30 Intentional injuries Other unintentional Road traffic accidents Deaths (millions) 25 20 Other NCD 15 Cancers 10 CVD Mat//peri/nutritional 5 Other infectious HIV, TB, malaria 0 2004 2015 2030 High-income countries 2004 2015 2030 Middle-income countries 2004 2015 2030 Low-income countries
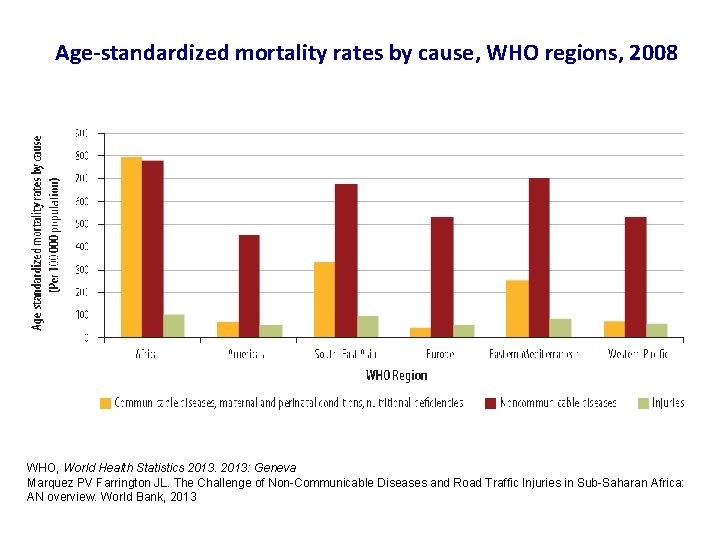
Age-standardized mortality rates by cause, WHO regions, 2008 WHO, World Health Statistics 2013: Geneva Marquez PV Farrington JL. The Challenge of Non-Communicable Diseases and Road Traffic Injuries in Sub-Saharan Africa: AN overview. World Bank, 2013
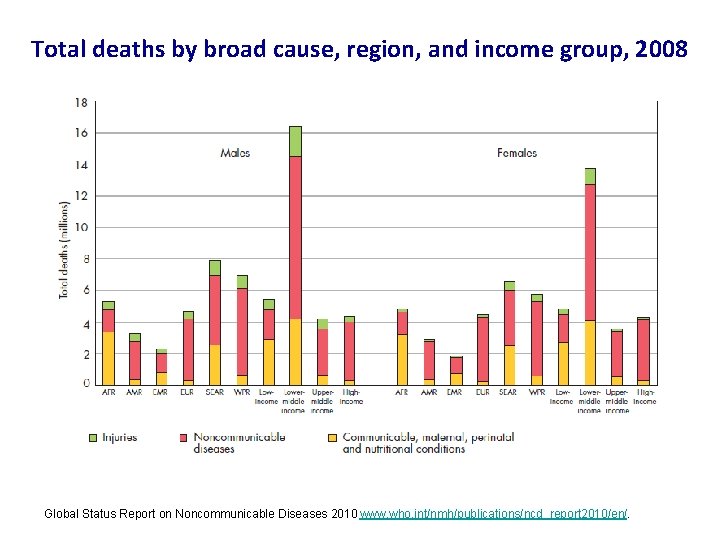
Total deaths by broad cause, region, and income group, 2008 Global Status Report on Noncommunicable Diseases 2010 www. who. int/nmh/publications/ncd_report 2010/en/.
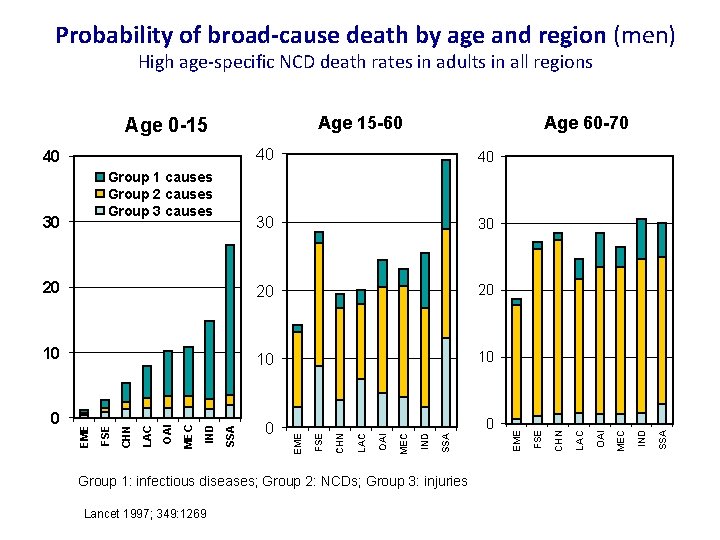
Probability of broad-cause death by age and region (men) High age-specific NCD death rates in adults in all regions Age 15 -60 Lancet 1997; 349: 1269 SSA IND MEC OAI LAC CHN FSE EME Group 1: infectious diseases; Group 2: NCDs; Group 3: injuries MEC 0 OAI 0 0 LAC 10 CHN 10 SSA 10 IND 20 MEC 20 OAI 20 LAC 30 30 CHN 30 Group 1 causes Group 2 causes Group 3 causes FSE 40 EME 40 40 FSE Age 60 -70 EME Age 0 -15
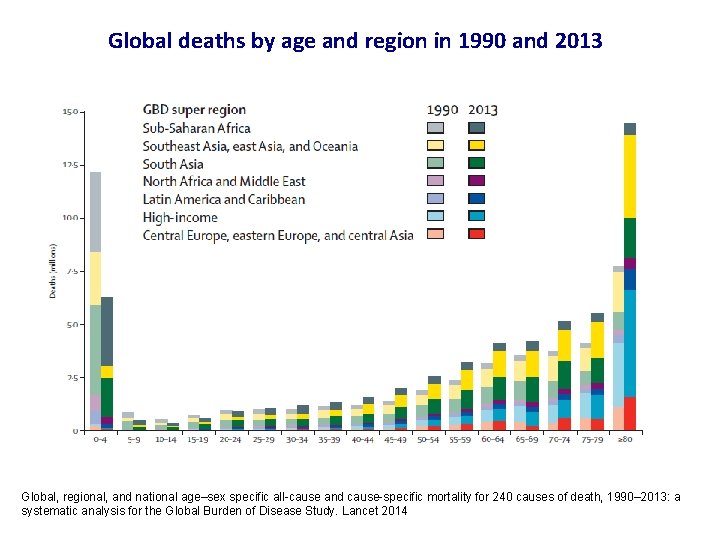
Global deaths by age and region in 1990 and 2013 Global, regional, and national age–sex specific all-cause and cause-specific mortality for 240 causes of death, 1990– 2013: a systematic analysis for the Global Burden of Disease Study. Lancet 2014
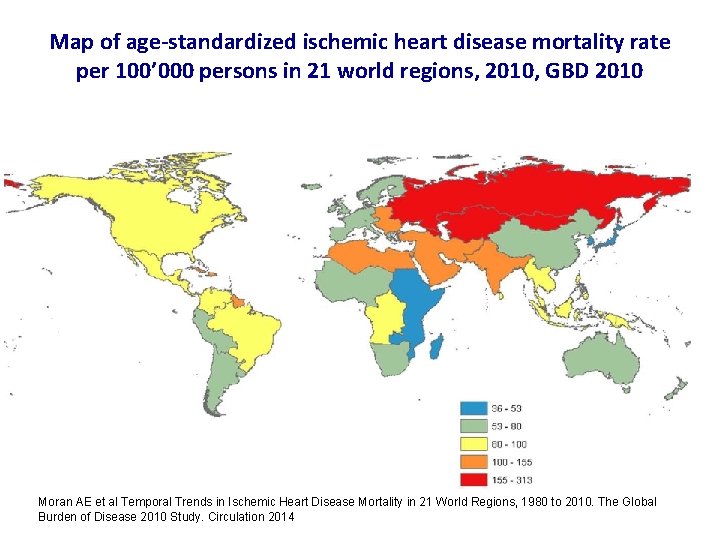
Map of age-standardized ischemic heart disease mortality rate per 100’ 000 persons in 21 world regions, 2010, GBD 2010 Moran AE et al Temporal Trends in Ischemic Heart Disease Mortality in 21 World Regions, 1980 to 2010. The Global Burden of Disease 2010 Study. Circulation 2014
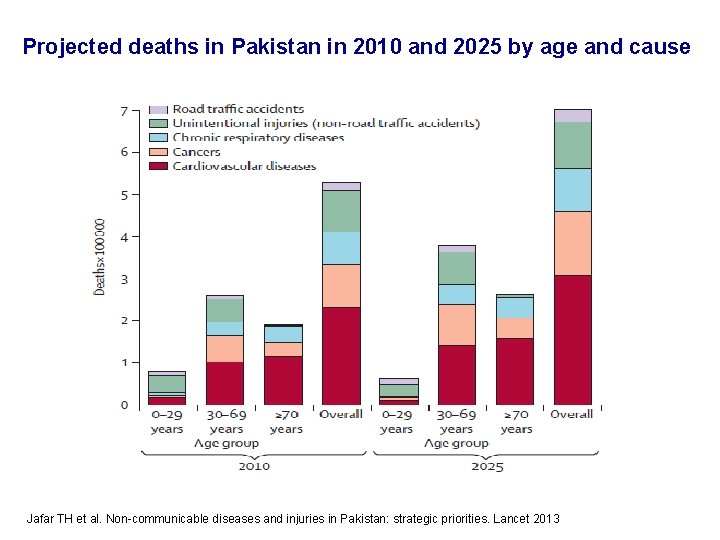
Projected deaths in Pakistan in 2010 and 2025 by age and cause Jafar TH et al. Non-communicable diseases and injuries in Pakistan: strategic priorities. Lancet 2013
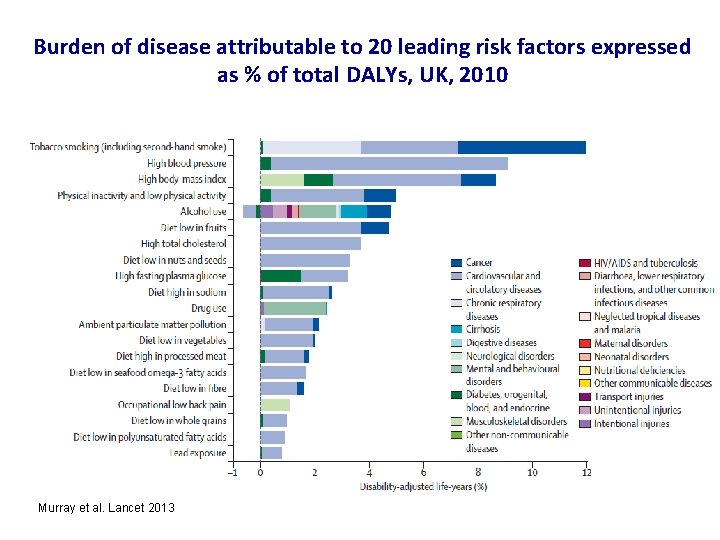
Burden of disease attributable to 20 leading risk factors expressed as % of total DALYs, UK, 2010 Murray et al. Lancet 2013
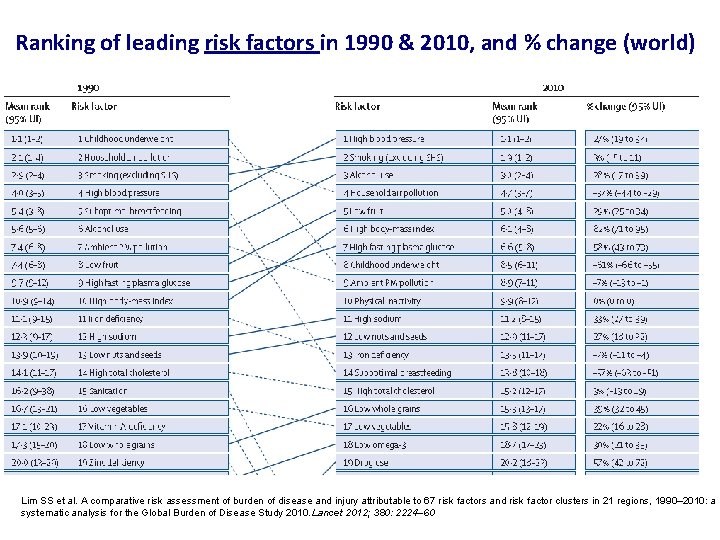
Ranking of leading risk factors in 1990 & 2010, and % change (world) Lim SS et al. A comparative risk assessment of burden of disease and injury attributable to 67 risk factors and risk factor clusters in 21 regions, 1990– 2010: a systematic analysis for the Global Burden of Disease Study 2010. Lancet 2012; 380: 2224– 60
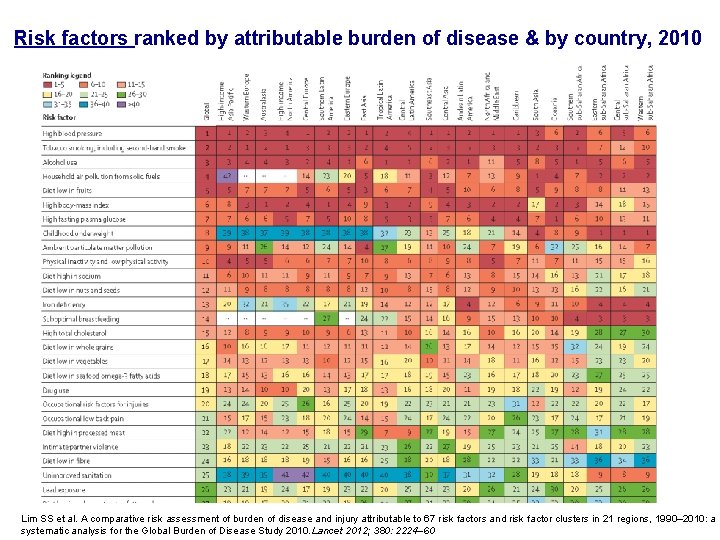
Risk factors ranked by attributable burden of disease & by country, 2010 Lim SS et al. A comparative risk assessment of burden of disease and injury attributable to 67 risk factors and risk factor clusters in 21 regions, 1990– 2010: a systematic analysis for the Global Burden of Disease Study 2010. Lancet 2012; 380: 2224– 60
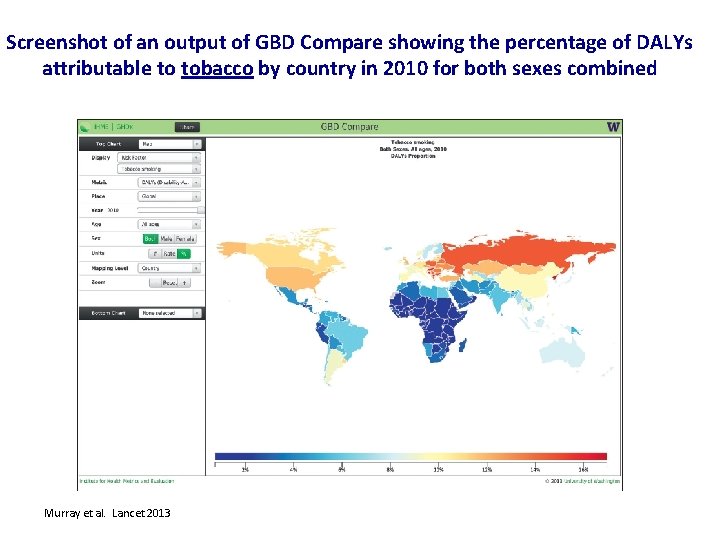
Screenshot of an output of GBD Compare showing the percentage of DALYs attributable to tobacco by country in 2010 for both sexes combined Murray et al. Lancet 2013

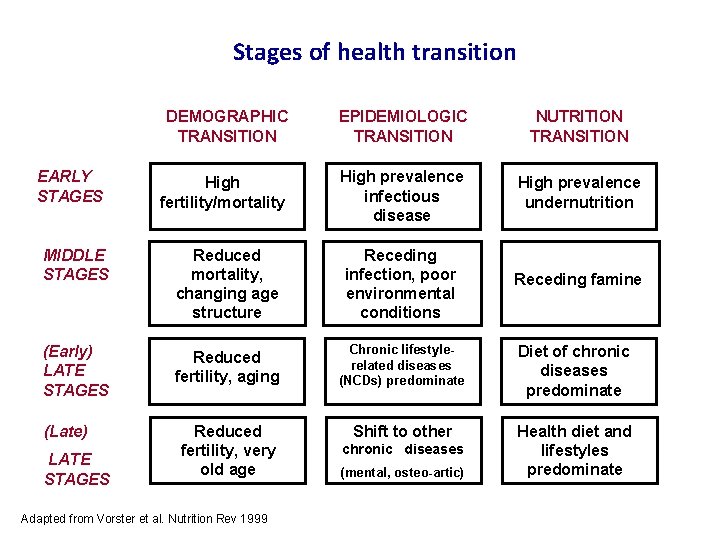
Stages of health transition EARLY STAGES DEMOGRAPHIC TRANSITION EPIDEMIOLOGIC TRANSITION NUTRITION TRANSITION High fertility/mortality High prevalence infectious disease High prevalence undernutrition Receding famine MIDDLE STAGES Reduced mortality, changing age structure Receding infection, poor environmental conditions (Early) LATE STAGES Reduced fertility, aging Chronic lifestylerelated diseases (NCDs) predominate Diet of chronic diseases predominate Reduced fertility, very old age Shift to other Health diet and lifestyles predominate (Late) LATE STAGES Adapted from Vorster et al. Nutrition Rev 1999 chronic diseases (mental, osteo-artic)
Links between health care transition, demographic transition and disease trends in populations • Large influence on the dynamics of demographic transition – e. g. ‘delayed transition model’ in many developing countries – large decrease of infant mortality not followed by proportionate decrease in birth (fertility) rate resulting in particularly large population increase • Access to and use of preventive and curative services • Costs and allocation of preventive and curative resources, particularly in developing countries (communicable diseases vs NVCDs)
Health planning: using the transition to set priorities 2 main methods of planning for budget allocation • Retrospective method: allocation of resources according to previously established priorities Better takes in account budget limitations but tends to perpetuate existing conditions • Prospective method: starts with a definition of health needs (depends of age distribution [can be predicted], changes in prevalence rates of disease and risk factors and expectations) to then define service and resource equivalents • Better anticipates future health needs and resource requirements Bobadilla et al. In Jamison ed. Disease Control Priorities in DC. Oxford UP, WB, 1993
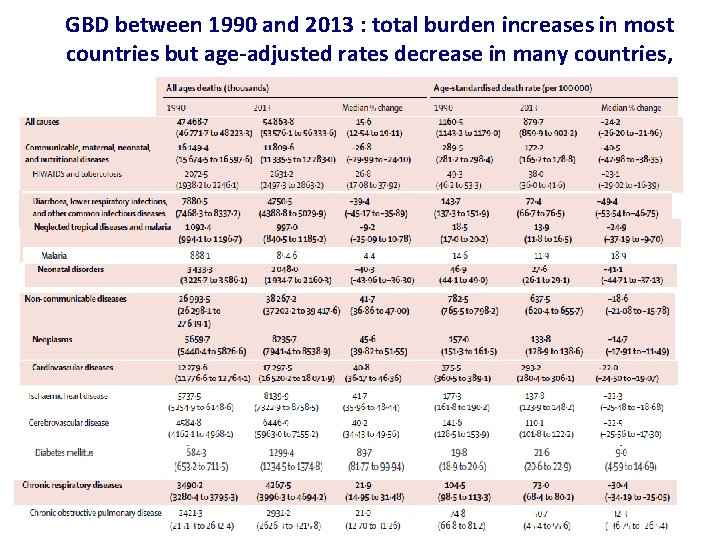
GBD between 1990 and 2013 : total burden increases in most countries but age-adjusted rates decrease in many countries,
- Slides: 96