Population APHG Population Key Issues Where is the


 (Some books show a 3")
 Population")
 but death rates decline (to")
 Death rates decline")
 Population growth")


 Relatively Developed (rich) What stage goes with each pyramid?")


 Population growing exponentially and resources growing")
 Population growth compels subsistence farmers to")


- Slides: 62
Population APHG
Population Key Issues Where is the world’s population distributed? Where has the world’s population increased? Why is population increasing at different rates in different countries? Why might the world face an overpopulation problem?
Population Terms Demography - The scientific study of population characteristics. Example: Birth Rates, Death Rates, Growth in More Developed –v- Developing. Overpopulation- The number of people in an area exceeds the capacity of the environment to support life at a decent standard of living. Density - The frequency with which something exists within a given unit of area
Distribution and Density
The World and the Top 10 – 2011 & 2016 2011 World China India United States Indonesia Brazil Pakistan Nigeria Bangladesh Russia Japan 6, 987, 000 1, 346, 000 1, 241, 000 312, 000 238, 000 198, 000 177, 000 162, 000 151, 000 143, 000 128, 000 2016 World China India United States Indonesia Brazil Pakistan Nigeria Bangladesh Russia Mexico 7, 418, 000 1, 378, 000 1, 329, 000 324, 000 259, 000 206, 000 203, 000 187, 000 163, 000 144, 000 129, 000
Population Growth Video
Population Distribution – Descriptions of locations on the Earth’s surface where individuals or groups (depending on the scale) live. Dot Map of World Population – On this map, one dot represents 100, 000 people
Countries are displayed by size of population rather than land area. Countries named have at least 50 million people.
World Population Clusters Two-thirds of the world’s population are concentrated in four regions: 1. East Asia (East China, Japan, S. Korea, Taiwan) - 1/5 of world population here 2. South Asia (India, Pakistan, Bangladesh) - bound by the Himalayas and a desert in Pakistan 3. Southeast Asia (Indonesia, Vietnam, Philippines) 4. Europe - population is concentrated in cities
East Asia
South Asia
Southeast Asia
Europe
North America
Ecumene The portion of Earth's surface occupied by permanent human settlement. Increased over time ¾ of world population lives on only 5% of the Earth’s surface
Population Distribution Densely populated regions Low lands Fertile soil Temperate climate Sparsely Populated Regions dry lands wet lands high lands cold lands
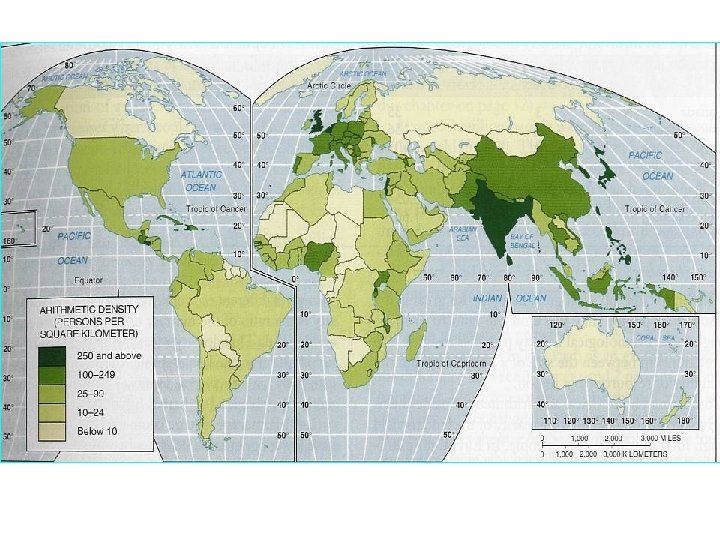
Population Why is population increasing at different rates in different countries? Arithmetic Density Physiological Density Agricultural Density
Density Arithmetic Density: The total number of people divided by the total land area. Examples: Juneau Alaska – largest city in the US – by land area (3, 225 Sq. Miles – 32, 660).
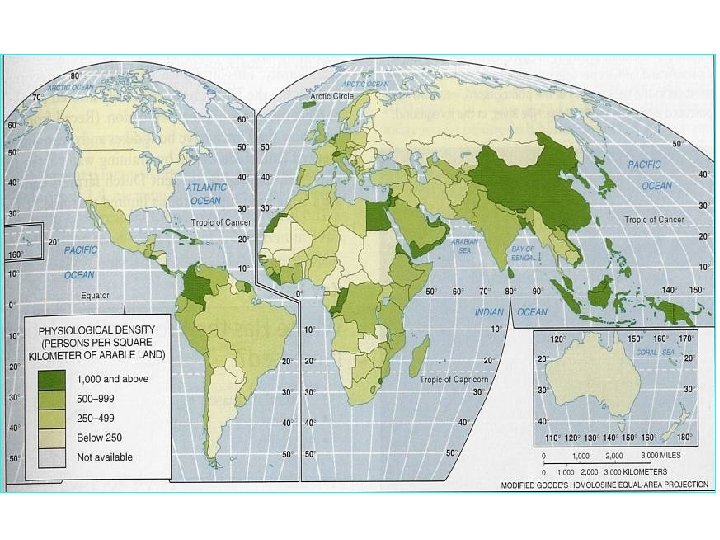
Density Physiological Density: The number of people per unit of area of arable land, which is land suitable for agriculture. Example: Singapore 982, 641.
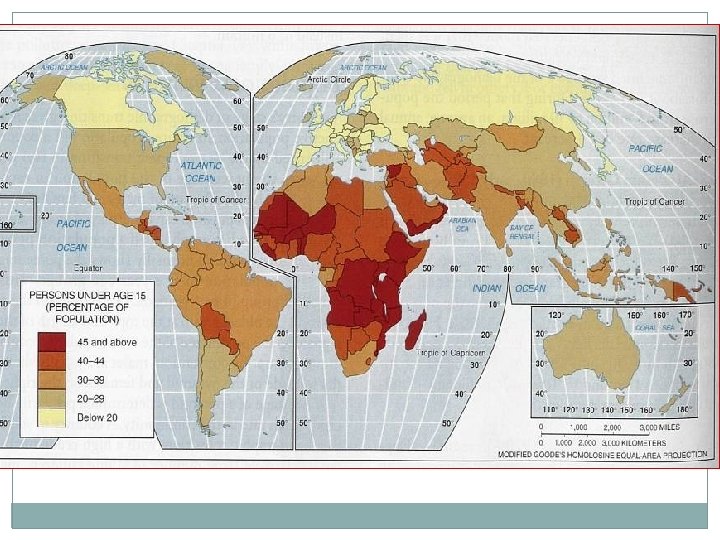
Egypt’s population distribution is closely linked to the proximity of water. In the north, the population clusters along the Mediterranean and in the interior, along the banks of the Nile River. (2004)
Density Agricultural Density: The ratio of the number of farmers to the total amount of land suitable for agriculture. US –v- India
Demographic Transition Why is population increasing at different rates in different countries?
Stages in Classic 4 -Stage Demographic Transition Model (DTM) (Some books show a 3 -stage model; others mention a new 5 th stage)
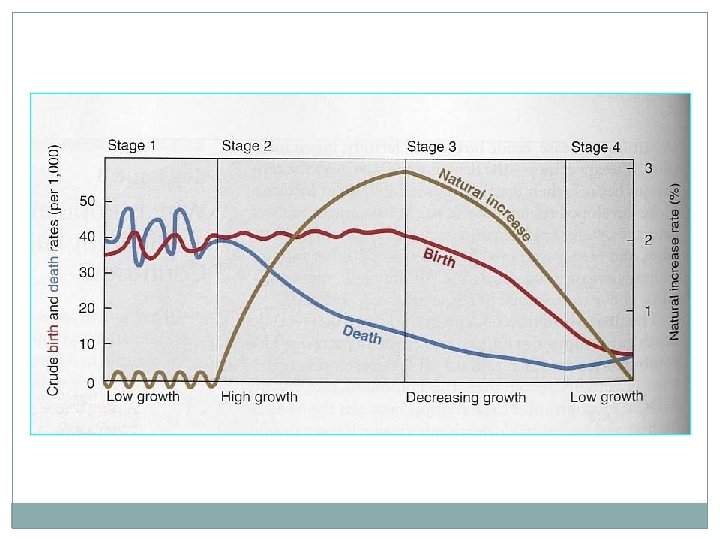
Stage 1: “Pre-Industrial” High birth rates and high death rates (both about 40) Population growth very slow Agrarian (Agricultural) society High rates of communicable diseases Pop. increases in good growing years; declines in bad years (famine, diseases) No country or world region still in Stage One
Stage 2: “Early Industrial” High birth rates (over 30) but death rates decline (to about 20) Huge population growth. RNIs increase sharply (pop. explosion); growth rate increases throughout Stage Two Growth not from increase in births, but from decline in deaths MDCs = starts early 1800 s LDCs = starts after 1950 s
Stage 3: “Later Industrial” Birth rates decline sharply (to about 15) Death rates decline a bit more (to about 10 or less) Note growth still occurs, but at a reduced and declining rate MDCs = starts in late 1800 s LDCs = starts after 1980 s* * Or hasn’t started yet
Stage 4: “Post-Industrial” Birth rates and death rates both low (about 10) Population growth very low or zero MDCs = starts after 1970 s LDCs = hasn’t started yet Stage 5 (? ): Hypothesized (not in Classic DTM) Much of Europe now or soon in population decline as birth rates drop far below replacement level
Demographic Transition Model Draw it! Stages: 1 -5 and growth / CBR / CDR / NIR / Total Population Label the following countries: Afghanistan Germany Zambia Jordan Afghanistan Ukraine Uruguay Canada Mexico Hungary (Is that a country? ) Iraq
Population Pyramids Video
Dependency Ratio Dependency ratio The number of people under the age of 15 and over age 64, compared to the number of people active in the labor force. 0 -15 = Dependents 16 -64 = Workers 65+ = Dependents DR = Number of Dependents (0 -15 and 65+) X 100 Number of Working-age (16 -64) Example: Too many old people (Eastern Europe) or too many young people (Sub-Saharan Africa) can cause problems.
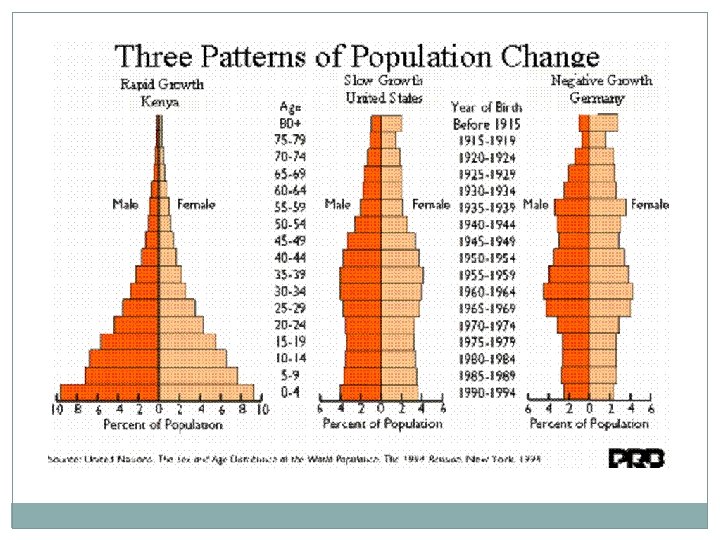
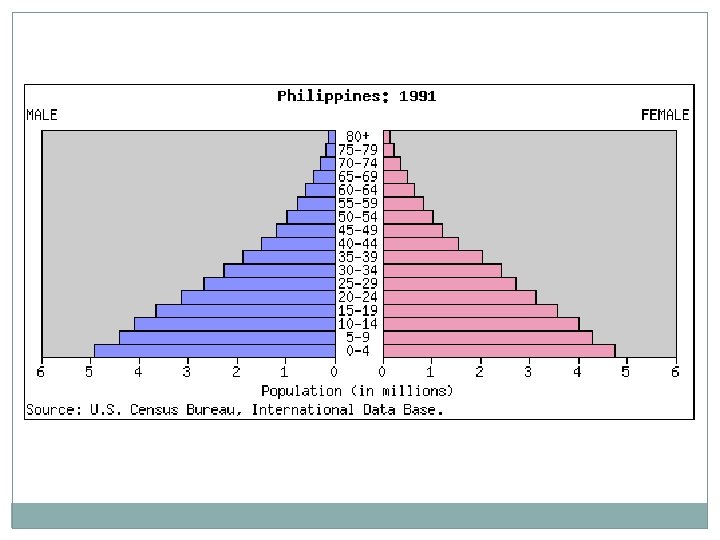
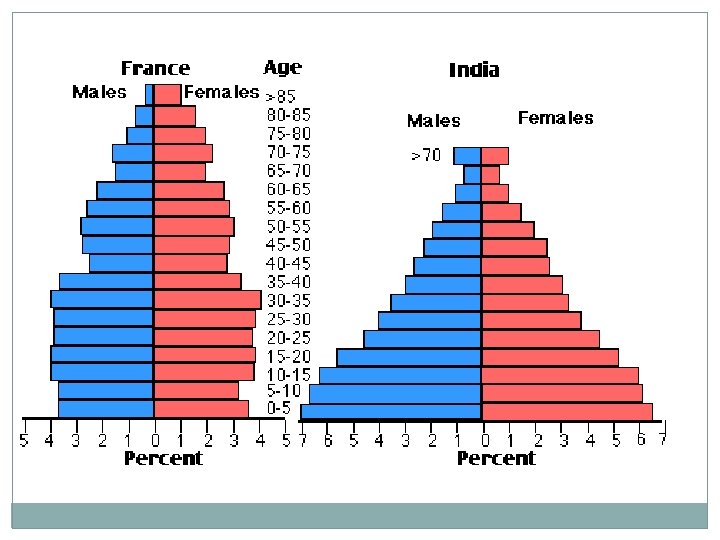
Population Pyramids A country’s stage in Demographic Transition gives it a distinctive population structure Also called Age-Sex Pyramids
Rapid Growth
Slow Growth
No Growth End of stage 4 Large number of “older people” Very small % of young people
Developing (poor) Relatively Developed (rich) What stage goes with each pyramid?
National Scale
Population Pyramids Video
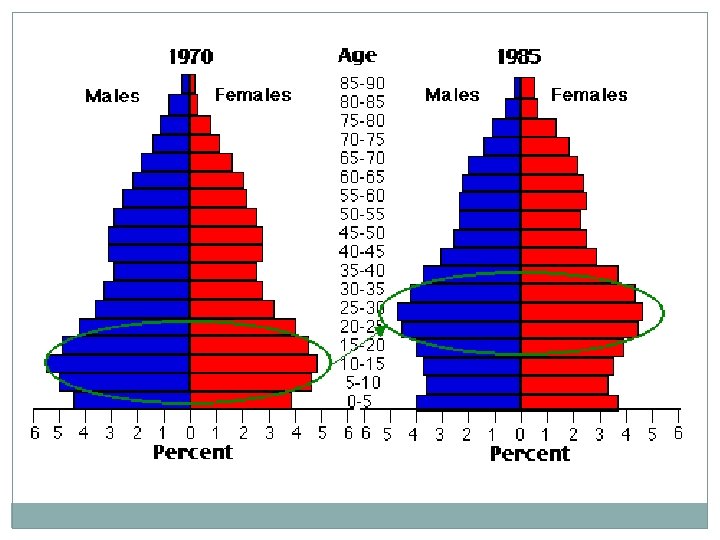
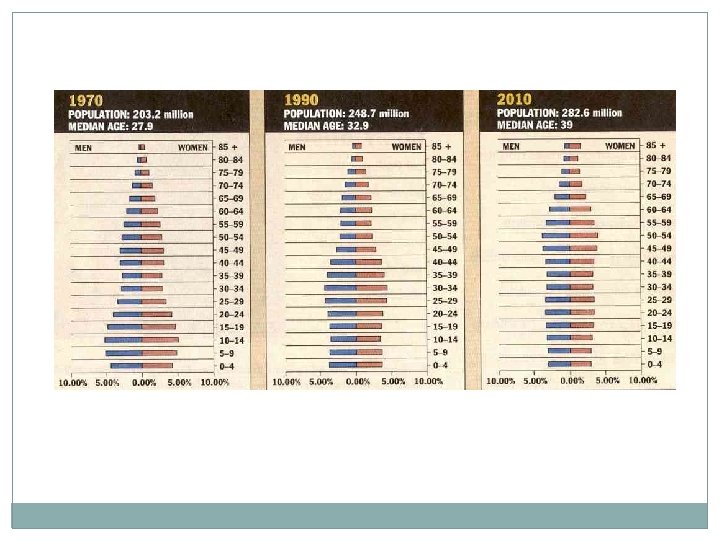
Population Pyramids Baby Boom A cohort of individuals born in the United States between 1946 and 1964, which was just after World War II in a time of relative peace and prosperity. Echo Boom The generation born after the baby boomers; the "echo" of a generation boom (1980 s-1990 s)
Demographic Momentum Tendency for growing population to continue growing after a fertility decline bc of their young age distribution. This is important because once this happens a country moves to a different stage in the demographic transition model.
Why might the world face an overpopulation problem? Population Control
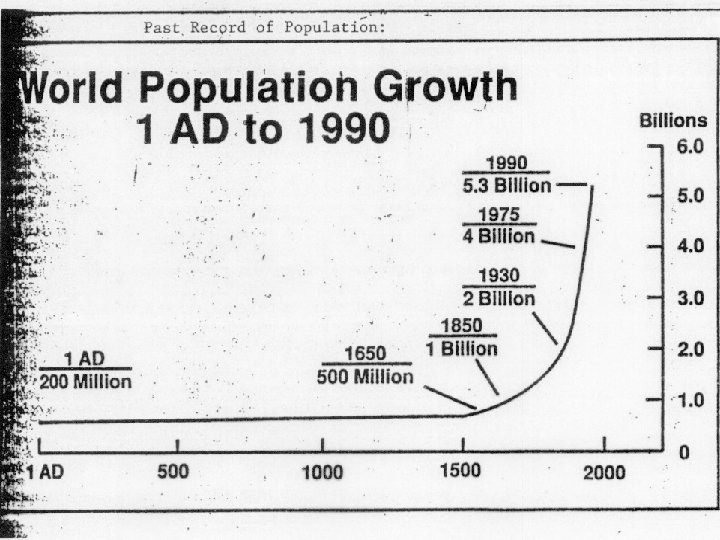
A Population Bomb? Thomas Malthus (1766 -1834, England) Population growing exponentially and resources growing linearly.
A Population Bomb? Esther Boserup (1910 - 1999) Population growth compels subsistence farmers to consider new farming approaches that produce enough food to take care of the additional people.
Five stage Model
Epidemiological Transition Model Epidemiological Transition Distinctive causes of death in each stage of the demographic transition.
Stage 1: Epidemics: Infectious and parasitic diseases, famine Ex: Black Plague
Stage 2: Receding Pandemics Ex: Cholera, Smallpox
Stage 3: Degenerative and humancreated disease Ex: Cardiovascular disease and Cancer
Stage 4: Delayed degenerative diseases Ex: Alzheimer's, Diabetes
Epidemiological Transition Model Stage 5? Re-emerging infectious and parasitic disease Ex: Malaria, TB, Swine Flu, AIDS, Ebola, Zeka
Slowing Growth How to change the J-Curve into an S-Curve: Educate Women Reduce Child Mortality Anti-Natalism Eugenics not an option Eugenics - the science of improving a human population by controlled breeding to increase the occurrence of desirable heritable characteristics. Example – Nazi Germany
Anti-Natalist Policies Anti-Natalism An attitude that asserts a negative value towards birth in order to limit population growth. Example Cold War communism in Eastern Europe China Population Pyramid Video 2
Pro-Natalist –v- Anti-Natalist Policies Pro-Natalism An attitude that encourages childbearing. Example: Japan, France and present day Russia Japan Video