Paravalvular Leaks PostTranscatheter Aortic Valve Replacement Philippe Gnreux




- Slides: 73
Paravalvular Leaks Post-Transcatheter Aortic Valve Replacement Philippe Généreux, MD Director, Angiographic Core Laboratory Columbia University Medical Center and the Cardiovascular Research Foundation, New York, NY Assistant Professor of Medicine, Interventional Cardiologist, Director, Transcatheter Aortic Valve Implantation program Hôpital du Sacré-Coeur de Montréal, Québec, Canada
Disclosure Statement of Financial Interest I, Philippe Généreux, DO NOT have a I, financial interest/arrangement or affiliation with one or more organizations that could be perceived as a real or apparent conflict of interest in the context of the subject of this presentation.
Disclosure Statement of Financial Interest • Susheel Kodali has received consulting fees from Edwards Lifesciences and St-Jude. Pieter Kappetein is member of steering committee of the SURTAVI trial sponsored by Medtronic. Martin B. Leon is a nonpaid member of the Scientific Advisory Board of Edwards Lifesciences. The other authors report no conflicts.
Paravalvular Leak (PVL) after Transcatheter Aortic Valve Replacement (TAVR): The new Achilles’ heel? A Comprehensive Review of the literature. Philippe Généreux, MD 1, 2, 3 *, Stuart J. Head, MSc 4 *, Rebecca Hahn, MD 1, 2, Benoit Daneault, MD 1, 2, , Susheel Kodali, MD 1, 2, Mathew R. Williams, MD 1, 2, Nicolas M. van Mieghem, MD 5, Maria C. Alu, MM 1, Patrick W. Serruys, MD, Ph. D 5, A. Pieter Kappetein, MD, Ph. D 4, Martin B. Leon, MD 1, 2. 1. Columbia University Medical Center/New York Presbyterian Hospital, New York, NY, USA; 2. The Cardiovascular Research Foundation, New York, NY, USA; 3. Hôpital du Sacré-Coeur de Montréal, Canada, 4. Department of Cardiothoracic Surgery, Erasmus University Medical Center, Rotterdam, The Netherlands, 5. Department of Cardiology, Erasmus University Medical Center, Rotterdam, The Netherlands Généreux et al. J Am Coll Cardiol 2013
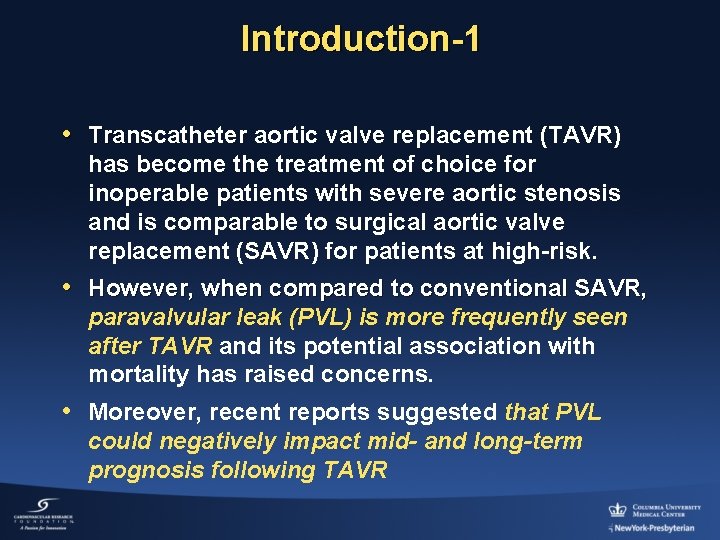
Introduction-1 • Transcatheter aortic valve replacement (TAVR) Tran has become the treatment of choice for inoperable patients with severe aortic stenosis and is comparable to surgical aortic valve replacement (SAVR) for patients at high-risk. • However, when compared to conventional SAVR, paravalvular leak (PVL) is more frequently seen after TAVR and its potential association with mortality has raised concerns. • Moreover, recent reports suggested that PVL could negatively impact mid- and long-term prognosis following TAVR
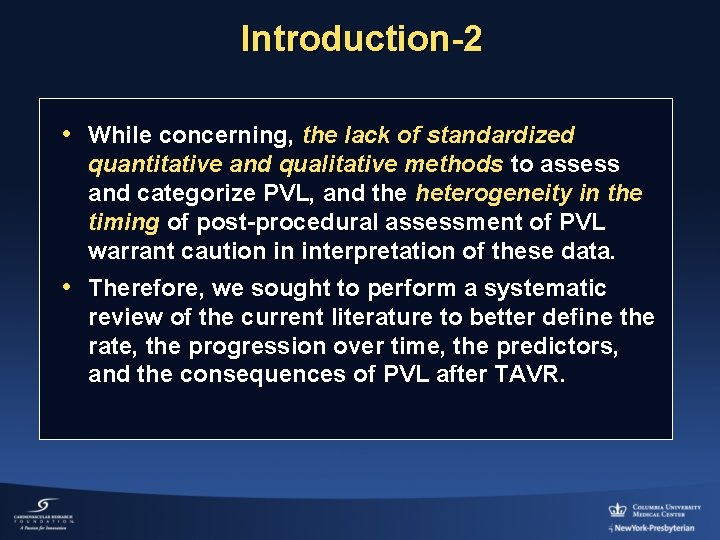
Introduction-2 • While concerning, the lack of standardized quantitative and qualitative methods to assess and categorize PVL, and the heterogeneity in the timing of post-procedural assessment of PVL warrant caution in interpretation of these data. • Therefore, we sought to perform a systematic review of the current literature to better define the rate, the progression over time, the predictors, and the consequences of PVL after TAVR.
Incidence of PVL
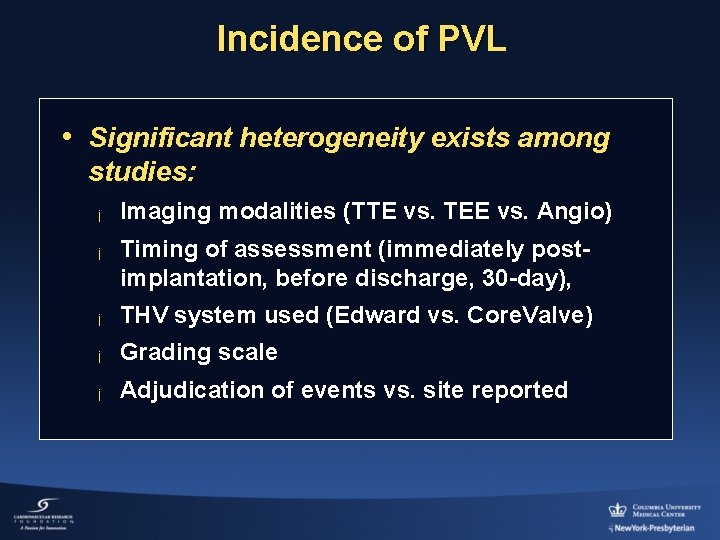
Incidence of PVL • Significant heterogeneity exists among studies: ¡ Imaging modalities (TTE vs. TEE vs. Angio) ¡ Timing of assessment (immediately postimplantation, before discharge, 30 -day), ¡ THV system used (Edward vs. Core. Valve) ¡ Grading scale ¡ Adjudication of events vs. site reported
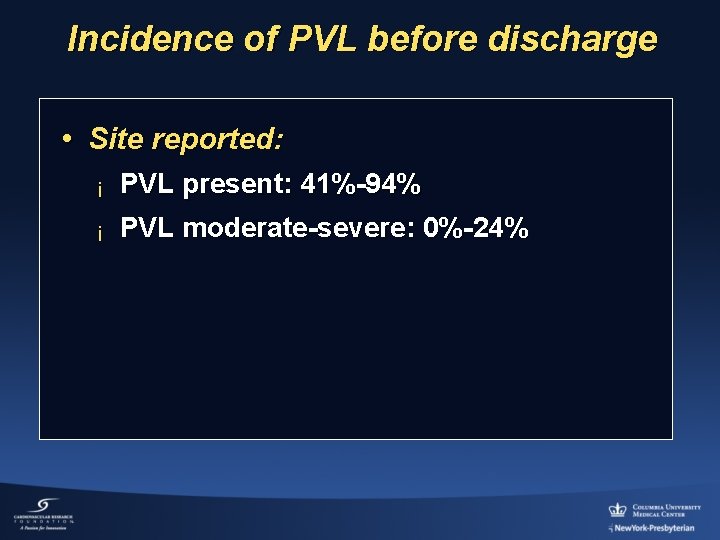
Incidence of PVL before discharge • Site reported: ¡ PVL present: 41%-94% ¡ PVL moderate-severe: 0%-24%
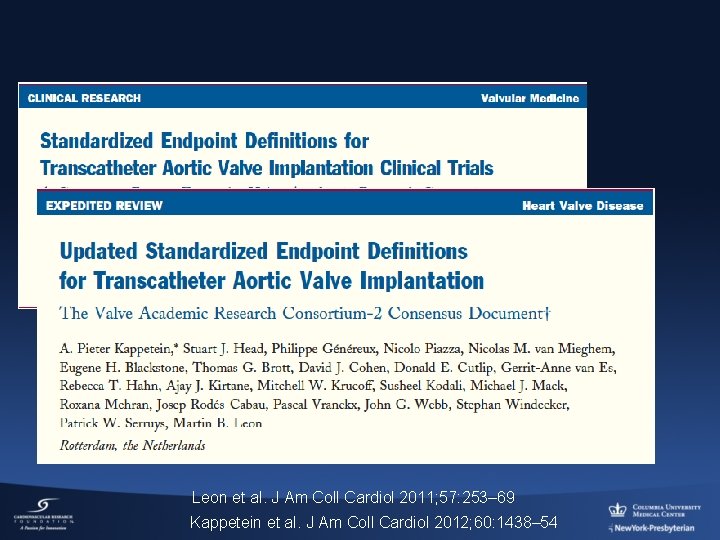
Leon et al. J Am Coll Cardiol 2011; 57: 253– 69 Kappetein et al. J Am Coll Cardiol 2012; 60: 1438– 54
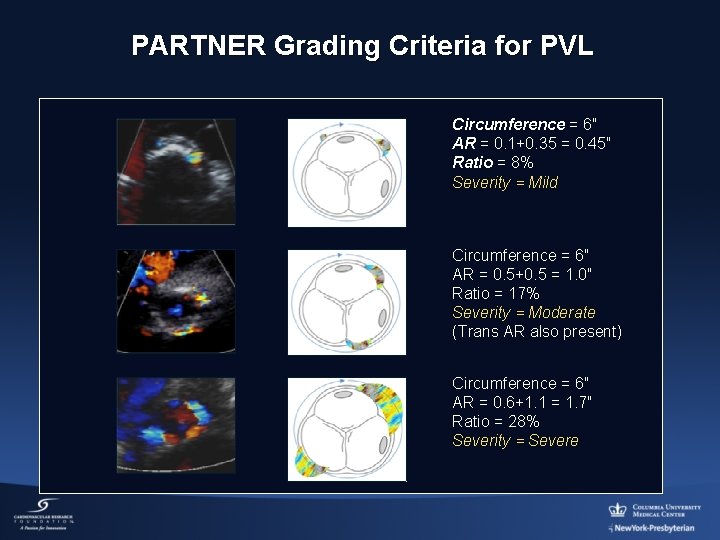
PARTNER Grading Criteria for PVL Circumference = 6″ AR = 0. 1+0. 35 = 0. 45″ Ratio = 8% Severity = Mild Circumference = 6″ AR = 0. 5+0. 5 = 1. 0″ Ratio = 17% Severity = Moderate (Trans AR also present) Circumference = 6″ AR = 0. 6+1. 1 = 1. 7″ Ratio = 28% Severity = Severe
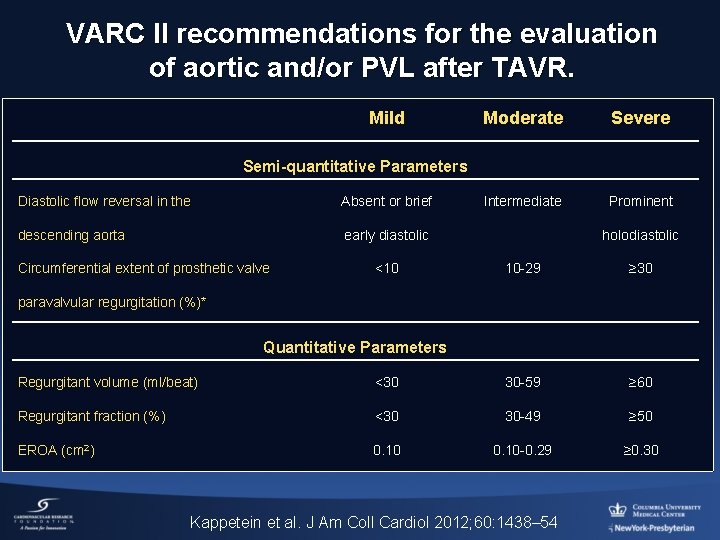
VARC II recommendations for the evaluation of aortic and/or PVL after TAVR. Mild Moderate Severe Intermediate Prominent Semi-quantitative Parameters Diastolic flow reversal in the Absent or brief descending aorta early diastolic Circumferential extent of prosthetic valve <10 holodiastolic 10 -29 ≥ 30 paravalvular regurgitation (%)* Quantitative Parameters Regurgitant volume (ml/beat) <30 30 -59 ≥ 60 Regurgitant fraction (%) <30 30 -49 ≥ 50 EROA (cm 2) 0. 10 -0. 29 ≥ 0. 30 Kappetein et al. J Am Coll Cardiol 2012; 60: 1438– 54
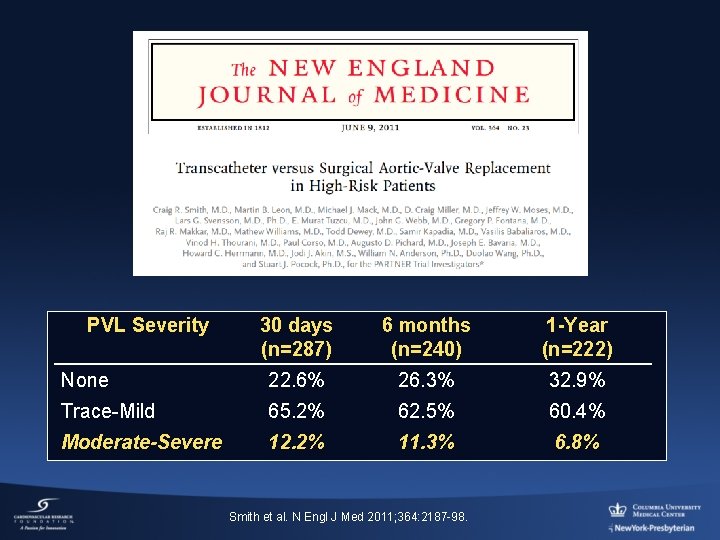
PVL Severity 30 days (n=287) 6 months (n=240) 1 -Year (n=222) None 22. 6% 26. 3% 32. 9% Trace-Mild 65. 2% 62. 5% 60. 4% Moderate-Severe 12. 2% 11. 3% 6. 8% Smith et al. N Engl J Med 2011; 364: 2187 -98.
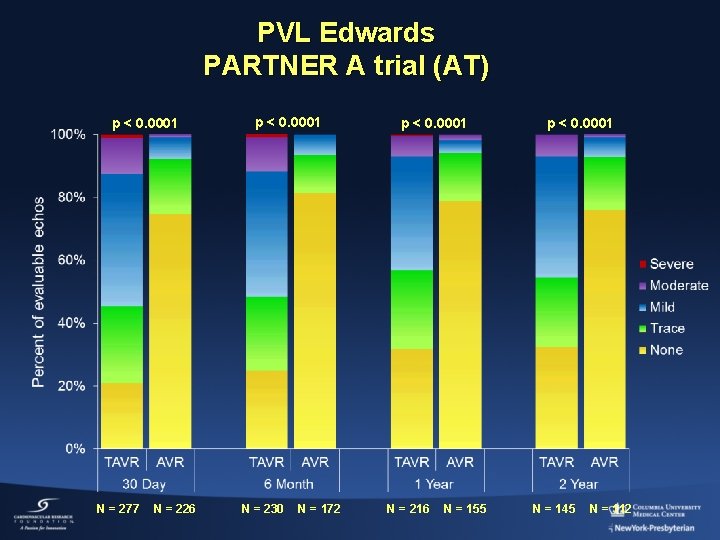
PVL Edwards PARTNER A trial (AT) p < 0. 0001 N = 277 N = 226 p < 0. 0001 N = 230 N = 172 p < 0. 0001 N = 216 N = 155 p < 0. 0001 N = 145 N = 112
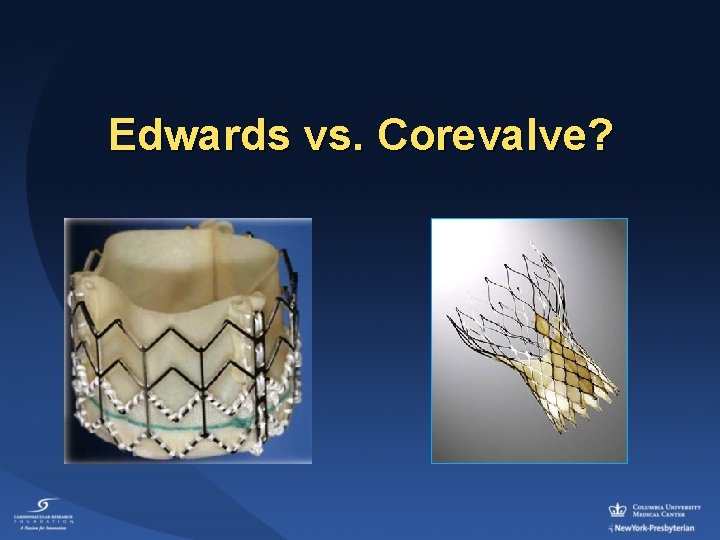
Edwards vs. Corevalve?
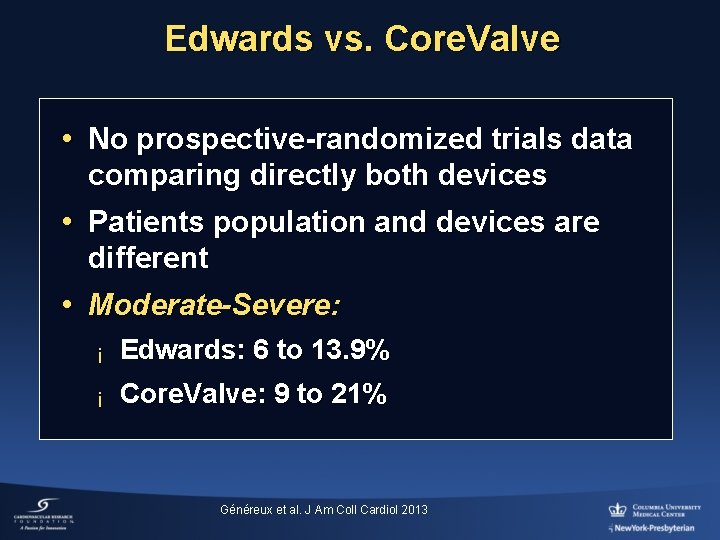
Edwards vs. Core. Valve • No prospective-randomized trials data comparing directly both devices • Patients population and devices are different • Moderate-Severe: ¡ Edwards: 6 to 13. 9% ¡ Core. Valve: 9 to 21% Généreux et al. J Am Coll Cardiol 2013
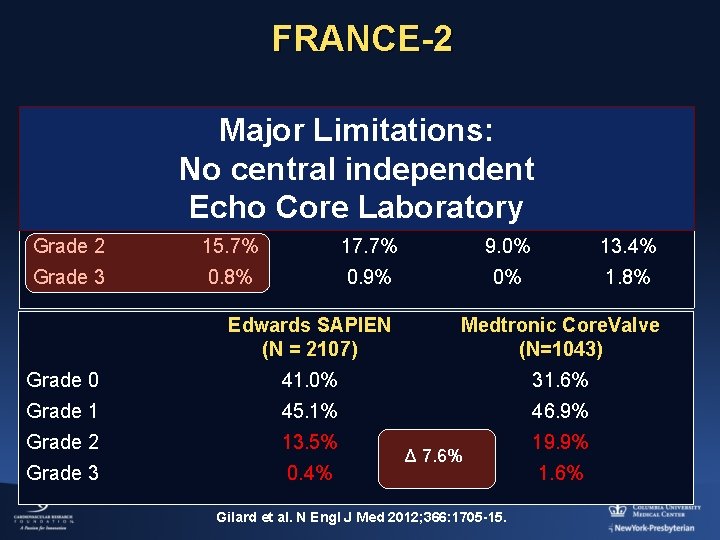
FRANCE-2 TF TA Major Limitations: (N = 2361) (N = 567) No central independent 37. 8% 34. 1% 51. 8% Echo Core Laboratory 45. 7% 47. 3% 39. 2% All (N=3195) Grade 0 Grade 1 SC (N = 184) 33. 0% 51. 9% Grade 2 15. 7% 17. 7% 9. 0% 13. 4% Grade 3 0. 8% 0. 9% 0% 1. 8% Edwards SAPIEN (N = 2107) Medtronic Core. Valve (N=1043) Grade 0 41. 0% 31. 6% Grade 1 45. 1% 46. 9% Grade 2 13. 5% Grade 3 0. 4% Δ 7. 6% Gilard et al. N Engl J Med 2012; 366: 1705 -15. 19. 9% 1. 6%
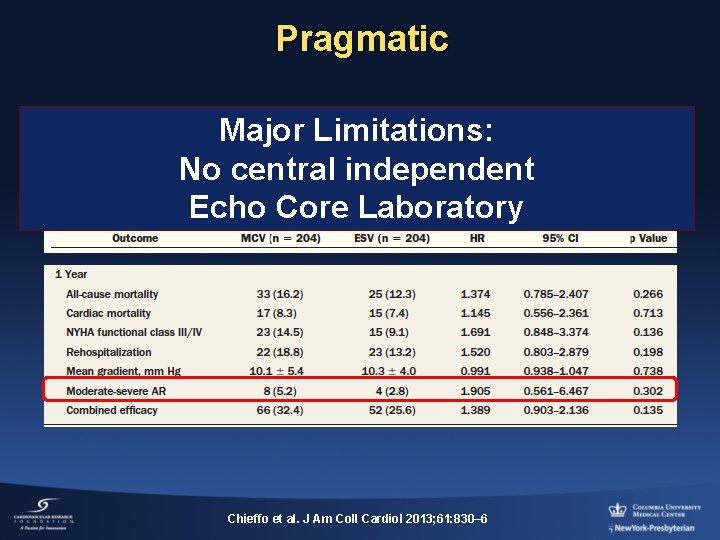
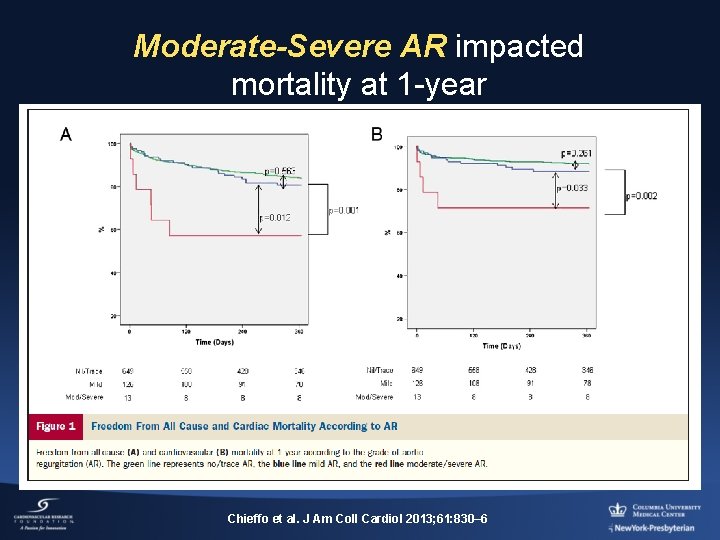
Chieffo et al. J Am Coll Cardiol 2013; 61: 830– 6
Pragmatic Major Limitations: No central independent Echo Core Laboratory Chieffo et al. J Am Coll Cardiol 2013; 61: 830– 6
Progression through time
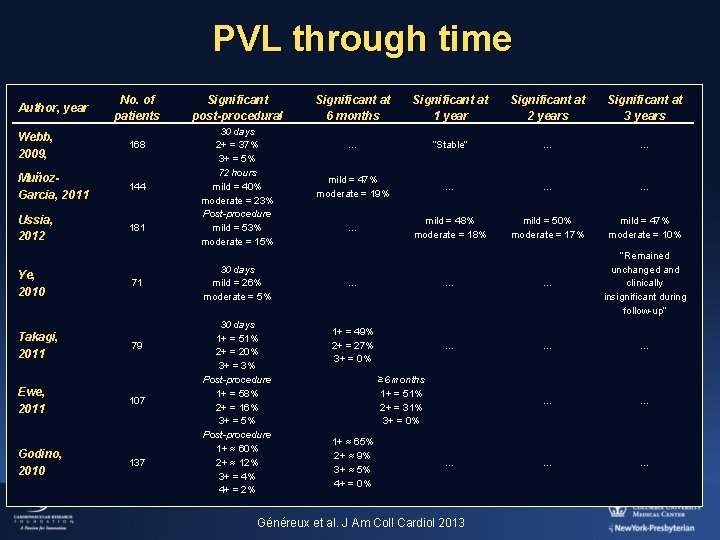
PVL through time Author, year No. of patients Webb, 2009, 168 Muñoz. Garcia, 2011 144 Ussia, 2012 181 Ye, 2010 Takagi, 2011 Ewe, 2011 Godino, 2010 71 79 107 137 Significant post-procedural 30 days 2+ = 37% 3+ = 5% 72 hours mild = 40% moderate = 23% Post-procedure mild = 53% moderate = 15% 30 days mild = 26% moderate = 5% 30 days 1+ = 51% 2+ = 20% 3+ = 3% Post-procedure 1+ = 58% 2+ = 16% 3+ = 5% Post-procedure 1+ ≈ 60% 2+ ≈ 12% 3+ = 4% 4+ = 2% Significant at 6 months Significant at 1 year Significant at 2 years Significant at 3 years … “Stable” … … mild = 47% moderate = 19% … … mild = 48% moderate = 18% mild = 50% moderate = 17% mild = 47% moderate = 10% … … … “Remained unchanged and clinically insignificant during follow-up” 1+ = 49% 2+ = 27% 3+ = 0% … … … … ≥ 6 months 1+ = 51% 2+ = 31% 3+ = 0% 1+ ≈ 65% 2+ ≈ 9% 3+ ≈ 5% 4+ = 0% … Généreux et al. J Am Coll Cardiol 2013
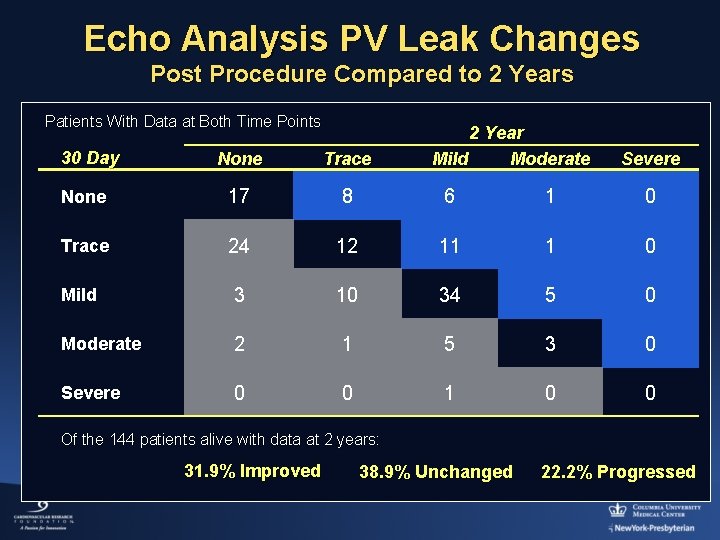
Echo Analysis PV Leak Changes Post Procedure Compared to 2 Years Patients With Data at Both Time Points 30 Day 2 Year Mild Moderate None Trace Severe None 17 8 6 1 0 Trace 24 12 11 1 0 Mild 3 10 34 5 0 Moderate 2 1 5 3 0 Severe 0 0 1 0 0 Of the 144 patients alive with data at 2 years: 31. 9% Improved 38. 9% Unchanged 22. 2% Progressed
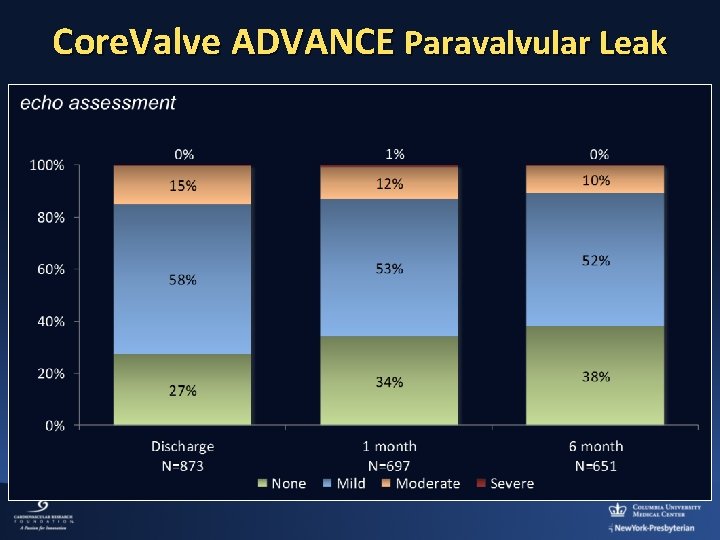
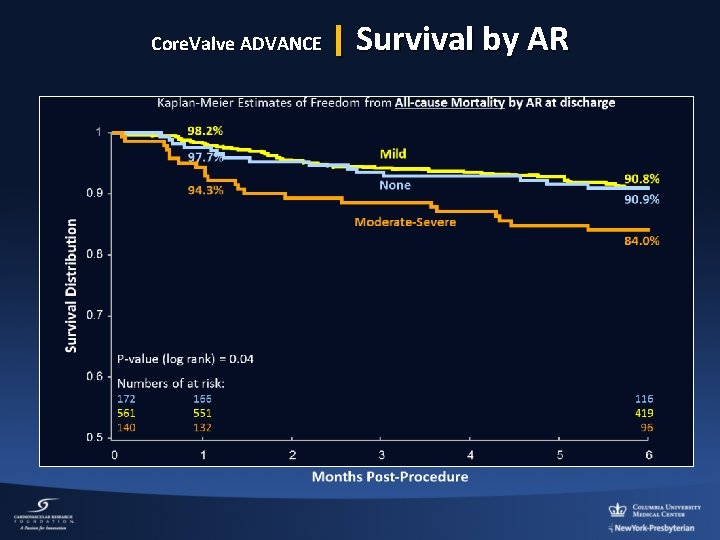
Core. Valve ADVANCE Paravalvular Leak
Impact on mortality
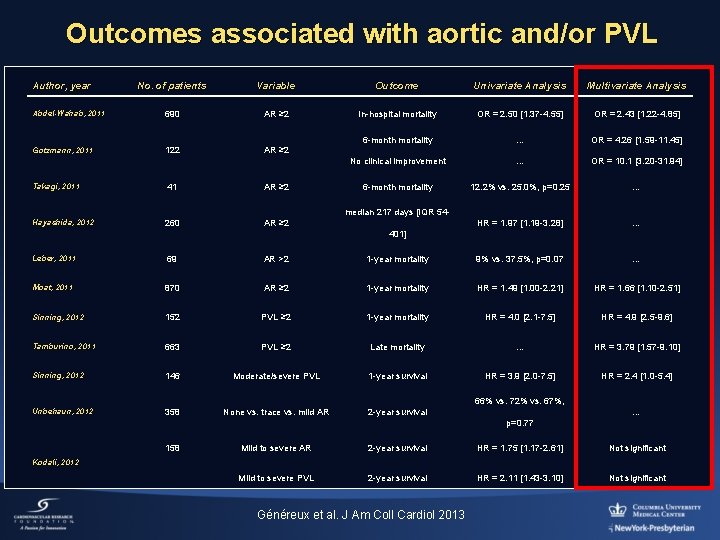
Outcomes associated with aortic and/or PVL Author, year No. of patients Variable Outcome Univariate Analysis Multivariate Analysis Abdel-Wahab, 2011 690 AR ≥ 2 In-hospital mortality OR = 2. 50 [1. 37 -4. 55] OR = 2. 43 [1. 22 -4. 85] 6 -month mortality … OR = 4. 26 [1. 59 -11. 45] Gotzmann, 2011 122 AR ≥ 2 No clinical improvement … OR = 10. 1 [3. 20 -31. 94] 6 -month mortality 12. 2% vs. 25. 0%, p=0. 25 … HR = 1. 97 [1. 19 -3. 28] … Takagi, 2011 41 AR ≥ 2 260 AR ≥ 2 median 217 days [IQR 54 Hayashida, 2012 401] Leber, 2011 69 AR >2 1 -year mortality 9% vs. 37. 5%, p=0. 07 … Moat, 2011 870 AR ≥ 2 1 -year mortality HR = 1. 49 [1. 00 -2. 21] HR = 1. 66 [1. 10 -2. 51] Sinning, 2012 152 PVL ≥ 2 1 -year mortality HR = 4. 0 [2. 1 -7. 5] HR = 4. 9 [2. 5 -9. 6] Tamburino, 2011 663 PVL ≥ 2 Late mortality … HR = 3. 79 [1. 57 -9. 10] Sinning, 2012 146 Moderate/severe PVL 1 -year survival HR = 3. 9 [2. 0 -7. 5] HR = 2. 4 [1. 0 -5. 4] Unbehaun, 2012 358 None vs. trace vs. mild AR 2 -year survival 66% vs. 72% vs. 67%, … p=0. 77 158 Mild to severe AR 2 -year survival HR = 1. 75 [1. 17 -2. 61] Not significant Mild to severe PVL 2 -year survival HR = 2. 11 [1. 43 -3. 10] Not significant Kodali, 2012 Généreux et al. J Am Coll Cardiol 2013
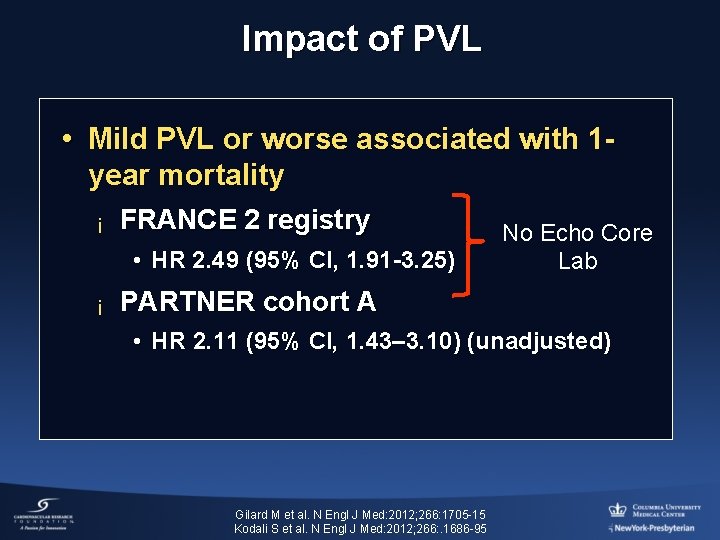
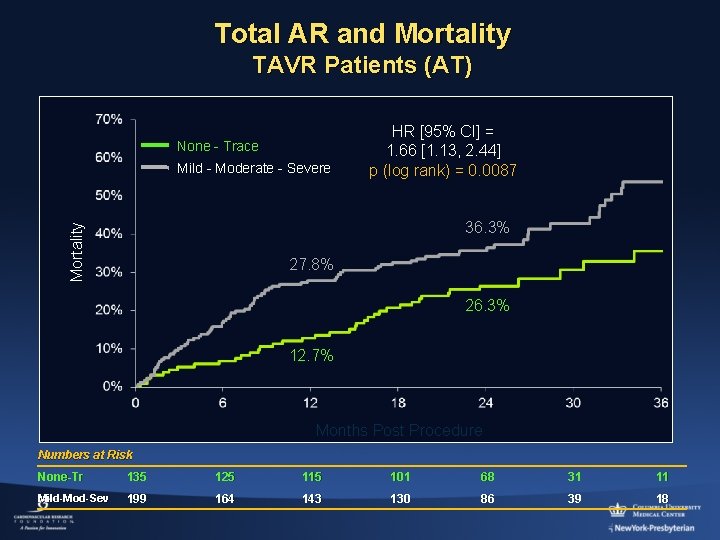
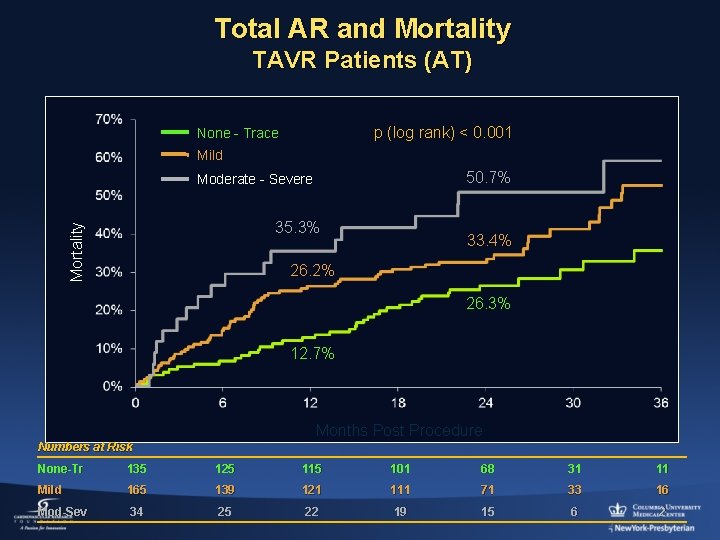
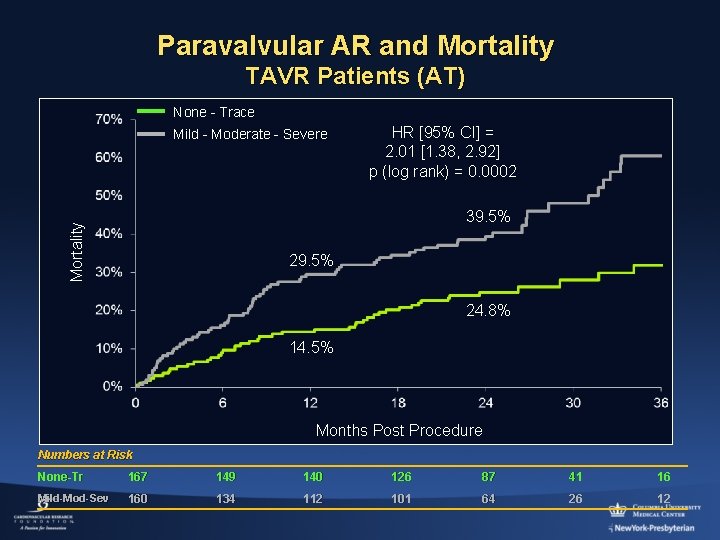
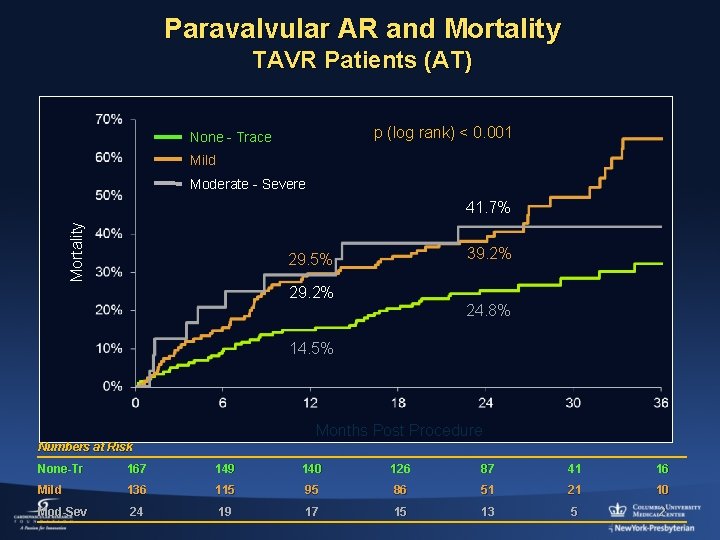
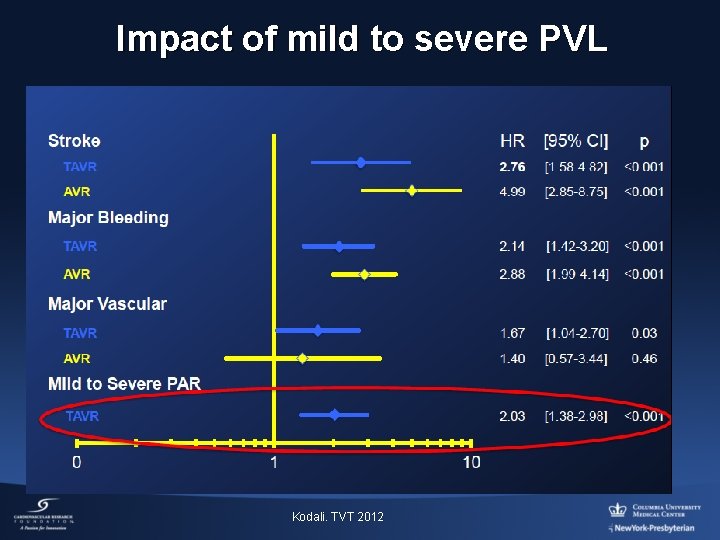
Impact of PVL • Mild PVL or worse associated with 1 year mortality ¡ FRANCE 2 registry • HR 2. 49 (95% CI, 1. 91 -3. 25) ¡ No Echo Core Lab PARTNER cohort A • HR 2. 11 (95% CI, 1. 43– 3. 10) (unadjusted) Gilard M et al. N Engl J Med: 2012; 266: 1705 -15 Kodali S et al. N Engl J Med: 2012; 266: . 1686 -95
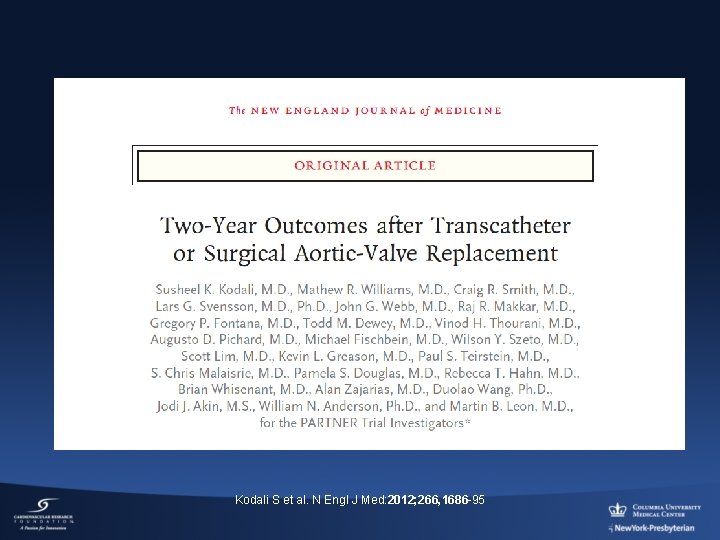
Kodali S et al. N Engl J Med: 2012; 266, 1686 -95
Total AR and Mortality TAVR Patients (AT) None - Trace Mild - Moderate - Severe HR [95% CI] = 1. 66 [1. 13, 2. 44] p (log rank) = 0. 0087 Mortality 36. 3% 27. 8% 26. 3% 12. 7% Months Post Procedure Numbers at Risk None-Tr 135 125 115 101 68 31 11 Mild-Mod-Sev 199 164 143 130 86 39 18
Total AR and Mortality TAVR Patients (AT) p (log rank) < 0. 001 None - Trace Mild 50. 7% Moderate - Severe Mortality 35. 3% 33. 4% 26. 2% 26. 3% 12. 7% Months Post Procedure Numbers at Risk None-Tr 135 125 115 101 68 31 11 Mild 165 139 121 111 71 33 16 Mod-Sev 34 25 22 19 15 6 2
Paravalvular AR and Mortality TAVR Patients (AT) None - Trace Mild - Moderate - Severe HR [95% CI] = 2. 01 [1. 38, 2. 92] p (log rank) = 0. 0002 Mortality 39. 5% 24. 8% 14. 5% Months Post Procedure Numbers at Risk None-Tr 167 149 140 126 87 41 16 Mild-Mod-Sev 160 134 112 101 64 26 12
Paravalvular AR and Mortality TAVR Patients (AT) p (log rank) < 0. 001 None - Trace Mild Moderate - Severe Mortality 41. 7% 39. 2% 29. 5% 29. 2% 24. 8% 14. 5% Months Post Procedure Numbers at Risk None-Tr 167 149 140 126 87 41 16 Mild 136 115 95 86 51 21 10 Mod-Sev 24 19 17 15 13 5 2
Impact of mild to severe PVL Kodali. TVT 2012
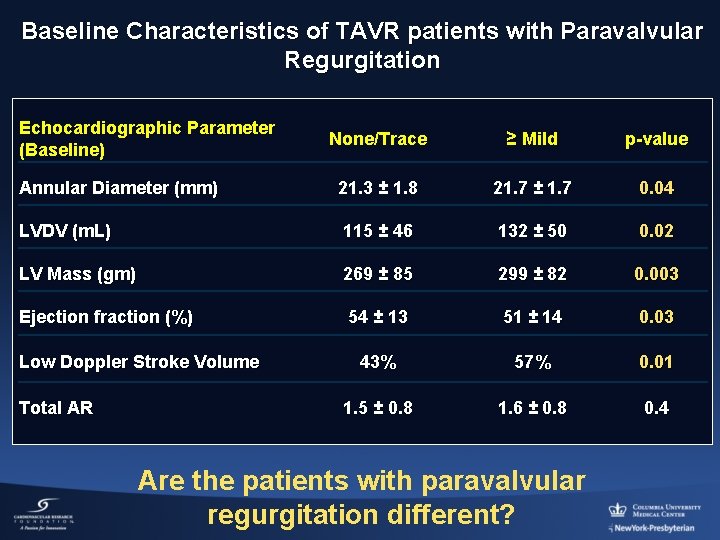
Baseline Characteristics of TAVR patients with Paravalvular Regurgitation Echocardiographic Parameter (Baseline) None/Trace ≥ Mild p-value Annular Diameter (mm) 21. 3 ± 1. 8 21. 7 ± 1. 7 0. 04 LVDV (m. L) 115 ± 46 132 ± 50 0. 02 LV Mass (gm) 269 ± 85 299 ± 82 0. 003 Ejection fraction (%) 54 ± 13 51 ± 14 0. 03 43% 57% 0. 01 1. 5 ± 0. 8 1. 6 ± 0. 8 0. 4 Low Doppler Stroke Volume Total AR Are the patients with paravalvular regurgitation different?
Core. Valve ADVANCE | Survival by AR
Chieffo et al. J Am Coll Cardiol 2013; 61: 830– 6
Moderate-Severe AR impacted mortality at 1 -year Chieffo et al. J Am Coll Cardiol 2013; 61: 830– 6
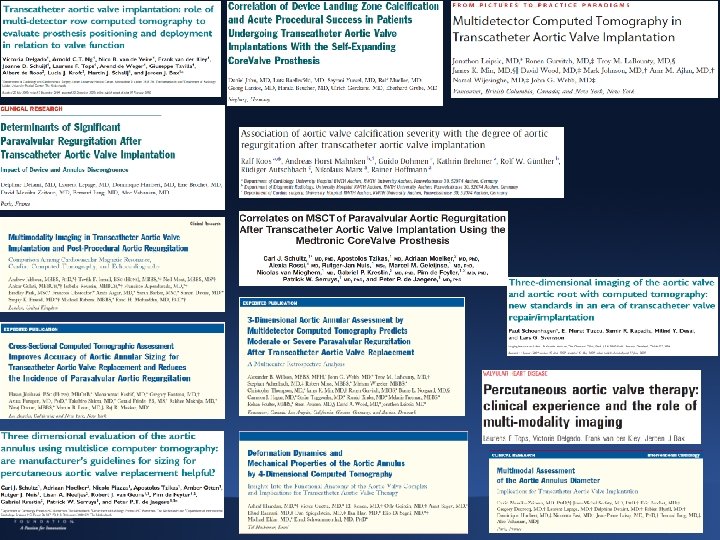
Predictors
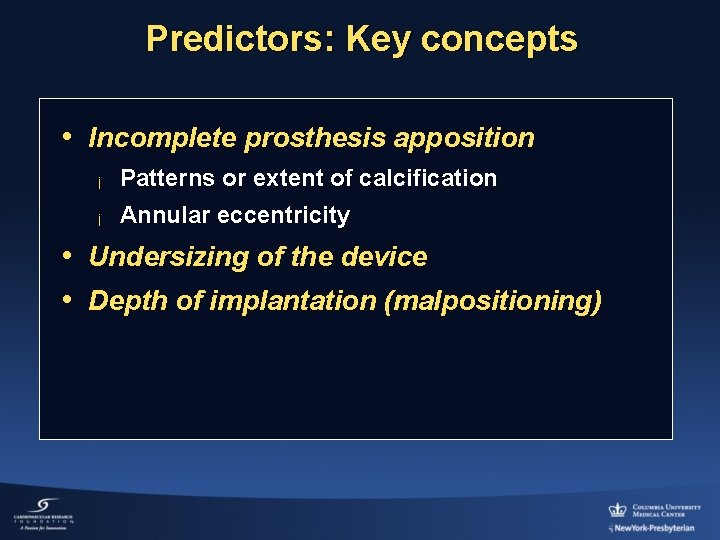
Predictors: Key concepts • Incomplete prosthesis apposition ¡ Patterns or extent of calcification ¡ Annular eccentricity • Undersizing of the device • Depth of implantation (malpositioning)
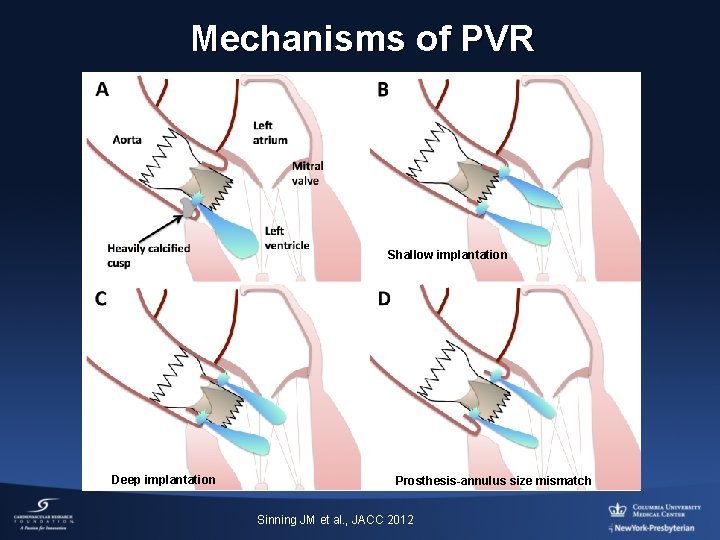
Mechanisms of PVR Shallow implantation Deep implantation Prosthesis-annulus size mismatch Sinning JM et al. , JACC 2012
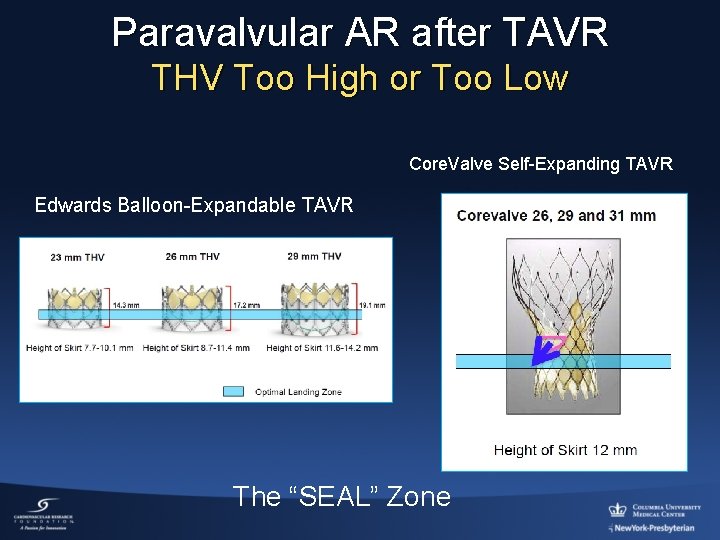
Paravalvular AR after TAVR THV Too High or Too Low Core. Valve Self-Expanding TAVR Edwards Balloon-Expandable TAVR The “SEAL” Zone
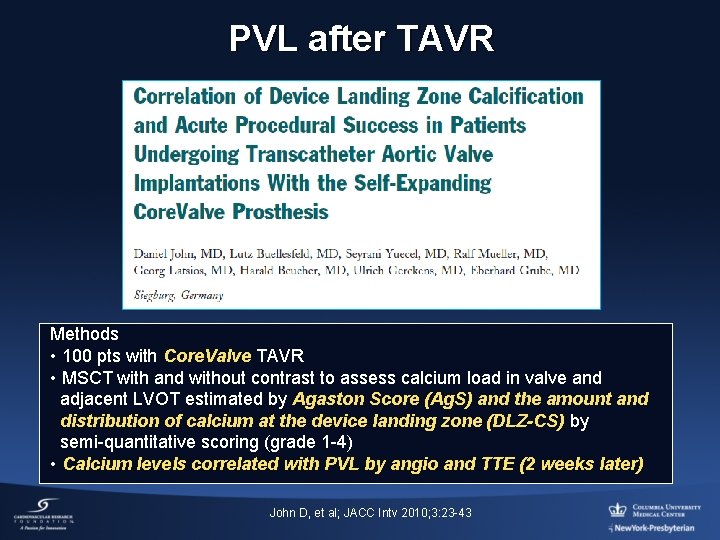
PVL after TAVR Methods • 100 pts with Core. Valve TAVR • MSCT with and without contrast to assess calcium load in valve and adjacent LVOT estimated by Agaston Score (Ag. S) and the amount and distribution of calcium at the device landing zone (DLZ-CS) by semi-quantitative scoring (grade 1 -4) • Calcium levels correlated with PVL by angio and TTE (2 weeks later) John D, et al; JACC Intv 2010; 3: 23 -43
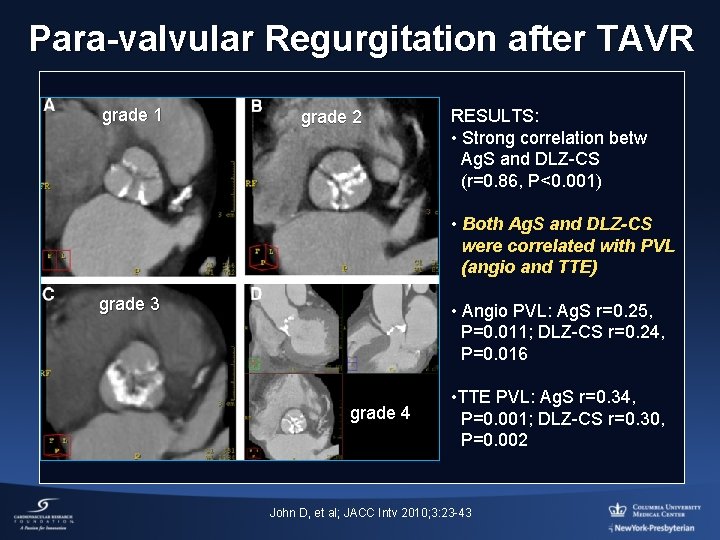
Para-valvular Regurgitation after TAVR grade 1 grade 2 RESULTS: • Strong correlation betw Ag. S and DLZ-CS (r=0. 86, P<0. 001) • Both Ag. S and DLZ-CS were correlated with PVL (angio and TTE) • Angio PVL: Ag. S r=0. 25, P=0. 011; DLZ-CS r=0. 24, P=0. 016 grade 3 grade 4 • TTE PVL: Ag. S r=0. 34, P=0. 001; DLZ-CS r=0. 30, P=0. 002 John D, et al; JACC Intv 2010; 3: 23 -43
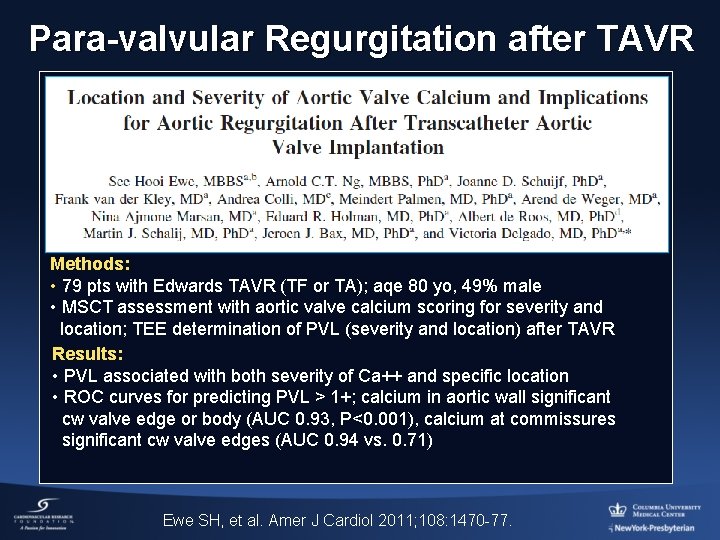
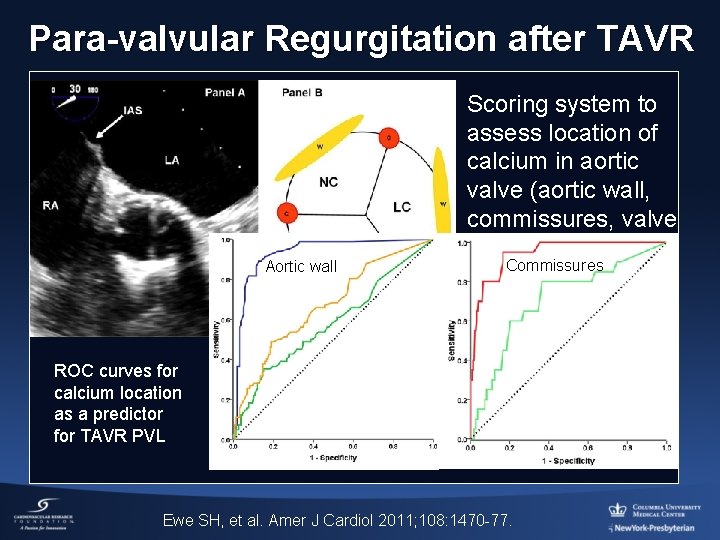
Para-valvular Regurgitation after TAVR Methods: • 79 pts with Edwards TAVR (TF or TA); aqe 80 yo, 49% male • MSCT assessment with aortic valve calcium scoring for severity and location; TEE determination of PVL (severity and location) after TAVR Results: • PVL associated with both severity of Ca++ and specific location • ROC curves for predicting PVL > 1+; calcium in aortic wall significant cw valve edge or body (AUC 0. 93, P<0. 001), calcium at commissures significant cw valve edges (AUC 0. 94 vs. 0. 71) Ewe SH, et al. Amer J Cardiol 2011; 108: 1470 -77.
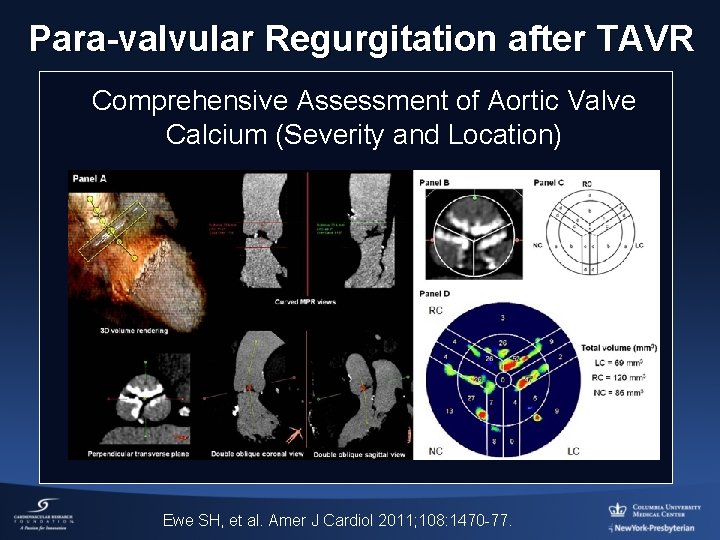
Para-valvular Regurgitation after TAVR Comprehensive Assessment of Aortic Valve Calcium (Severity and Location) Ewe SH, et al. Amer J Cardiol 2011; 108: 1470 -77.
Para-valvular Regurgitation after TAVR Aortic wall Scoring system to assess location of calcium in aortic valve (aortic wall, commissures, valve edge or valve body Commissures ROC curves for calcium location as a predictor for TAVR PVL Ewe SH, et al. Amer J Cardiol 2011; 108: 1470 -77.
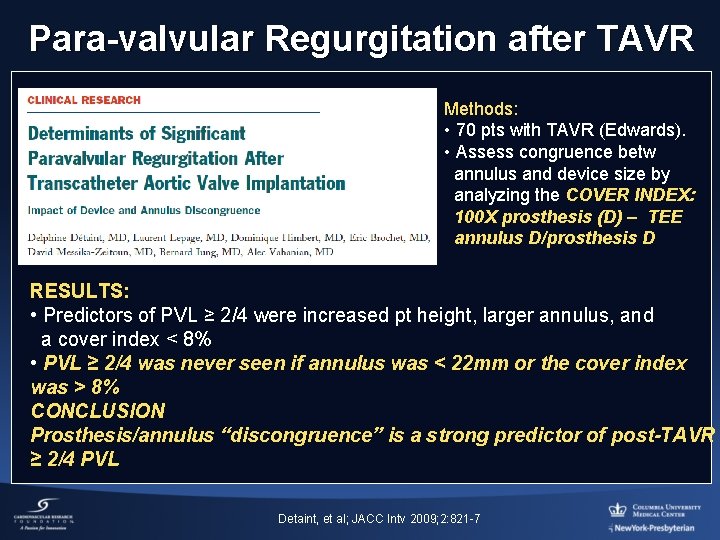
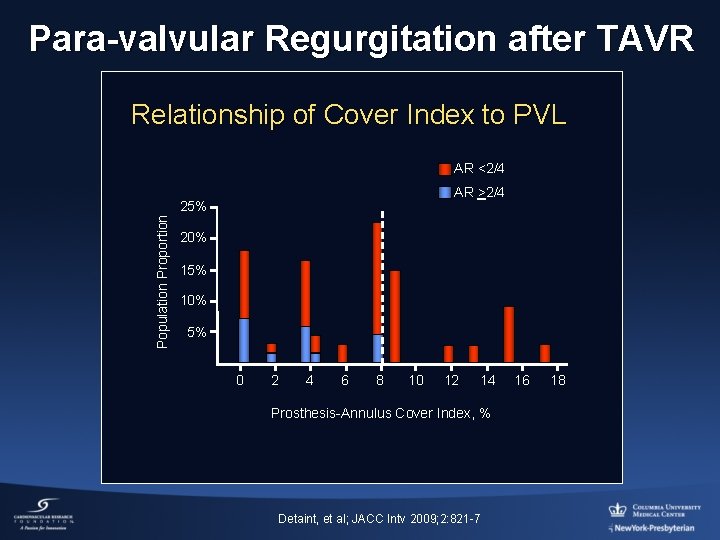
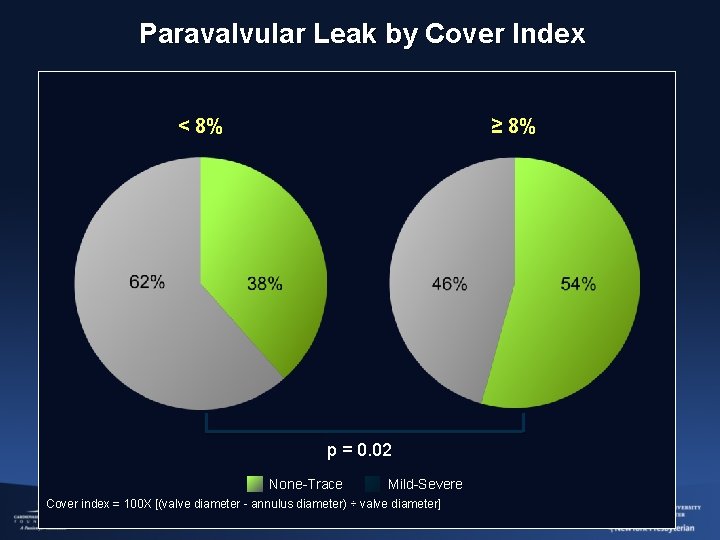
Para-valvular Regurgitation after TAVR Methods: • 70 pts with TAVR (Edwards). • Assess congruence betw annulus and device size by analyzing the COVER INDEX: 100 X prosthesis (D) – TEE annulus D/prosthesis D RESULTS: • Predictors of PVL ≥ 2/4 were increased pt height, larger annulus, and a cover index < 8% • PVL ≥ 2/4 was never seen if annulus was < 22 mm or the cover index was > 8% CONCLUSION Prosthesis/annulus “discongruence” is a strong predictor of post-TAVR ≥ 2/4 PVL Detaint, et al; JACC Intv 2009; 2: 821 -7
Para-valvular Regurgitation after TAVR Relationship of Cover Index to PVL AR <2/4 AR >2/4 Population Proportion 25% 20% 15% 10% 5% 0 2 4 6 8 10 12 14 Prosthesis-Annulus Cover Index, % Detaint, et al; JACC Intv 2009; 2: 821 -7 16 18
Paravalvular Leak by Cover Index < 8% ≥ 8% p = 0. 02 None-Trace Mild-Severe Cover index = 100 X [(valve diameter - annulus diameter) ÷ valve diameter]
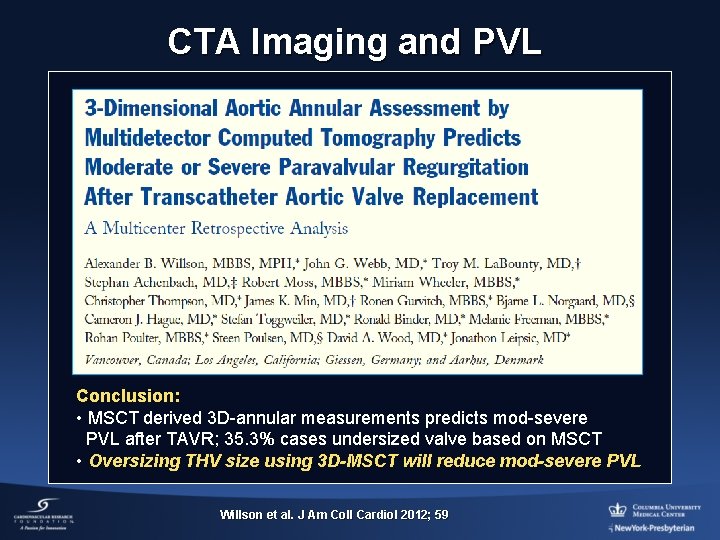
CTA Imaging and PVL Conclusion: • MSCT derived 3 D-annular measurements predicts mod-severe PVL after TAVR; 35. 3% cases undersized valve based on MSCT • Oversizing THV size using 3 D-MSCT will reduce mod-severe PVL Willson et al. J Am Coll Cardiol 2012; 59 59 Willson et al. J Am Coll Cardiol 2012;
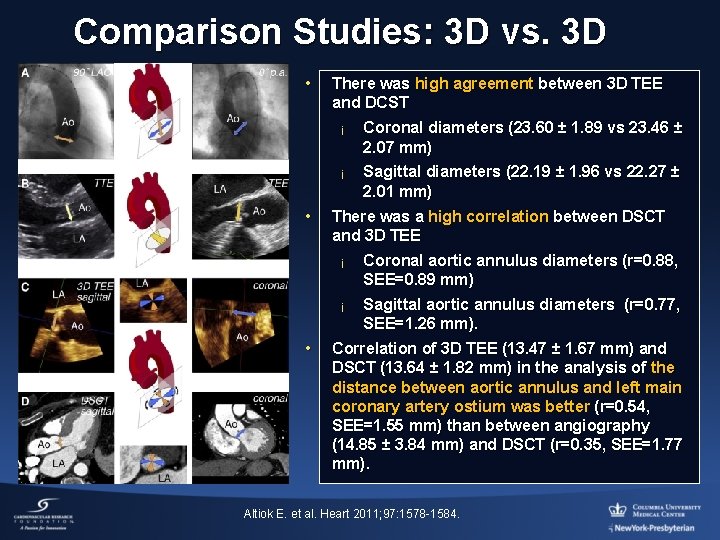
Comparison Studies: 3 D vs. 3 D • • • There was high agreement between 3 D TEE and DCST ¡ Coronal diameters (23. 60 ± 1. 89 vs 23. 46 ± 2. 07 mm) ¡ Sagittal diameters (22. 19 ± 1. 96 vs 22. 27 ± 2. 01 mm) There was a high correlation between DSCT and 3 D TEE ¡ Coronal aortic annulus diameters (r=0. 88, SEE=0. 89 mm) ¡ Sagittal aortic annulus diameters (r=0. 77, SEE=1. 26 mm). Correlation of 3 D TEE (13. 47 ± 1. 67 mm) and DSCT (13. 64 ± 1. 82 mm) in the analysis of the distance between aortic annulus and left main coronary artery ostium was better (r=0. 54, SEE=1. 55 mm) than between angiography (14. 85 ± 3. 84 mm) and DSCT (r=0. 35, SEE=1. 77 mm). Altiok E. et al. Heart 2011; 97: 1578 -1584.
How to avoid PVL
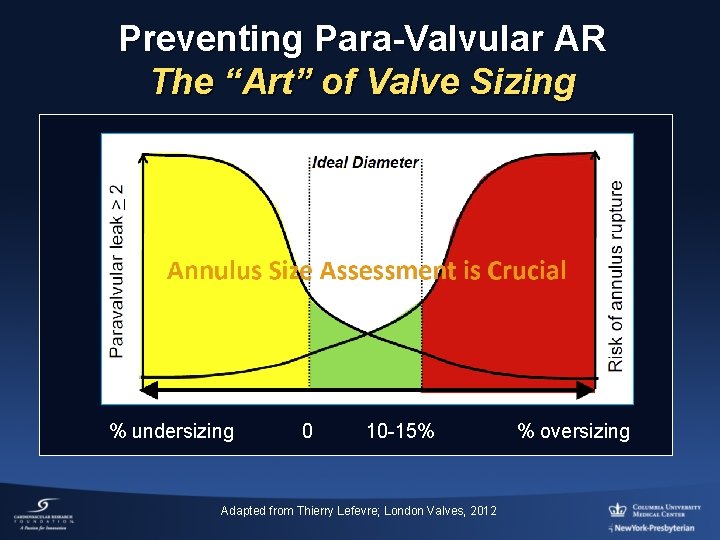
Preventing Para-Valvular AR The “Art” of Valve Sizing % undersizing 0 10 -15% Adapted from Thierry Lefevre; London Valves, 2012 % oversizing
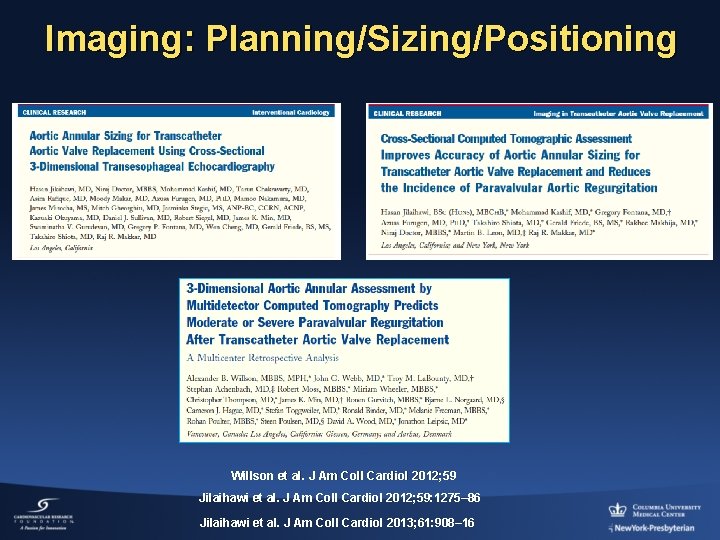
Imaging: Planning/Sizing/Positioning Willson et al. J Am Coll Cardiol 2012; 59 Willson et al. J Am Coll Cardiol Jilaihawi et al. J Am Coll Cardiol 2012; 59: 1275– 86 Jilaihawi et al. J Am Coll Cardiol 2013; 61: 908– 16
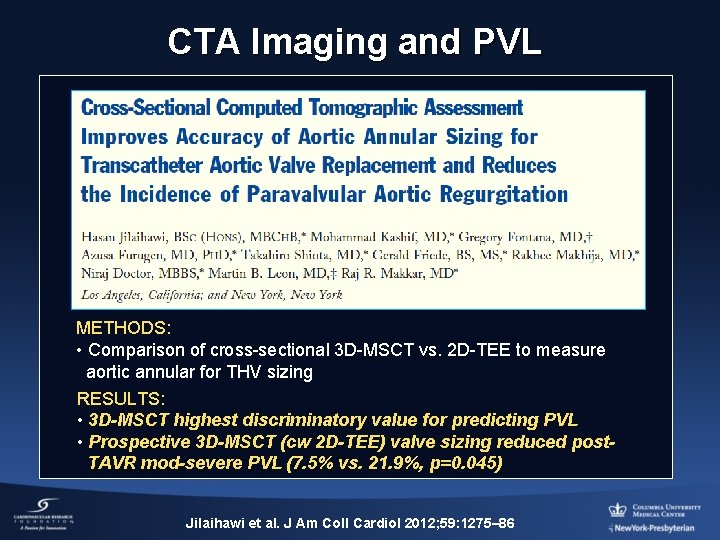
CTA Imaging and PVL METHODS: • Comparison of cross-sectional 3 D-MSCT vs. 2 D-TEE to measure aortic annular for THV sizing RESULTS: • 3 D-MSCT highest discriminatory value for predicting PVL • Prospective 3 D-MSCT (cw 2 D-TEE) valve sizing reduced post TAVR mod-severe PVL (7. 5% vs. 21. 9%, p=0. 045) Jilaihawi et al. J Am Coll Cardiol 2012; 59: 1275– 86
How to manage PVL
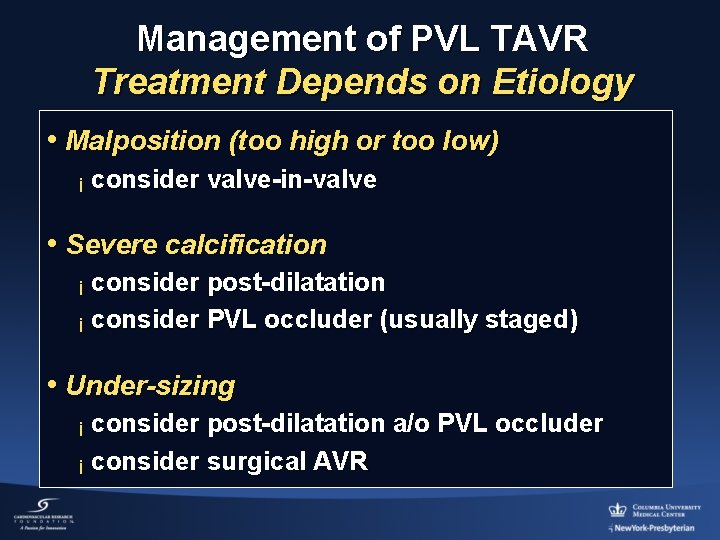
Management of PVL TAVR Treatment Depends on Etiology • Malposition (too high or too low) ¡ consider valve-in-valve • Severe calcification ¡ consider post-dilatation ¡ consider PVL occluder (usually staged) • Under-sizing ¡ consider post-dilatation a/o PVL occluder ¡ consider surgical AVR
Valve-in-Valve
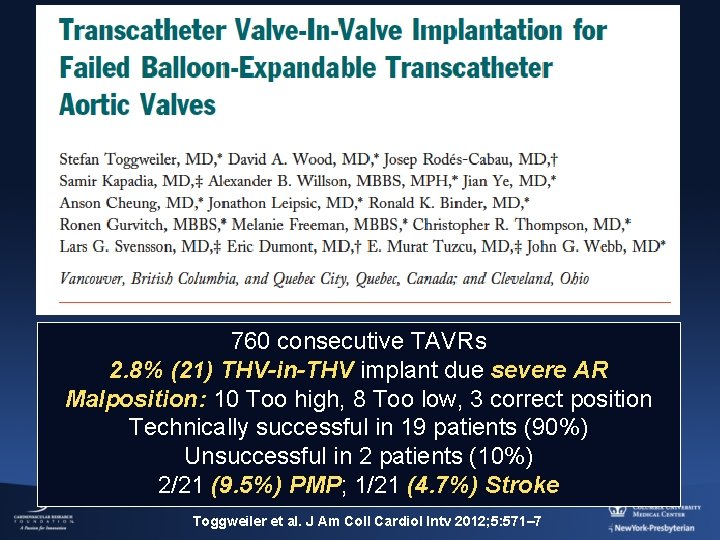
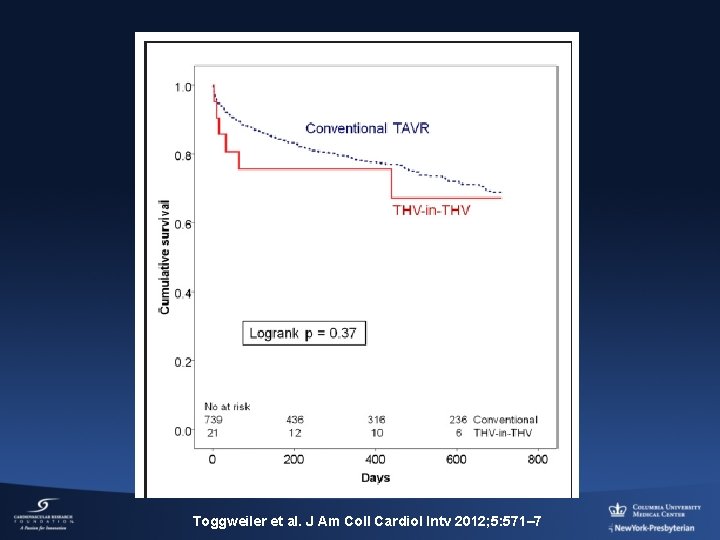
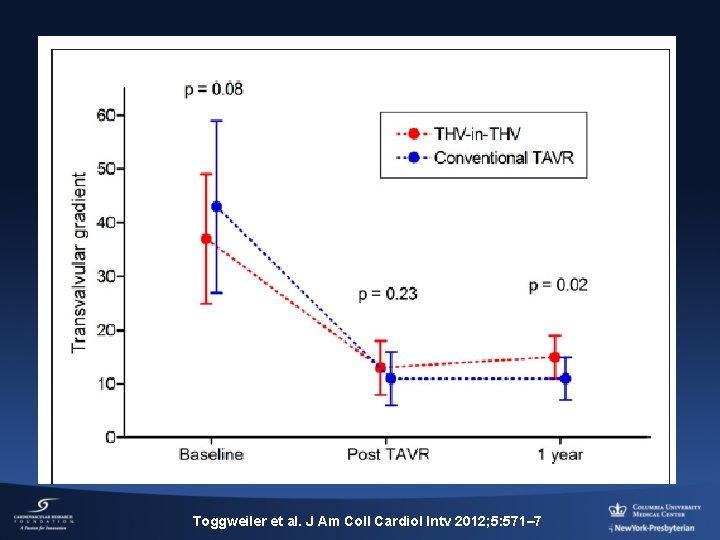
760 consecutive TAVRs 2. 8% (21) THV-in-THV implant due severe AR Malposition: 10 Too high, 8 Too low, 3 correct position Technically successful in 19 patients (90%) Unsuccessful in 2 patients (10%) 2/21 (9. 5%) PMP; 1/21 (4. 7%) Stroke Toggweiler et al. J Am Coll Cardiol Intv 2012; 5: 571– 7
Toggweiler et al. J Am Coll Cardiol Intv 2012; 5: 571– 7
Toggweiler et al. J Am Coll Cardiol Intv 2012; 5: 571– 7
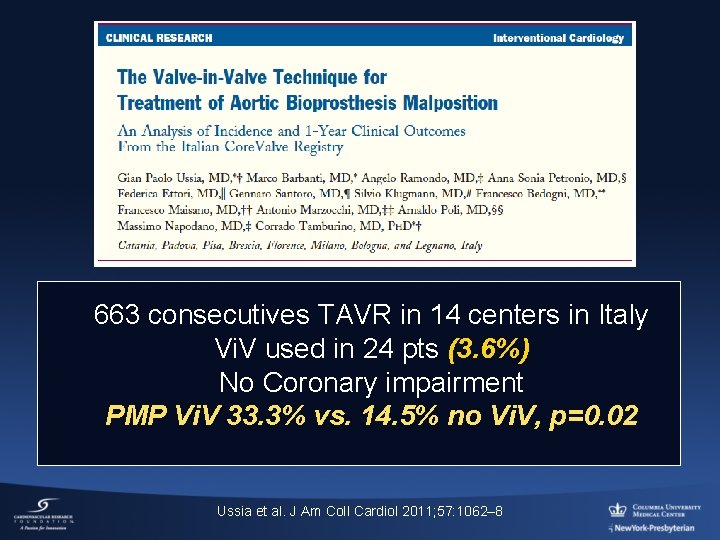
663 consecutives TAVR in 14 centers in Italy Vi. V used in 24 pts (3. 6%) No Coronary impairment PMP Vi. V 33. 3% vs. 14. 5% no Vi. V, p=0. 02 Ussia et al. J Am Coll Cardiol 2011; 57: 1062– 8
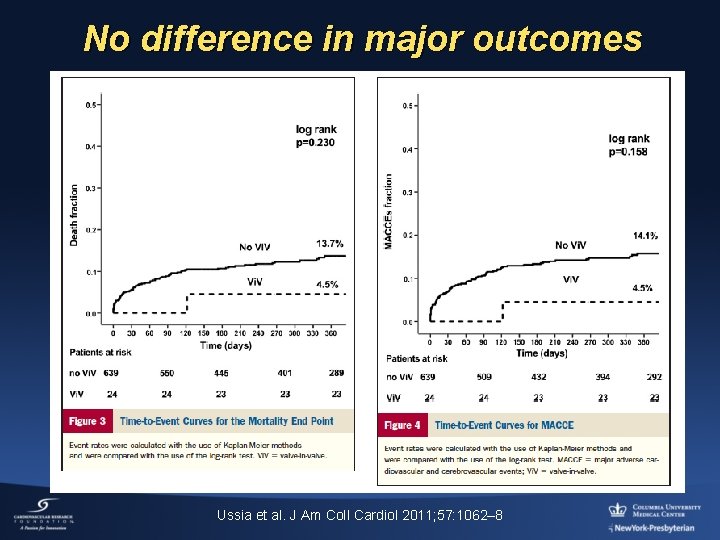
No difference in major outcomes Ussia et al. J Am Coll Cardiol 2011; 57: 1062– 8
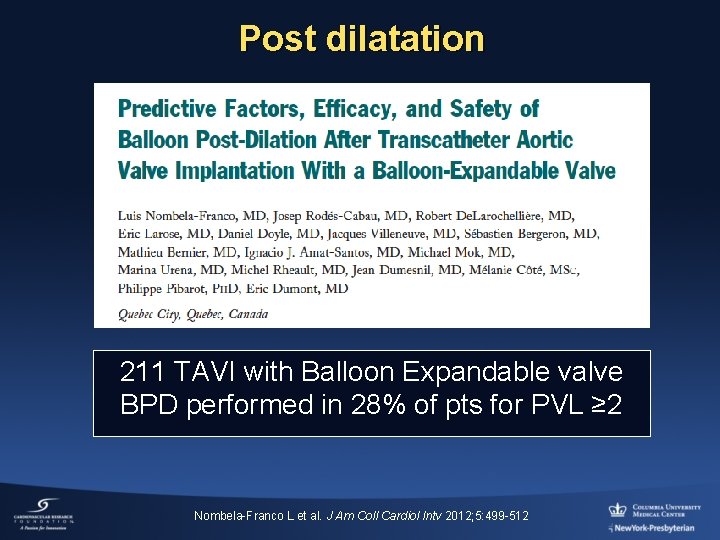
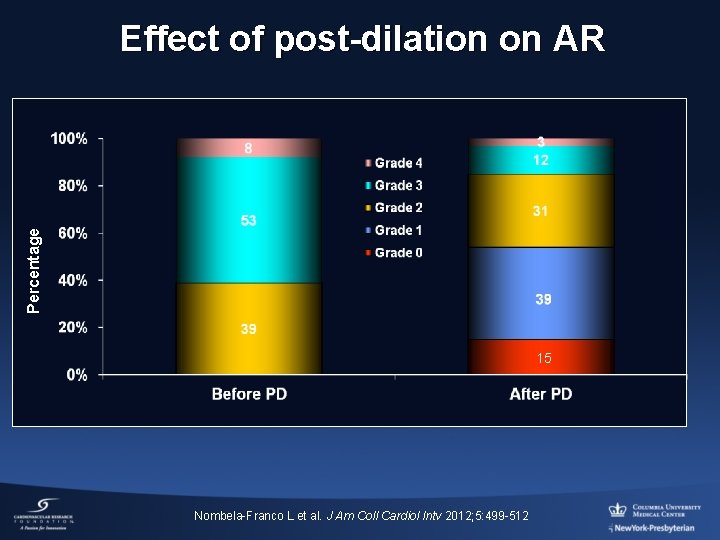
Post dilatation 211 TAVI with Balloon Expandable valve BPD performed in 28% of pts for PVL ≥ 2 Nombela-Franco L et al. J Am Coll Cardiol Intv 2012; 5: 499 -512
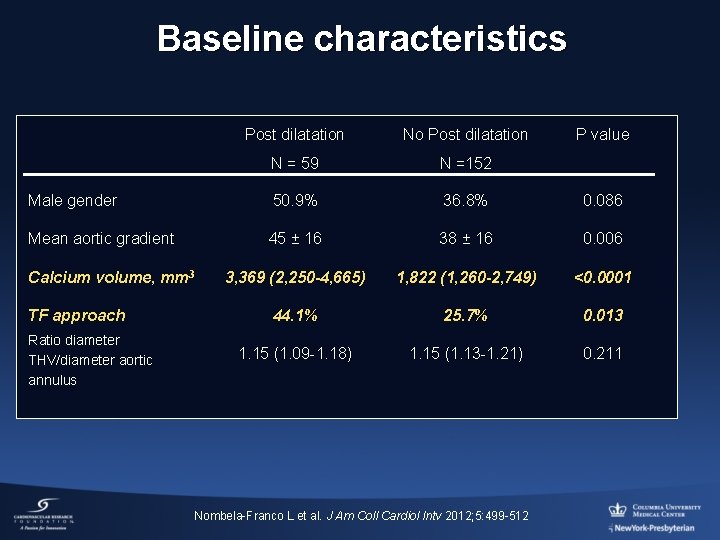
Baseline characteristics Post dilatation No Post dilatation N = 59 N =152 Male gender 50. 9% 36. 8% 0. 086 Mean aortic gradient 45 ± 16 38 ± 16 0. 006 3, 369 (2, 250 -4, 665) 1, 822 (1, 260 -2, 749) <0. 0001 44. 1% 25. 7% 0. 013 1. 15 (1. 09 -1. 18) 1. 15 (1. 13 -1. 21) 0. 211 Calcium volume, mm 3 TF approach Ratio diameter THV/diameter aortic annulus Nombela-Franco L et al. J Am Coll Cardiol Intv 2012; 5: 499 -512 P value
Percentage Effect of post-dilation on AR 15 Nombela-Franco L et al. J Am Coll Cardiol Intv 2012; 5: 499 -512
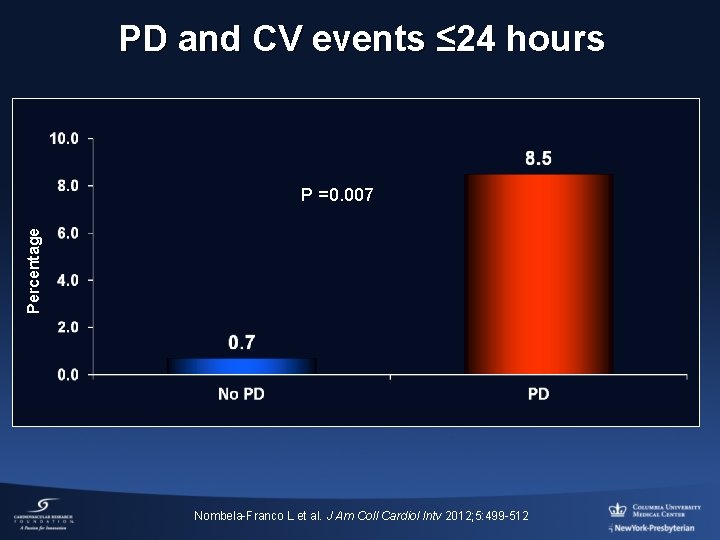
PD and CV events ≤ 24 hours Percentage P =0. 007 Nombela-Franco L et al. J Am Coll Cardiol Intv 2012; 5: 499 -512
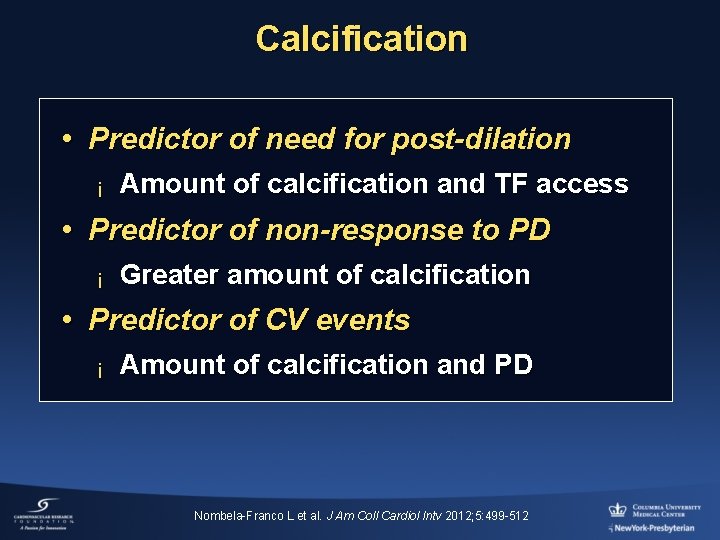
Calcification • Predictor of need for post-dilation ¡ Amount of calcification and TF access • Predictor of non-response to PD ¡ Greater amount of calcification • Predictor of CV events ¡ Amount of calcification and PD Nombela-Franco L et al. J Am Coll Cardiol Intv 2012; 5: 499 -512
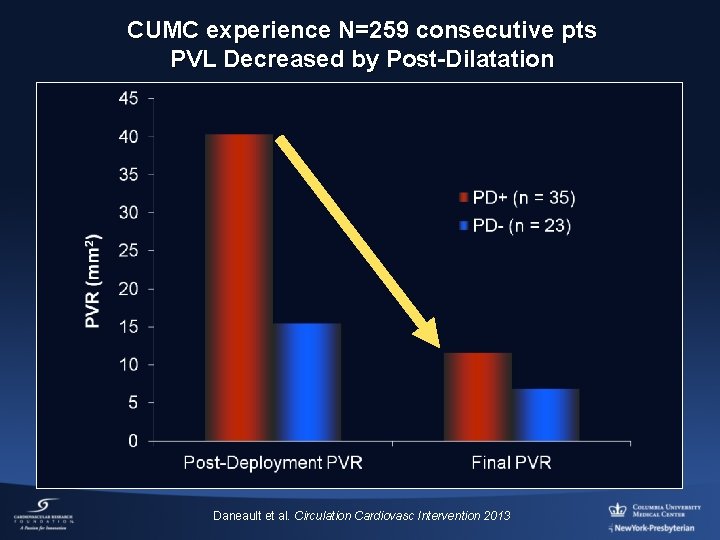
CUMC experience N=259 consecutive pts PVL Decreased by Post-Dilatation Daneault et al. Circulation Cardiovasc Intervention 2013
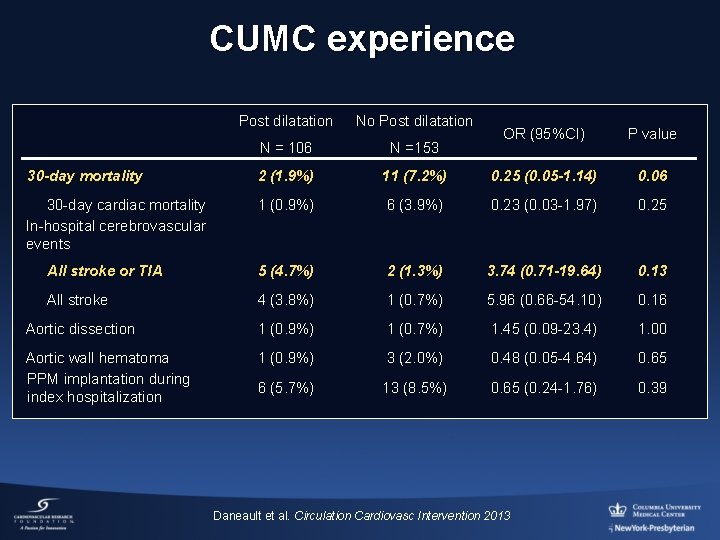
CUMC experience Post dilatation No Post dilatation N = 106 N =153 2 (1. 9%) 30 -day cardiac mortality In-hospital cerebrovascular events OR (95%CI) P value 11 (7. 2%) 0. 25 (0. 05 -1. 14) 0. 06 1 (0. 9%) 6 (3. 9%) 0. 23 (0. 03 -1. 97) 0. 25 All stroke or TIA 5 (4. 7%) 2 (1. 3%) 3. 74 (0. 71 -19. 64) 0. 13 All stroke 4 (3. 8%) 1 (0. 7%) 5. 96 (0. 66 -54. 10) 0. 16 Aortic dissection 1 (0. 9%) 1 (0. 7%) 1. 45 (0. 09 -23. 4) 1. 00 Aortic wall hematoma PPM implantation during index hospitalization 1 (0. 9%) 3 (2. 0%) 0. 48 (0. 05 -4. 64) 0. 65 6 (5. 7%) 13 (8. 5%) 0. 65 (0. 24 -1. 76) 0. 39 30 -day mortality Daneault et al. Circulation Cardiovasc Intervention 2013
The Future is promising for TAVR…
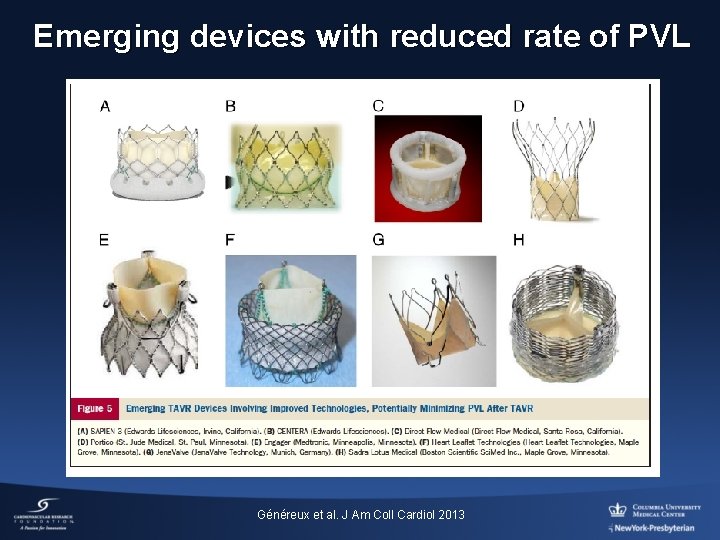
Emerging devices with reduced rate of PVL Généreux et al. J Am Coll Cardiol 2013
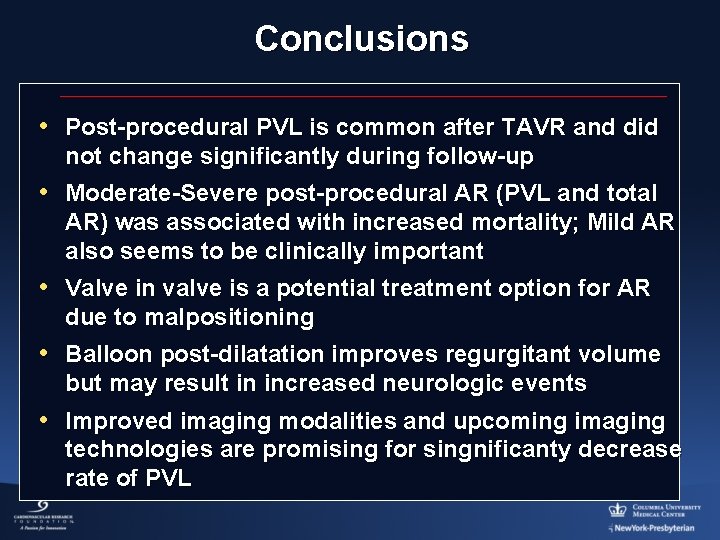
Conclusions • Post-procedural PVL is common after TAVR and did not change significantly during follow-up • Moderate-Severe post-procedural AR (PVL and total AR) was associated with increased mortality; Mild AR also seems to be clinically important • Valve in valve is a potential treatment option for AR due to malpositioning • Balloon post-dilatation improves regurgitant volume but may result in increased neurologic events • Improved imaging modalities and upcoming imaging technologies are promising for singnificanty decrease rate of PVL