Cardiac Physiology Part 1 Primary ED Exams Cardiac


- Slides: 26
Cardiac Physiology Part 1 Primary ED Exams
Cardiac Physiology • Electrical Conducting System • Spread of Excitation • Understanding an ECG • Revision of Electrical Potentials – pacemaker and action potentials • The Mechanical Pump • • The Cardiac Cycle Pressure and Volume Relationships Cardiac Output and Haemodynamic parameters Frank Starling Curves • The Vascular Plumbing • Blood supply and anatomy
Viva Questions • 2014 Viva – Draw and explain the action potential of a cardiac pacemaker cell • 2013 Viva – Describe the major difference between a ventricular muscle action potential and pacemaker cell potential
The Electrical Conducting System • Spread of excitation • Initiated in the SA node – located at junction of SVC and RA • Spreads through atrium through 3 tracts • Anterior tract – Bachman • Middler intermodal tract – Wenkebach • Posterior tract - Thorel • AV node • Nodal delay • AV node is continuous with the bundle of His • Left bundle and Right bundle • Left bundle – LAF, and LPF • Ventricular depolarisation – starts at the left side of the IV septum, spreads to apex then returns to the AV groove along the ventricular walls • Endocardial to epicardial • Last part to depolarise is the posterobasal LV
The Electrical Conducting System
The Electrical Conducting System
The Electrical Conducting System • • Funny Channel – allows more Na in than K At – 50 m. V T-Calcium channel opens adding to the pre potential At - 60 m. V L- Calcium Channel opens – triggering the action potential This creates the depolarisation, finishes around 0 m. V The L-type Ca Channels close The voltage K channels open, forcing them to go out of the cell Automaticity
Viva Questions • 2013 Viva Draw and describe an ECG tracing of a single heart beat. • What produces the waves and segments?
The Electrical Conducting System
The Electrical Conducting System • • P wave = Atrial Depolarisation PR interval = AV nodal conduction time Q wave = Septal depolarisation R wave = Early ventricular depolarisation S wave = Late ventricular depolarisation T wave = Ventricular repolarisation QT interval = Represents the time taken for ventricular depolarisation and repolarisation
• 2009 Viva: Draw an ECG trace and, below this demonstrate the left ventricular volume trace.
The Mechanical Pump – The cardiac cycle
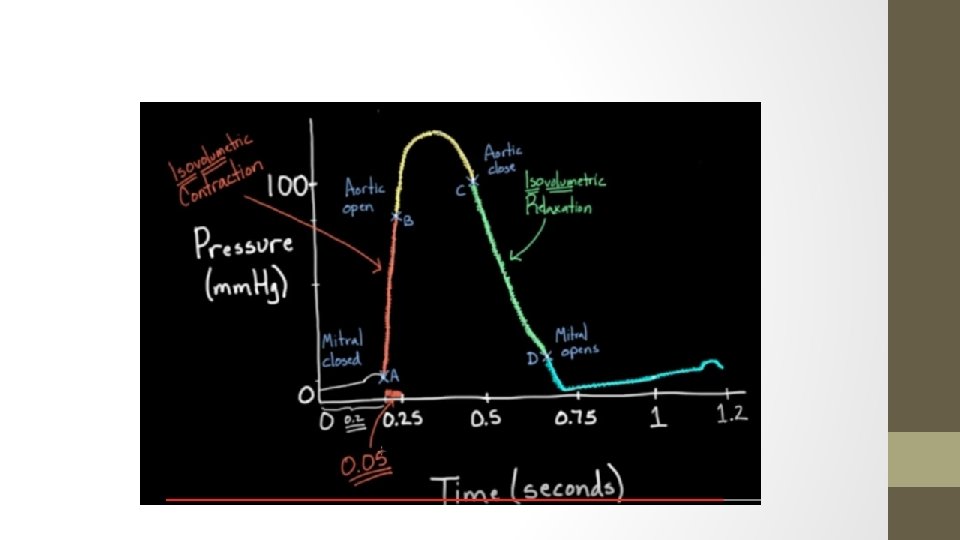
The Cardiac cycle – Components of WEGGERS diagram • Aortic pressure curve – arterial wave form (this is what is seen on the arterial line) • As the left ventricle ejects blood into the aorta the aortic pressure rises • The Diacrotic notch is reflective of the closing of the aortic valve
The LV Pressure Curve • LV begins contracting at a low pressure - just prior to contraction, there is an element of atrial systole – this is a positive deflection • At this point the ventricular pressure is grater than the atrial pressure so the mitral valve closes • After this there is a pressure peak due to isovolumetric contraction – up to a pressure GREATER than the aortic diastolic pressure (80 mm. Hg) • After this point the Aortic Valve opens – and blood leaves the left ventricle into the aorta • Blood in ejected into the Aorta, causes a peak at around 120 mm. Hg and then begins to drop
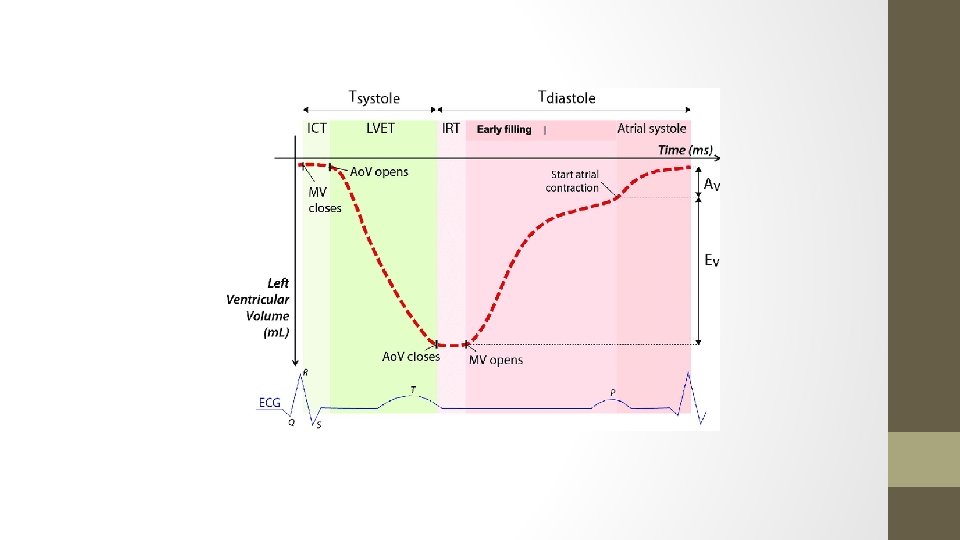
Left Ventricular Volume Curve • A B • Isovolumetric contraction – volume remains unchanged • C D • Isovolumetric relaxation – volume remains unchanged • ΔP = Q x R ΔP( difference in pressures), Q (flow in volume/time), R (Resistance – assumed to be steady within the heart = 1) • Therefore delta P = Q • After the opening of the AV – The ΔP between the aortic pressure and LV pressure decreases with time • Similarly after closing of the valve, atrial pressure and LV pressure differences decrease with time – and so the curve is logarithmic in appearance
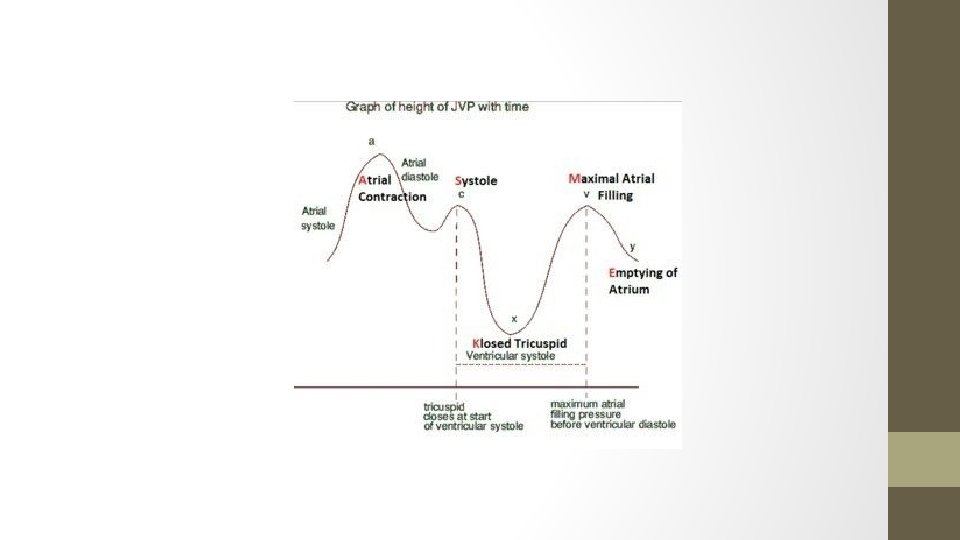
The Cardiac Cycle - Walkthrough • Starts with the mitral and tricuspid valves opening – Why? Because the atrial pressures have exceeded the ventricular pressure – and as long as that’s the case the MV and TV will stay open • This is followed by diastole – ventricular filling – towards the end of the diastole notice the P wave, this is atrial contraction and gives an atrial kick which accounts for 15 – 20% of preload – note the LV Volume rising proportional to the P wave, and a contraction of the atria leads to the a wave on the JVP • Next, following the QRS complex, which symbolises Ventricular contraction – ISOVOLEMIC CONTRACTION – which rapidly causes the pressure in the ventricle to exceed the pressure of the atria and causes the MV to close – this is S 1 • Also not that there is a notch on the atrial pressure curve – this is due to the pressure in the ventricles pushing back on the atria and decreasing the effective volume in the atria, thereby increasing the pressure and causing a notch and on the JVP waveform – this is the C wave
Viva Questions • 2015 Viva: Please draw and label the pressure volume curve of the left ventricle. • Describe the pressure and volume changes in the left ventricle at the onset of systole. • Describe the pressure and volume changes in the left ventricle at the onset of diastole.
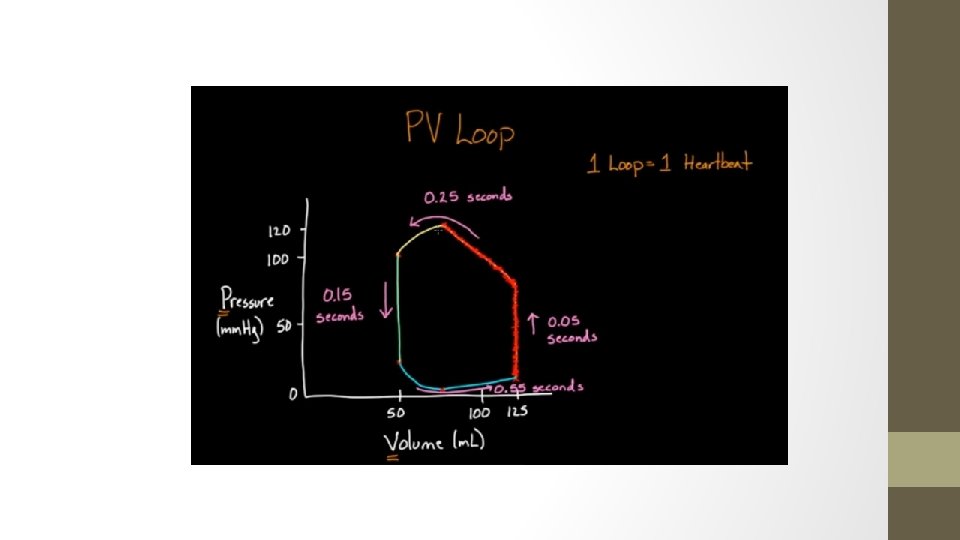
Ventricular Pressure Volume Curve • • 1 loop is one heart beat Time wise – systole is shorter than diastole Note that time is not on the axis, therefore it is a loop rather than a curve The loop can be used to calculate many variables • Pulse pressure – difference between systolic and diastolic pressure • Stroke volume – difference between EDV and ESV • Can calculate ejection fraction = SV/Peak volume
The Cardiac Cycle – Walkthrough • This pressure in the ventricle is eventually going to build up and exceed the aortic pressure (80 mm. Hg) – the patient’s diastolic pressure. At this point the aortic valve opens. • The aortic pressure rises to a systolic of 120 mm. Hg – equal to the LV pressure peak, at which point the pressure in the LV drops to become lower than the aortic pressure, closing the aortic valve again. “S 2” • The closing of the aortic valve causes the diacritic notch – this is basically a rebound effect, as all the blood escapes into the aorta there is an element of retrograde flow which is stopped by the sudden closure of the aortic valve and this ‘rebound’ effect causes the notch. • Need to remember that during Ventricular systole – the atria are undergoing diastole and they are filling, so there is a rise in the atrial pressures. • Once the aortic valve is closed – a process of ISOVOLEMIC RELAXATION – which occurs until a point where the ventricular pressure is lower than the atrial pressure – then the mitral valve opens again.
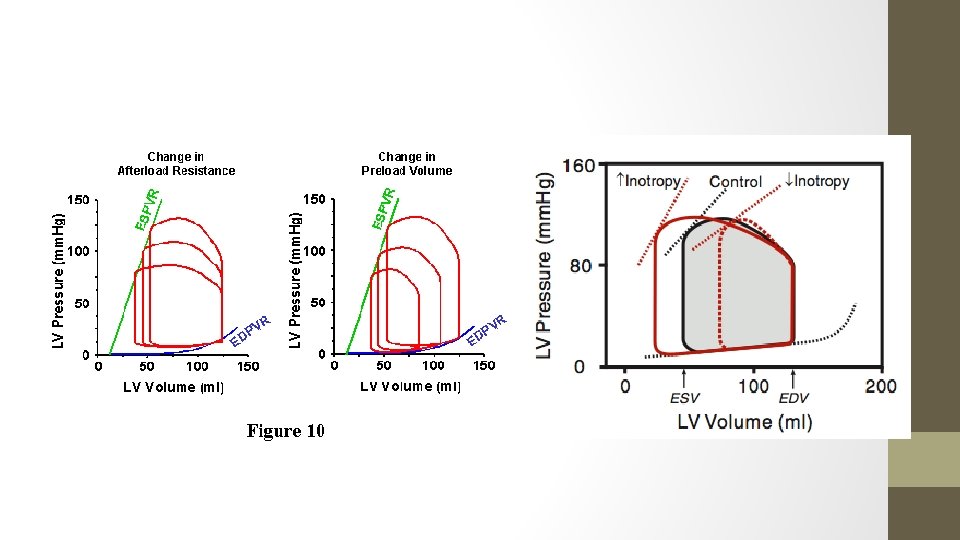
ESPVR and EDPVR – End Systolic/Diastolic pressure – volume curve • Extra volume can be used to increase the EDV in the curve – but this will obviously demand a rising pressure • ESPVR (End systolic pressure – volume relationship) – removing volume at the end of systole will also cause a decrease in the end systolic pressure • The curve starts at a minimal volume (and not at 0) because the ventricle needs to be filled before it can be stretched to generate pressure
Disease States • The EDPVR and ESPVR allow an illustration of how CO is affected by alterations in afterload and pre load