Cardiovascular Physiology Heart Cardiac Cells Cardiac Muscle Contraction


")


 Medulla To SA node To AV node Cervical To SA node")

 § Noninvasive way to measure electrical")

 and RA (-) Lead II: LL (+) and")


 AV node (start of QRS)")


 atrial impulses are conducted through")


 2.")


 § Blood relaxed atria")
 § Ventricles continue contracting § Ventricular")


")


")


- Slides: 63
Cardiovascular Physiology: Heart Cardiac Cells Cardiac Muscle Contraction Nervous System Regulation Conduction System Cardiac Cycle
Cardiac Muscle Tissue Characteristics § Automaticity § Contraction without neural stimulation § Controlled by pacemaker cells § Extended contraction time § Ten times as long as skeletal muscle § Long absolute refractory period § Prevention of wave summation and tetanic contractions by cell membranes § Nervous system alters contraction force and rate
Cardiac Muscle Tissue Two kinds of cardiac cells: § Pacemaker cells (autorhythmic/ myogenic cells) § They spontaneously depolarize § Contractile cells (contract) § Get impulse from pacemaker cells via gap junctions contract § Both rely on K+, Ca+2, Na+, Cl§ AP’s look different
Electrical Conduction System Cunningham JG, Textbook of Veterinary Physiology, Saunders, 2002
Electrical Conduction in Myocardial Cells Membrane potential of autorhythmic cel Membrane potential of contractile cell Cells of SA node Contractile cell Intercalated disk with gap junctions Depolarizations of autorhythmic cells rapidly spread to adjacent contractile cells through gap junctions. Figure 14 -17
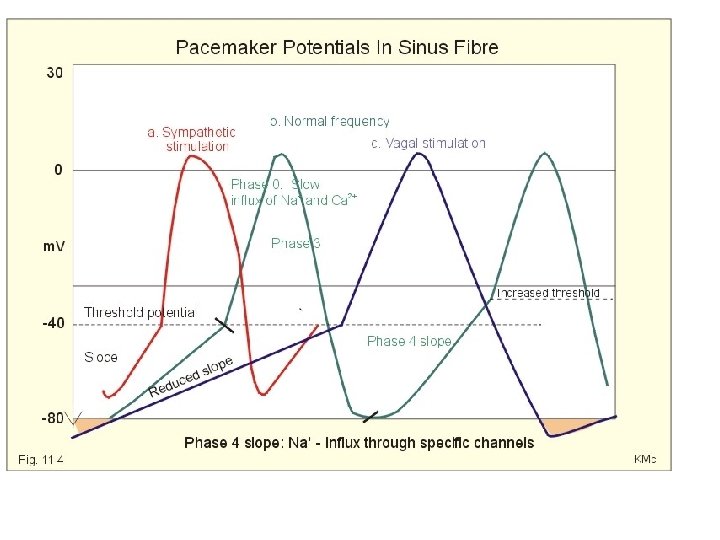
Cardiac Pacemaker Action Potential
Cardiac Muscle Tissue § Contractile cells § Low resting membrane potential= -96 mv § Get impulse from pacemaker cells via gap junctions § Depolarize contract § Long absolute refractory period—why is this important?
Cardiac Contractile Cell AP
Myocardial Contractile Cells § Absolute refractory period in cardiac muscle Figure 14 -14 c
http: //www. colorado. edu/intphys/Class/IPHY 3430 -200/012 cardiovascular. htm
Cardiac Cells § Pacemaker cells are slow to depolarize and are autorhythmic § Contractile cells have a long absolute refractory period § Both ensure the heart works as an effective pump
Cardiac Muscle Cell Contraction § Occurs in contractile cells only § Once the contractile cells get the impulse from pacemaker cells what happens?
1 Action potential enters from adjacent cell. 1 ECF ICF Ry. R SR L-type Ca 2+ channel Sarcoplasmic reticulum (SR) Ca 2+ stores T-tubule Figure 14 -11, step 1
Ca 2+ 1 ECF 1 Action potential enters from adjacent cell. 2 ICF Ry. R Voltage-gated Ca 2+ channels open. Ca 2+ enters cell. 2 SR L-type Ca 2+ channel Sarcoplasmic reticulum (SR) Ca 2+ stores T-tubule Figure 14 -11, steps 1– 2
Ca 2+ 1 ECF 1 Action potential enters from adjacent cell. 2 ICF Ry. R 2 3 SR Ca 2+ L-type Ca 2+ channel Sarcoplasmic reticulum (SR) Voltage-gated Ca 2+ channels open. Ca 2+ enters cell. 2+ 2+ 3 Ca induces Ca release through ryanodine receptor-channels (Ry. R). Ca 2+ stores T-tubule Figure 14 -11, steps 1– 3
Ca 2+ 1 ECF 1 Action potential enters from adjacent cell. 2 ICF Ry. R 2 3 SR L-type Ca 2+ channel 4 Ca 2+ sparks Sarcoplasmic reticulum (SR) Ca 2+ stores Voltage-gated Ca 2+ channels open. Ca 2+ enters cell. 2+ 2+ 3 Ca induces Ca release through ryanodine receptor-channels (Ry. R). release causes 4 Local Ca 2+ spark. T-tubule Figure 14 -11, steps 1– 4
Ca 2+ 1 ECF 1 Action potential enters from adjacent cell. 2 ICF Ry. R 2 3 SR L-type Ca 2+ channel 4 Ca 2+ sparks T-tubule Sarcoplasmic reticulum (SR) Ca 2+ stores Voltage-gated Ca 2+ channels open. Ca 2+ enters cell. 2+ 2+ 3 Ca induces Ca release through ryanodine receptor-channels (Ry. R). release causes 4 Local Ca 2+ spark. 2+ 5 Summed Ca 2+ sparks create a Ca signal. 5 Ca 2+ signal Figure 14 -11, steps 1– 5
Ca 2+ 1 ECF 1 Action potential enters from adjacent cell. 2 ICF Ry. R 2 3 SR L-type Ca 2+ channel 4 Ca 2+ sparks T-tubule Sarcoplasmic reticulum (SR) Ca 2+ stores Voltage-gated Ca 2+ channels open. Ca 2+ enters cell. 2+ 2+ 3 Ca induces Ca release through ryanodine receptor-channels (Ry. R). release causes 4 Local Ca 2+ spark. 2+ 5 Summed Ca 2+ sparks create a Ca signal. 2+ 6 Ca ions bind to troponin to initiate contraction. 5 Ca 2+ signal 6 Contraction Figure 14 -11, steps 1– 6
After contraction relaxation how does relaxation occur? Ca 2+ 1 ECF 1 Action potential enters from adjacent cell. 2 ICF Ry. R 2+ 2+ 3 Ca induces Ca release through ryanodine receptor-channels (Ry. R). 2 3 SR L-type Ca 2+ channel 4 Ca 2+ sparks Voltage-gated Ca 2+ channels open. Ca 2+ enters cell. Sarcoplasmic reticulum (SR) release causes 4 Local Ca 2+ spark. Ca 2+ stores 2+ 5 Summed Ca 2+ sparks create a Ca signal. T-tubule 2+ 6 Ca ions bind to troponin to initiate contraction. 5 Ca 2+ signal 6 Contraction Ca 2+ 7 Relaxation occurs when Ca 2+ unbinds from troponin. Ca 2+ 7 7 Relaxation Actin Myosin Figure 14 -11, steps 1– 7
Ca 2+ 1 ECF 1 Action potential enters from adjacent cell. 2 ICF Ry. R 2+ 2+ 3 Ca induces Ca release through ryanodine receptor-channels (Ry. R). 2 3 SR L-type Ca 2+ channel 4 Ca 2+ sparks Sarcoplasmic reticulum (SR) release causes 4 Local Ca 2+ spark. Ca 2+ stores ATP T-tubule Voltage-gated Ca 2+ channels open. Ca 2+ enters cell. 2+ 5 Summed Ca 2+ sparks create a Ca signal. 8 2+ 6 Ca ions bind to troponin to initiate contraction. 5 Ca 2+ signal 6 Contraction Ca 2+ 7 Relaxation occurs when Ca 2+ unbinds from troponin. Ca 2+ 7 7 Relaxation Actin 2+ 8 Ca is pumped back into the sarcoplasmic reticulum for storage. Myosin Figure 14 -11, steps 1– 8
9 10 Ca 2+ 1 ECF 3 Na+ Ca 2+ 2 K+ ATP ICF 1 Action potential enters from adjacent cell. NCX 3 Na+ Ry. R 2 Ca 2+ 2+ 2+ 3 Ca induces Ca release through ryanodine receptor-channels (Ry. R). 2 3 SR L-type Ca 2+ channel 4 Ca 2+ sparks Sarcoplasmic reticulum (SR) release causes 4 Local Ca 2+ spark. Ca 2+ stores ATP T-tubule Voltage-gated Ca 2+ channels open. Ca 2+ enters cell. 2+ 5 Summed Ca 2+ sparks create a Ca signal. 8 2+ 6 Ca ions bind to troponin to initiate contraction. 5 Ca 2+ signal 6 Contraction Ca 2+ 7 Relaxation occurs when Ca 2+ unbinds from troponin. Ca 2+ 7 7 Relaxation Actin Myosin 2+ 8 Ca is pumped back into the sarcoplasmic reticulum for storage. 2+ 9 Ca is exchanged with Na+ by the NCX antiporter. 10 Na+ gradient is maintained by the Na+-K+-ATPase. Figure 14 -11, steps 1– 10
Nervous System Regulation § Cardiac tissue is innervated by autonomic nervous system @ SA node § a + b adrenergic receptors bind Nor-Epi (NT) + Epi (hormone) and increase depolarization of pacemaker cells § How does that affect heart rate and stroke volume? § Muscarinic cholinergic receptors bind Ach and decreases depolarization § How does that affect heart rate and stroke volume?
Vagus nerve (parasympathetic) Medulla To SA node To AV node Cervical To SA node T 1 T 2 T 3 T 4 T 5 Thoracic T 6 T 7 T 8 T 9 T 10 T 11 T 12 L 1 L 2 Lumbar Sacral Coccygeal Spinal Sympathetic cord chain Copyright © 2011 Pearson Education, Inc. Sympathetic cardiac nerve To AV node To ventricular myocardium
Drugs § Phenoxybenzamine is an antagonistic drug that binds to a-adrenergic receptors § Propranolol is an antagonistic drug that binds to b adrenergic receptors § Atropine (from deadly nightshade) is an antagonistic drug that binds to muscarinic type cholinergic receptors § How would these affect HR?
The Conducting System § Electrocardiogram (ECG or EKG) § Noninvasive way to measure electrical activity of the heart § Obtained by electrodes at specific body locations § Abnormal patterns diagnose damage
The Conducting System Figure 20– 14 a An Electrocardiogram: Electrode Placement for Recording a Standard ECG Copyright © 2009 Pearson Education, Inc. , publishing as Pearson Benjamin Cummings
Einthoven’s Triangle Lead I: LA (+) and RA (-) Lead II: LL (+) and RA (-) Lead III: LL (+) and LA (-) Each lead shows a different view of electrical current flow through the heart § Lead II shows the majority of electrical activity of heart § § Copyright © 2011 Pearson Education, Inc. , publishing as Benjamin Cummings. Figure 13. 15
The Conducting System § Features of an ECG § “ 0” on EKG represents an isoelectric line= no electrical activity § When waveform deflects up (+ deflection) electrical activity is going towards positive lead § When waveform deflects down (- deflection) electrical activity is going towards negative lead
The Conducting System Figure 20– 14 b An Electrocardiogram: An ECG Printout Copyright © 2009 Pearson Education, Inc. , publishing as Pearson Benjamin Cummings
Conduction System Use the animation below to correlate the EKG with electrical flow through the heart § http: //upload. wikimedia. org/wikipedia/commons/e/e 5/EC G_principle_slow. gif
The Conducting System § § § § Start of P wave=SA node P wave=atrial depolarization P-R interval=atrial depolarization AV node conduction P-R segment=AV node QRS interval=ventricle depolarization T wave=ventricle repolarization Systole=when heart is contracting what part of EKG is this? Diastole=when heart is at rest what part of EKG is this?
Autorhythmic Cells Location SA node (start of P wave) AV node (start of QRS) Bundle of His (part of QRS) Purkinje fibers (part of QRS) Firing Rate at Rest 70– 80 APs/min* 40– 60 APs/min 20– 40 APs/min – Fastest cells = pacemaker = set rate for rest of heart – Which is the pacemaker above? – If SA node is damaged can heart still beat?
Five Rules for Interpreting EKG’s 1. Rhythm is regular 2. Resting HR= 60 -100 BPM 3. P wave to QRS ratio is 1: 1 § For every P wave there is a QRS that follows 4. P-R interval= 0. 12 -0. 2 sec § Shows atrial AV conduction time 5. QRS interval= 0. 04 -0. 1 sec
ECG Arrhythmias: Abnormal Rates § Sinus rhythm = pace generated by SA node § Abnormal rates shown § Tachycardia = fast rhythm § Bradycardia = slow rhythm Copyright © 2011 Pearson Education, Inc. , publishing as Benjamin Cummings. Figure 13. 17 (1 of 4)
First Degree Heart Block § All atrial impulses are conducted to ventricles but there is a slowed/diminished conduction through AV node § So, P-R interval > 0. 20 sec § Increases delay between atrial and ventricular contraction
Second Degree Heart Block § Some (but not all) atrial impulses are conducted through AV node § Lose 1 -to-1 relationship between P wave and QRS complex § Lose 1 -to-1 relationship between atrial and ventricular contraction
Third Degree Heart Block Third degree block § Loss of conduction through the AV node § P wave becomes independent of QRS § Atrial and ventricular contractions are independent Copyright © 2011 Pearson Education, Inc. , publishing as Benjamin Cummings. Figure 13. 17 (2 of 4)
Abnormal Pacemaker § Ectopic pacemaker § Irritable cells produce random AP’s § Generate high rate of action potentials § Bypass conducting system § Disrupt ventricular contractions
ECG Arrhythmias: Atrial Fibrillation Causes can be hypercalcemia, myocarditis, pulmonary disease, and hypothyroidism
ECG Arrhythmias: Fibrillation Ventricular Fibrillation § Loss of coordination of electrical activity of heart § Death can ensue within minutes unless corrected Copyright © 2011 Pearson Education, Inc. , publishing as Benjamin Cummings. Figure 13. 17 (4 of 4)
The Cardiac Cycle Cardiac cycle = the period between the start of one heartbeat and the beginning of the next § Consists of systole + diastole § Systole=contraction § Diastole=relaxation
The Cardiac Cycle § Correlate the EKG with systole + diastole of the heart § Electrical events occur before mechanical contraction § EKG animation Copyright © 2009 Pearson Education, Inc. , publishing as Pearson Benjamin Cummings
The Cardiac Cycle Atrial Cardiac Cycle 1. Atria passively fill (end of diastole) 2. Atria isovolumetrically contract (start of systole) 3. Atria eject blood into ventricles (end of systole) 4. Atria relax (start of diastole) Ventricular Cardiac Cycle 1. Ventricles passively fill as atria fill and contract (end of diastole) 2. -4. Same steps as above
The Cardiac Cycle
Blood Flow and Pressure § During systole blood pressure increases § During diastole blood pressure decreases § Blood flows from high low pressure § Contractions and valves dictate blood flow through the heart
The Cardiac Cycle § Start at ventricular diastole and left side of heart (highest pressure values) § Blood flows from high low pressure § Contractions and valves dictate blood flow § Blood pressure in each chamber rises during systole and falls during diastoles
Isovolumetric contraction Ventricular ejection Atrial contraction Isovolumetric relaxation Ventricular filling Left atrium Right ventricle Left ventricle Ventricular filling Systole Early diastole Mid-to-late diastole Phase 1 2 3 4 volume (m. L) Pressure (mm Hg) Atrioventricular valves Open Closed Aortic and pulmonary Closed Open (semilunar) valves 110 Open Closed Aortic pressure 70 40 Atrial pressure Ventricular pressure 0 130 100 60 Heart sounds Electrocardiogram Copyright © 2011 Pearson Education, Inc. 1 Ventricular volume
The Cardiac Cycle 1. Ventricular Filling (Phase 1 on diagram) § Blood relaxed atria atrioventricular valves ventricles § Driven by pressure in veins (venous return) § Atria contract more blood in ventricles atria diastole § and ventricular systole begins 2. Isovolumetric Contraction (Phase 2) § Ventricles start to contract (systole) § Ventricular pressure > atrial pressure AV valves close § Semilunar valves are closed because ventricular pressure < pulmonary + aortic arterial pressures § So, no blood flowing=isovolumetric-same volume
The Cardiac Cycle 3. Ventricular Ejection (Phase 3) § Ventricles continue contracting § Ventricular pressure > aortic pressure § Blood aorta + pulmonary arteries (ventricular ejection) 4. Isovolumetric Relaxation (Phase 4) § Eventually ventricular pressure < aortic pressure semilunar valves close—start of diastole § All valves are closed so some blood is still in ventricles as they relax § Ventricular pressure < atrial pressure so AV valves open and ventricle passively fill with blood until they contract again
Ventricular Pressure Copyright © 2011 Pearson Education, Inc.
Aortic Pressure Copyright © 2011 Pearson Education, Inc.
Aortic Pressure § During ventricular contraction the aorta stored energy by stretching (pressure reservoir) § During ventricular diastole aorta releases pressure to maintain blood flow to body § This is why aortic pressure is higher than ventricular pressure during diastole § MAP=profusion pressure to organs § Dicrotic notch shows semilunar valves closing
Heart Sounds **Heart Murmur=sounds produced by regurgitation through valves Copyright © 2011 Pearson Education, Inc.
Changes in Ventricular Volume ** Left ventricle Copyright © 2011 Pearson Education, Inc.
Cardiodynamics Figure 20– 19 A Simple Model of Stroke Volume
Cardiodynamics § The movement and force generated by cardiac contractions § End-diastolic volume (EDV) § End-systolic volume (ESV) § Stroke volume (SV)= volume of blood ejected per beat § SV = EDV – ESV § Ejection fraction § The percentage of EDV represented by SV § Cardiac output (CO) § The volume pumped by left ventricle in 1 minute § CO=SV X HR Copyright © 2009 Pearson
Catecholamines Modulate HR KEY Integrating center Cardiovascular control center in medulla oblongata Efferent path Effector Tissue response Sympathetic neurons (NE or Epi) Parasympathetic neurons (Ach) 1 -receptors of autorhythmic cells Muscarinic receptors of autorhythmic cells Na+ and Ca 2+ influx K+ efflux; Ca 2+ influx Rate of depolarization Hyperpolarizes cell and rate of depolarization Heart rate
Catecholamines Modulate SV Figure 13. 29
Stroke Volume & Starling’s Law Increase EDV by increasing venous return via: • Skeletal muscle pump • Respiratory pump • Sympathetic nervous system • Arterial vasoconstriction Increase stretch of cardiac fibers Increase strength of contraction Increase stroke volume
Starling’s Law Figure 13. 28
Green= w/ adrenergic stimulation Blue= normal Yellow and red= heart failure; increased volume does not equal increase contraction and stroke volume http: //cardiovascres. oxfordjournals. org/content/77/4/627/F 1. expansion
Stroke Volume and Heart Rate Determine Cardiac Output CARDIAC OUTPUT is a function of Heart rate Stroke volume determined by Rate of depolarization in autorhythmic cells Force of contraction in ventricular myocardium is influenced by Decreases Due to parasympathetic innervation Increases increases Contractility Sympathetic innervation and epinephrine increases End-diastolic volume which varies with Venous constriction Venous return aided by Skeletal muscle pump Respiratory pump Figure 14 -31